EUR/USD
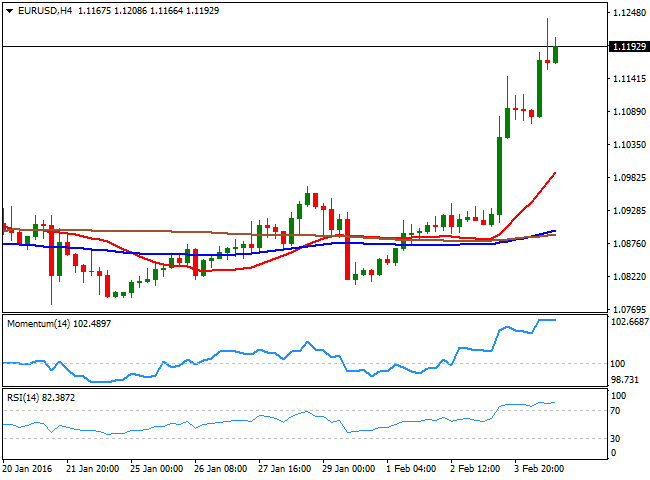
The EUR/USD pair rallied towards its highest since late October, reaching 1.1238 amid the continued dollar's selloff. US data came out mixed, but weak, as the weekly unemployment claims resulted at 285K for the week ending Jan 29, worse than the expected 280K. Unit labor cost improved during the last quarter of 2015, up by 4.5% against expectations of a 3.9% advance, but nonfarm productivity during the same period shrank by 3.0%. Finally, further signs of manufacturing weakness came with the release of Factory Orders for December, down by 2.9% compared to the previous month. Hovering around the 1.1200 region as Wall Street wobbles between gains and losses by the end of the day, the pair has spent most of this last session on the day consolidating gains, as investors moved to waitandsee mode ahead of the release of the US employment report this Friday. The US economy is expected to have added around 195K new jobs in January, the unemployment rate is expected to remain unchanged at 5%, while wages are expected slightly higher. Anyway, it will take a really strong conjunction of numbers for the releases to give the greenback some support that can be exacerbated by profit taking ahead of the weekend. In the meantime, the 4 hours chart shows that the technical indicators have lost their upward strength, but consolidate alongside with price, now horizontals near overbought levels. In the same chart, the 20 SMA maintains a sharp upward slope well below the current level, all of which maintains the latest bullish trend alive. Should the price extend beyond 1.1240, and end the week above it, there's room for additional gains up to 1.1460, a major long term resistance during the upcoming week.
Support levels: 1.1160 1.1120 1.1080
Resistance levels: 1.1240 1.1285 1.1320
GBP/USD
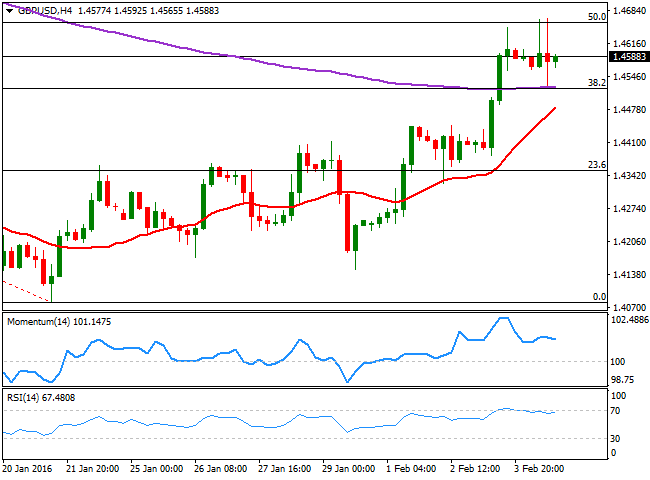
The GBP/USD pair is ending the day pretty much unchanged, as a dovish BOE weighed on Pound. The Central Bank had its economic policy meeting, offering alongside with the latest decision, the quarterly inflation report. All of the MPC members agreed to leave rates unchanged, for the first time since July, with Ian McCafferty, abandoning the hawkish bias. The BOE slashed its growth forecast to 2.2% from previous 2.5%. Governor Carney, said that the next likely move in rates will be up, but a timing is for now, out of the table. Overall, the announcement was no surprise, with the Bank of England joining worldwide partners in their easing bias. The GBP/USD initially fell with the release, posting a daily low of 1.4528, but quickly recovered ground and set a daily high of 1.4667. From a technical point of view, the pair has been contained between Fibonacci levels, finding buyers on an approach to the 38.2% retracement of the latest daily slump, but unable to rally beyond the 50% retracement of the same decline. The pair presents a neutral stance in the short term, as the price is hovering around a horizontal 20 SMA, while the technical indicators have no directional strength, stuck around their midlines.
Support levels: 1.4570 1.4530 1.4490
Resistance levels: 1.4625 1.4660 1.4690
USD/JPY
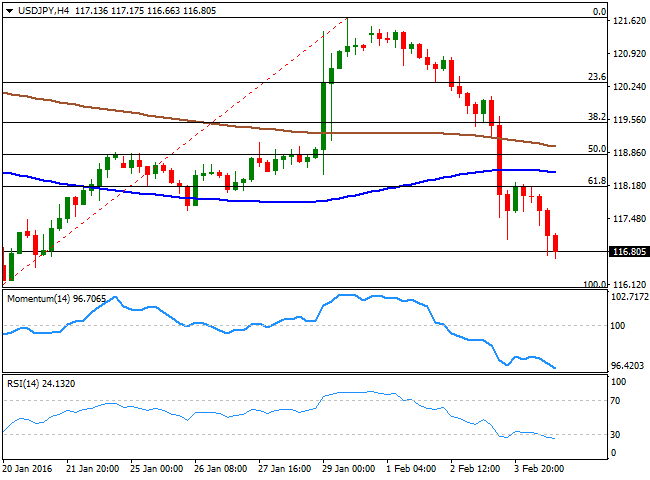
The USD/JPY pair resumed its decline and reached a fresh low of 116.63 during US trading hours, holding nearby as the day comes to an end. The price has been steadily falling ever since failing to recover above the 118.20 level, the 61.8% retracement of the latest bullish run. But it was poor US factory and employment data which pushed the pair further lower and below the 117.00 figure, now the immediate resistance. Technically, the 1 hour chart is showing that the price remains far below the 100 and 200 SMAs, which are slowly turning south well above the current level, while the technical indicators have lost downward strength and turned flat within bearish territory. In the 4 hours chart, the technical indicators maintain strong bearish slopes in oversold territory, currently at fresh lows, while the price is also well below the 100 and 200 SMAs. A weakerthanexpected US employment report can send the pair to retest the low set last January at 115.95, while approaches to the mentioned 118.20 region will probably find selling interest, as the bearish trend will likely prevail.
Support levels:116.60 116.20 115.95
Resistance levels:117.00 117.35 117.70
GOLD
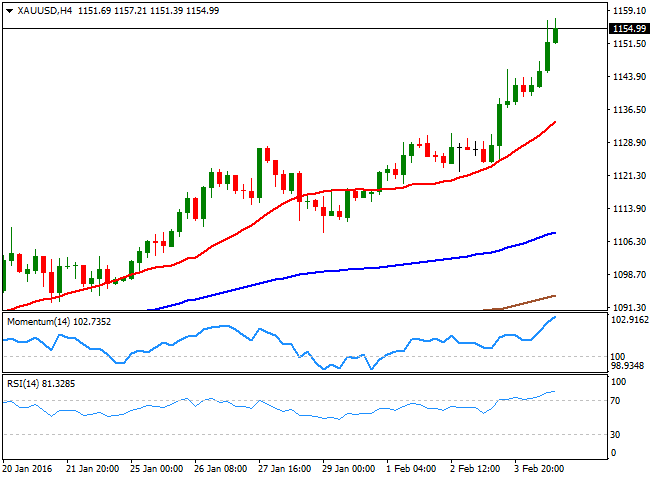
Gold prices continued rallying this Thursday, with spot at a fresh 4month high. The commodity advanced beyond the $1,150.00 level for the first time since late October, and climbed to a peak of $1,557 a troy ounce, on the back of a weaker dollar, which was pressured further by disappointing jobless claims and factory orders data. Currently trading around $1,155.00 and up 1.1% on the day, the daily chart shows that the 20 DMA advanced further above the 100 DMA, maintaining a strong upward slope, both well below the current level, while the technical indicators head sharply higher, despite being in overbought territory. For the shorter term, and according to the 4 hours chart, the bias is also towards the upside, as the technical indicators head north, also in extreme overbought territory, while the price is far above a bullish 20 SMA. A disappointing US jobs report on Friday can boost the bright metal, as it will likely put the FED on hold when it comes to rates.
Support levels: 1,151.40 1,142.80 1,136.10
Resistance levels: 1,157.20 1,162.50 1,169.05
WTI CRUDE
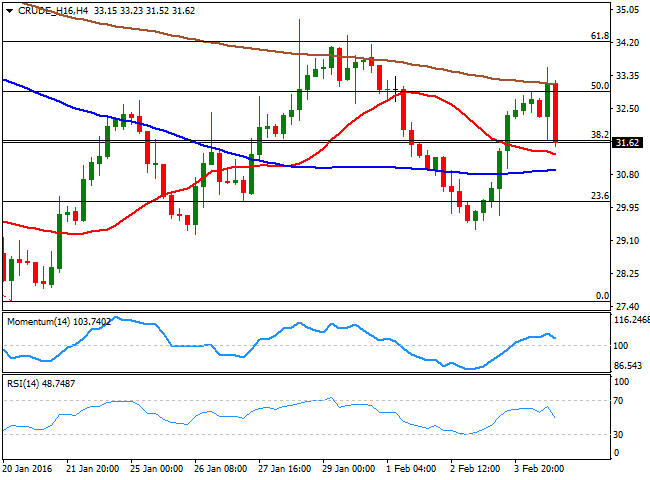
Crude oil prices started the day with a positive tone, with WTI futures jumping to a 3day high of $33.57 a barrel, following news coming from Russia, as the Defense Ministry spokesman, Major General Igor Konashenkov, said that they suspect Turkey is planning to invade Syria, which eventually may result in a reduction in oil's output. The commodity, however, reversed early gains and fell to negative ground for the day during the American session, dragged lower by a dollar's brief recovery across the board. And while the currency eased back, oil remains under pressure by the end of the day, trading near its daily low of $31.52 a barrel. Technically, the daily chart shows that the technical indicators have turned south within positive territory, as the price struggles around the 38.2% retracement of the latest bearish move, and the 20 SMA holds flat a few cents below the mentioned daily low. In the 4 hours chart, the technical indicators have also turned south, with the RSI indicator entering bearish territory, and the price approaching a strongly bearish 20 SMA.
Support levels: 31.50 31.00 30.40
Resistance levels: 32.35 32.95 33.60
DAX
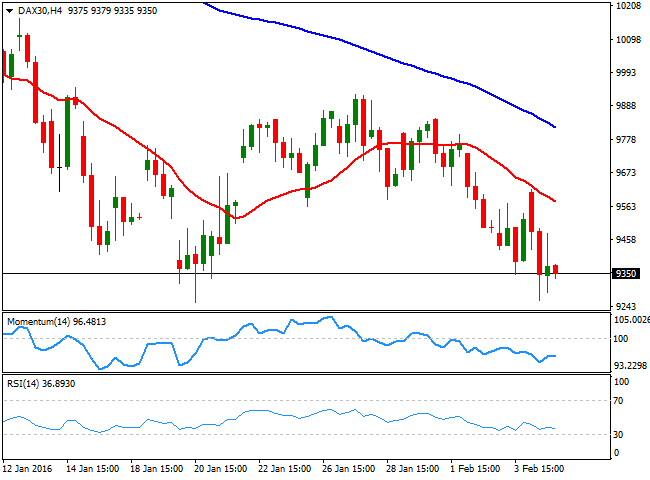
The German DAX lost 41 points to end the day at 9,393.36, although most European indexes managed to close in the green, as oil's prices recovered during the London session. The German index traded as low as 9,262, stalling its decline just above January's low of 9,256. ECB´s President, Mario Draghi, said that adopting a waitandsee attitude for too long, should inflation remain low, is riskier than taking early measures as the former approach could erode confidence. The comments spurred some risk sentiment among local investors, while a stronger EUR also weighed on local equities. The index is at a brink of breaking and over 1 year low, with the daily chart showing that it's back well below a sharply bearish 20 SMA, while the RSI indicator heads south around 37 and the Momentum indicator hovers in negative territory. Shorter term, the 4 hours chart shows that the 20 SMA has accelerated its decline above the current level, while the technical indicators remain well below their midlines. A break below 9,256 should lead to a downward acceleration, with the market then targeting the 9,000 figure.
Support levels: 9,335 9,256 9,178
Resistance levels: 9,410 9,487 9,543
DOW JONES
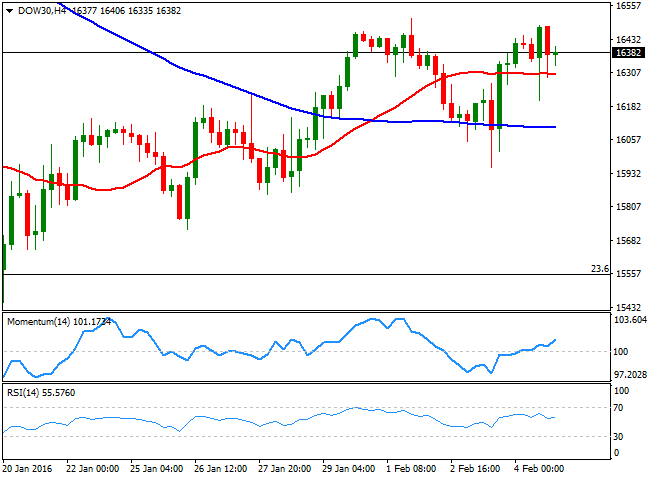
US indexes hovered between gains and losses for most of the day, closing the day slightly higher. The DJIA added 79 points and closed the day at 16,416.58, while the Nasdaq advanced 5 points to 4,509.56 and the SandP closed at 1,915.45, barely 0.15% higher. As for the Dow technical outlook, the daily chart presents an upward tone, given that the price met buying interest on a decline towards its 20 SMA, flat around 16,127, whilst the technical indicators head slightly higher above their midlines. In the 4 hours chart, the Momentum indicator heads north above its 100 level, while the RSI aims to turn north around 57, while the 20 SMA is also horizontal, offering an immediate support around 16,289. The index will likely follow the US employment report this Friday, with poor readings most likely triggering a downward move, as investors will be disappointed over the economic outlook. A strong reading on the other hand, can see this latest recovery extending, particularly on a break above 16,485, the immediate resistance level.
Support levels: 16,348 16,289 16,202
Resistance levels: 16,485 16,556 16,623
FTSE 100
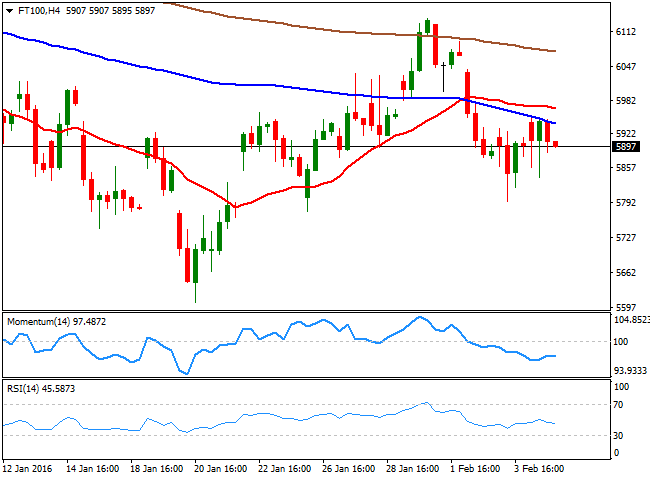
The FTSE 100 closed higher this Thursday, up by 1.06% to end at 5,898.76. Miners and energyrelated shares led the way higher, as a weaker dollar helped crude to advance during the European session. Anglo American added almost 20% the largest daily advance in over eight years, while Glencore added 16%. The afterhours decline in oil's prices, however, may weigh on the index opening this Friday. In the meantime, and according to the daily chart, the London benchmark looks slightly positive, as the index ended the day right above its 20 SMA, while the technical indicators are heading slightly higher above their midlines. In the 4 hours chart, however, the upside seems less likely, as the index is below a bearish 20 SMA, while the technical indicators head slightly lower within bearish territory.
Support levels: 5,876 5,820 5,765
Resistance levels: 5,933 5,990 6,042
The information set forth herein was obtained from sources which we believe to be reliable, but its accuracy cannot be guaranteed. It is not intended to be an offer, or the solicitation of any offer, to buy or sell the products or instruments referred herein. Any person placing reliance on this commentary to undertake trading does so entirely at their own risk.
Recommended Content
Editors’ Picks
AUD/USD remained bid above 0.6500

AUD/USD extended further its bullish performance, advancing for the fourth session in a row on Thursday, although a sustainable breakout of the key 200-day SMA at 0.6526 still remain elusive.
EUR/USD faces a minor resistance near at 1.0750

EUR/USD quickly left behind Wednesday’s small downtick and resumed its uptrend north of 1.0700 the figure, always on the back of the persistent sell-off in the US Dollar ahead of key PCE data on Friday.
Gold holds around $2,330 after dismal US data

Gold fell below $2,320 in the early American session as US yields shot higher after the data showed a significant increase in the US GDP price deflator in Q1. With safe-haven flows dominating the markets, however, XAU/USD reversed its direction and rose above $2,340.
Bitcoin price continues to get rejected from $65K resistance as SEC delays decision on spot BTC ETF options

Bitcoin (BTC) price has markets in disarray, provoking a broader market crash as it slumped to the $62,000 range on Thursday. Meanwhile, reverberations from spot BTC exchange-traded funds (ETFs) continue to influence the market.
US economy: slower growth with stronger inflation

The dollar strengthened, and stocks fell after statistical data from the US. The focus was on the preliminary estimate of GDP for the first quarter. Annualised quarterly growth came in at just 1.6%, down from the 2.5% and 3.4% previously forecast.
