SUPPORT: 1.1180 1.1145 1.1110/00 1.1070/60 1.1038....1.0998
RESISTANCE: 1.1208 1.1248/50 1.1284 1.1320/25 1.1367/70 1.1422/25*
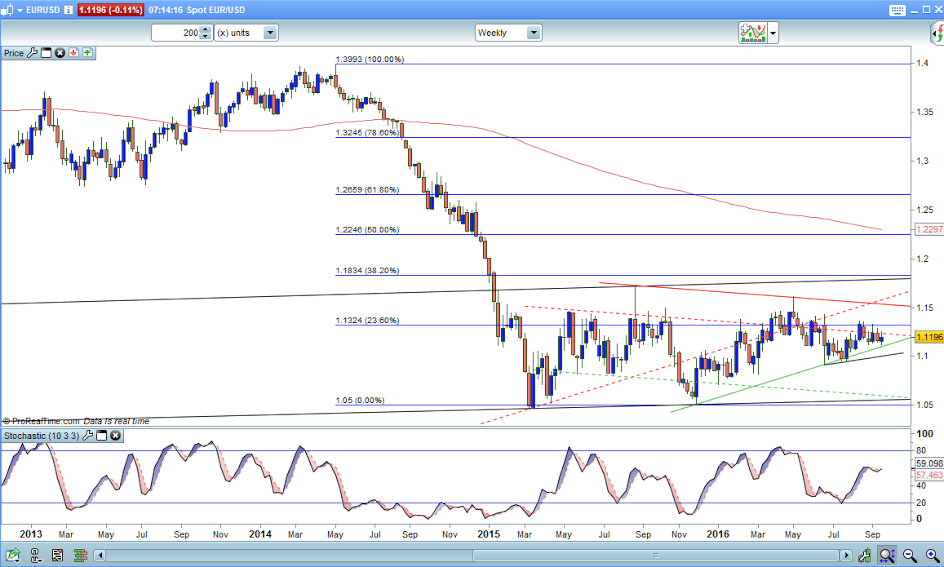
I have showing you a weekly chart of the Eur/Usd because I think we are at quite a critical time in its life...Now for all of 2014 the Euro was trending....we stopped in 2015....Take a close look at this weekly chart...we looked like we was making a continuation pattern....Now after reaching 10470 we rallied to 1.17...came down again in Nov 2015 to 10525....At that point the continuation pattern looked as though we were taking out the lows of 10470 and on our way to parity...However....it didn't...it stopped and rallied...Now in the world of charts and TA a base pattern will always take longer to form than a continuation pattern.....So....where am I leading....I am leading onto the fact that although we did not reach the 10470 area we did in fact make a Double Base....and for 2016 we have moved in a sideways to slightly higher way....I believe this confirms the base pattern which has taken nearly 2 years to form....I believe that this little market is about due to break to the topside....Why I hear you fundamentalists ask...Europe is in the doldrums....Europe will not hike rates....etc etc etc....As a pure technical trader these things do not concern me.....I believe short term weakness in the Euro gives opportunities to buy it....I believe....that this base pattern is coming to its conclusion and that the next big move we see will be to the topside....Now we have quite a bit of work to do before we can say...hey we have broken.....However....at the point where the Euro was being slaughtered by the markets, there was no reason on this planet why it would stop just short of 10470...No reason whatsoever.....So we did stop....why.....Because there were people out there with far greater fundamental knowledge than myself ( who has none ) but also technically...which is what I spied....Now even if we trade to the top of the pattern which is at 1.1785, that is still a long way off from where we are now....so you can see the potential for a greater move higher...The interesting part comes if we break this pattern....Patterns that take 2 years to form are a force to be reckoned with....So even if you are a scalper in Euros...Please be aware that the mood is changing...and has been for 2 years.....we break 1.1850 we clear this pattern and are on our way to 1.2250.....Now intra day this is not going to help you...Options I hear you ask...Yes...if your broker is good enough you can buy calls....timescale....well..I usually say that the length of time it takes to make the base pattern you halve it for the first target to be reached....Now the measured target off this base is 1.3000......I can hear the screams now resounding as you read this....In my 34 years of doing this and being an active trader nothing surprises me anymore about the markets....be they FX...Bonds....Precious metals or Stock indecies.....So why cant we go to 1.3000......I love being told a fundamental reason why we cant and yet 9 to 12 months later we are sitting there quite happily with markets at their long term projected targets and yet the world has not ended.....It is food for thought....and I strongly believe that now we are at the cusp from now until year end where the Euro will gradually gain in strength....and in 2016 you should see a break and the market trade higher....Day traders reading this.....we are buying down to 1.1100....and we are holding.....and only below 1.09 would I hold my hands up and say hey..I was wrong....so please , be aware that the market is changing.....we buy weakness.....we look at what our historical charts tell us....and we listen.....our first weekly target is 1.1540.....take care with shorts except in the short term.
The research provided by Charmer Charts is provided solely to enable clients to make their own investment decisions and does not constitute personal investment recommendations. No recommendations are made directly or indirectly by Technicalanalysisreports.com or Charmer Charts as to the merits or suitability of any investment decision or transaction that may result directly or indirectly from having viewed the technical analysis investment research. Customers are therefore urged to seek independent financial advice if they are in any doubt. The value of investments and the income derived from them can go down as well as up, and you may not get back the full amount you originally invested. Derivatives and foreign exchange trading are particularly high-risk, high-reward investment instruments and an investor may lose some or all of his or her original investment. Also, if you decide to acquire any investment denominated in a different currency you should note that changes in foreign exchange rates may have an adverse effect on the value, price and income of the investment in your own currency. Technicalanalysisreports.com or Charmer Charts shall not be liable for any direct or indirect, incidental or consequential loss or damage (including loss of profits, revenue or goodwill) arising from the use, inability to use, interruption or non-availability of the technical analysis investment research or any part of the research materials published or otherwise any loss of data on transmission, howsoever caused. Whilst the research material published is believed to be reliable and accurate, it is not independently verified. Accordingly, no representation or warranty is made or given by Technicalanalysisreports.com or Charmer Charts, its officers, agents or employees as to the accuracy or completeness of the same and no such person shall have liability for any inaccuracy in, or omission from, such materials.
Recommended Content
Editors’ Picks
EUR/USD stays below 1.0700 after US data

EUR/USD stays in a consolidation phase below 1.0700 in the early American session on Wednesday. The data from the US showed a strong increase in Durable Goods Orders, supporting the USD and making it difficult for the pair to gain traction.
USD/JPY refreshes 34-year high, attacks 155.00 as intervention risks loom

USD/JPY is renewing a multi-decade high, closing in on 155.00. Traders turn cautious on heightened risks of Japan's FX intervention. Broad US Dollar rebound aids the upside in the major. US Durable Goods data are next on tap.
Gold trades on the back foot, manages to hold above $2,300

Gold struggles to stage a rebound midweek following Monday's sharp decline but manages to hold above $2,300. The benchmark 10-year US Treasury bond yield stays in the green above 4.6% after US data, not allowing the pair to reverse its direction.
Worldcoin looks set for comeback despite Nvidia’s 22% crash Premium

Worldcoin price is in a better position than last week's and shows signs of a potential comeback. This development occurs amid the sharp decline in the valuation of the popular GPU manufacturer Nvidia.
Three fundamentals for the week: US GDP, BoJ and the Fed's favorite inflation gauge stand out Premium

While it is hard to predict when geopolitical news erupts, the level of tension is lower – allowing for key data to have its say. This week's US figures are set to shape the Federal Reserve's decision next week – and the Bank of Japan may struggle to halt the Yen's deterioration.