The biggest story in the financial markets is that of Deutsche Bank which surprisingly hardly hit the euro. The U.S. dollar was broadly higher as the U.S. economy grew faster than expected. Meanwhile, the British pound extended its losses against the majors while WTI crude oil jumped following the OPEC meeting. In addition, gold slipped to $1.318 and reached our suggested target.
U.S. GDP Grew Faster Than Expected in Q2
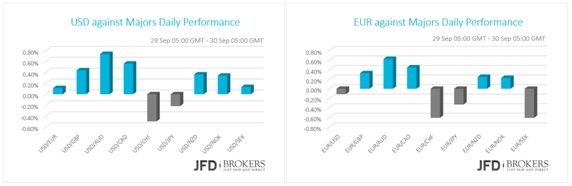
The U.S. dollar was broadly higher against the majors on Thursday and early Friday on the positive data released. The U.S. GDP grew faster in Q2 than previously estimated at an inflation-adjusted 1.4% seasonally adjusted annual rate. The initial estimation was at 1.1% growth rate during the spring. Personal consumption expenditures prices remained unchanged while the pending home sales experienced a significant drop of 2.4% in August, the lowest level since January, versus an increase of 1.2% the previous month.
Deutsche Bank Turmoil and the Euro
As Brexit enters a channel, now the biggest story in the financial markets is the Deutsche Bank. Many market participants are afraid that the central bank of the Federal Republic of Germany will become the next Lehman Brothers. During Tuesday’s European session, the DB stock fell 7% dragging the U.S. stocks down as well. The reason behind that fell is major newsagents’ reports that some hedge funds had taken out cash and withdrawn positions held with Deutsche Bank investment bank.
Following that turmoil, surprisingly the euro was not the hardest hit currency. The single currency was traded mixed against its G10 peers and was marginally changed against the greenback. The confidence indicators came out yesterday for September showed that business, industrial and economic sentiments are higher than expected while services and consumer sentiments remained steady. Unemployment rate and CPI are coming out later today and will be closely eyed.
EUR/USD – Technical Outlook
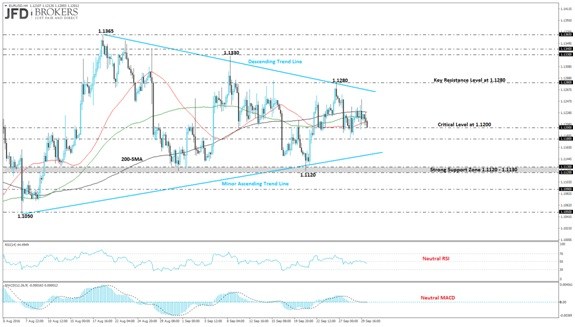
The most traded currency – the EUR/USD – ended the day virtually unchanged against the greenback. Not much movement in the pair with prices trading within 1.1180 – 1.1250 over the last two days. Important support to been retest at the 1.1200 psychological level, as it coincides with both the 50-SMA and the 100-SMA on the daily chart, followed by the crucial 1.1150 and 1.1130 levels. A move back below the latter might lead to weakness in the pair. Additionally, the 1.1280 level is acting as a key resistance level. If the price surpasses the latter level we might see further strengthen in the pair. The descending trend line that has been a significant obstacle since mid-August stand now around the 1.1280 barrier, yet the price still needs to clearly extend beyond that level to gain some bullish traction, whilst below the 1.1200, the decline can extend down to 1.1150. Technical indicators hold within neutral territory, although with no clear directional strength.
British Pound Extends Its Losses
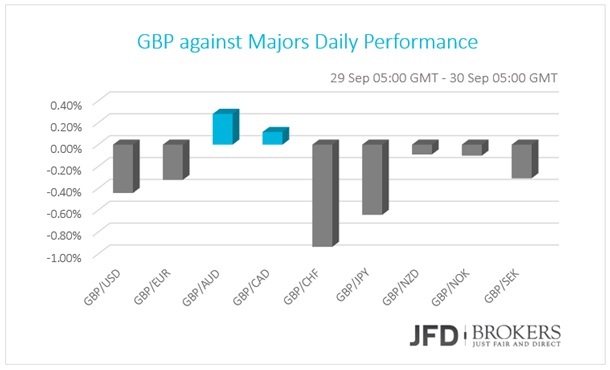
The British Pound extended its losses against the other major currencies on Thursday and early Friday. The data released, showed that UK’s mortgage approvals fell in August their lowest level since November 2014. On the other hand, the consumer credit advanced for the same month advanced and the GFK consumer confidence index for September peaked at three months high, surpassing market forecasts.
GBP/USD – Technical Outlook
The GBP/USD pair fell 0.4% during yesterday’s session and recorded the first negative daily candle after three positive days in a row. Currently, the pair is moving near the 1.2970 price level and was managing to retest the significant uptrend line. The cable is establishing within an upward sloping channel over the last three months after the UK decision to leave the European Union.
The technical structure suggests further sideways price action on the daily chart, while in the short-term timeframe the next initial targets to watch are the 1.2910 support level and the 1.2870 barrier which is near with the first support level of the pivot points. In addition, the 50-SMA on the 4-hour chart, is slightly above the current market price so the pair may test the latter level, as well as, the 1.2980 resistance level and then continue the downward movement. On the other hand, a break above the aforementioned obstacles will open the door for the 1.3060 key resistance level. The MACD oscillator is still following a negative path and is moving below its trigger line. The RSI indicator continues developing below 50 level.
Gold – Technical Outlook
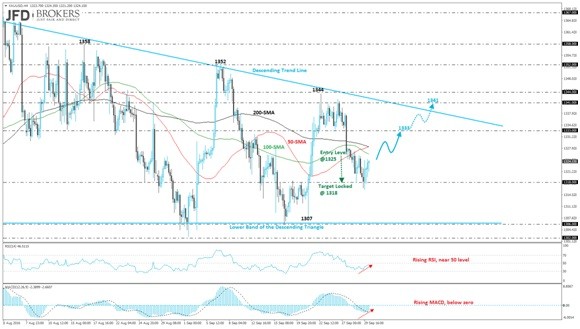
The yellow metal is still trading in a descending triangle over the daily chart, as it failed several times to break the falling trend line to the upside and the strong support level at the $1,306 to the downside. Over the last four days, the XAU/USD pair plunged more than 1.2% and recorded the fourth consecutive daily candle.
On our Wednesday’s analysis, we recommended an entry level at $1,325 price level and a first target at $1,318 where the price hit yesterday.
From the technical point of view, the precise metal now is moving slightly below the 100-daily SMA which seems to be a strong resistance for the bears while the 50-daily SMA coincides with the $1,333 barrier. Going to a lower timeframe, the 50-SMA had a bullish crossover with the 100-SMA and the 200-SMA so if the price surpasses the latter obstacles will expose to $1,333 resistance level. On the other hand, a rebound is possible on the three SMAs and the continuation of the downward movement. Technical indicators are rising and there are approaching their mid-levels.
WTI Crude Oil: Second Day in Green Following OPEC meeting
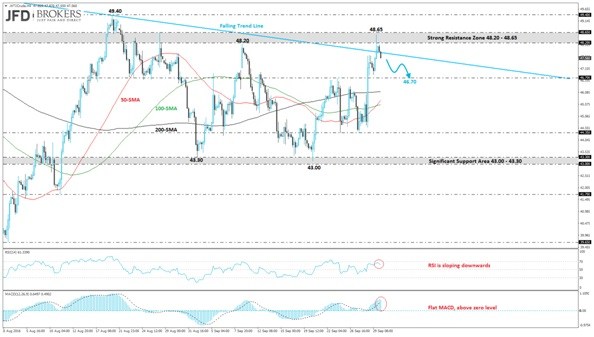
The West Texas Intermediate (WTI) created the second green day in a row and challenged the $48.65 resistance level. A first production cut in 8 years OPEC announced on Wednesday and highlights the frustration that oil nations feel about the 50% drop in crude prices over the last 2 years.
The oil recorded a fresh one-month high and broke the descending trend line which was holding since June to the upside. Currently, the price is moving below the falling trend line and is in progress to create a correction to the downside. The next level to watch is the $46.70 support level which overlaps with the 50-SMA on the 1-hour chart and the $44.35 where the price has to go through the three SMAs to challenge the latter level. Technical indicators on the 4-hour chart, are biased higher after entering the positive territory and turning neutral. The MACD oscillator is flattening in a positive territory while the RSI oscillator is following a positive path but is sloping downwards.
USD/TRY – Technical Outlook
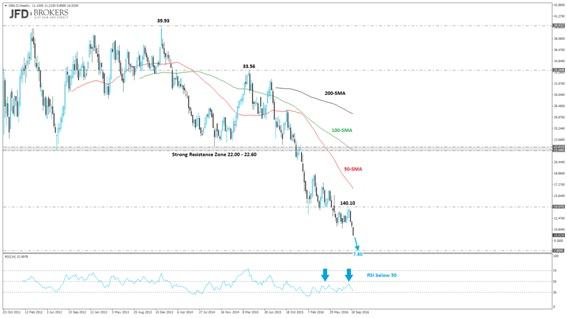
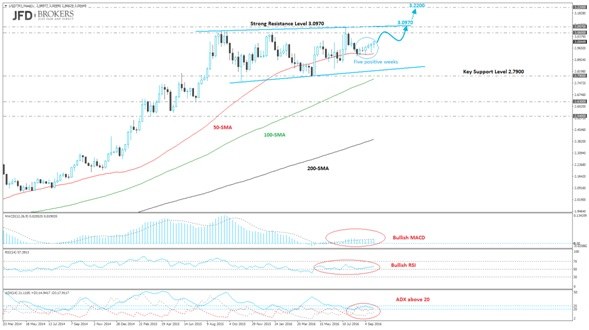
The USD/TRY pair has spent the whole 2014 year consolidating between the 2.7900 and the 3.0970 levels, after rising more than 25% the previous year. The technical picture keeps favoring the upside, as in the daily chart selling interest – 5 positive weekly candies – has surged on approaches to the 3.0970 region.
The upward move after testing the lower boundary of the pattern has not changed the medium-term bias that remains positive and only a break and a daily close below the 2.7900 could turn it into bearish. On the downside, there is plenty of support now in the 2.9650 area, a break of which would see run towards 2.9000 and eventually, 2.8750.
What to watch today
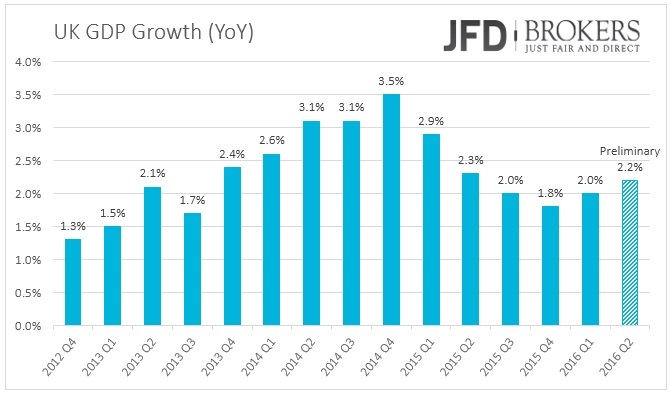
The significant market driver news is not over. Early in the European morning, the German retail sales will be released. A while later, attention turns to U.K. The U.K. GDP growth report for Q2 is expected to reveal any surprises, the economy is forecasted to keep the same pace of growing at 2.2% annually and at 0.6% quarterly.
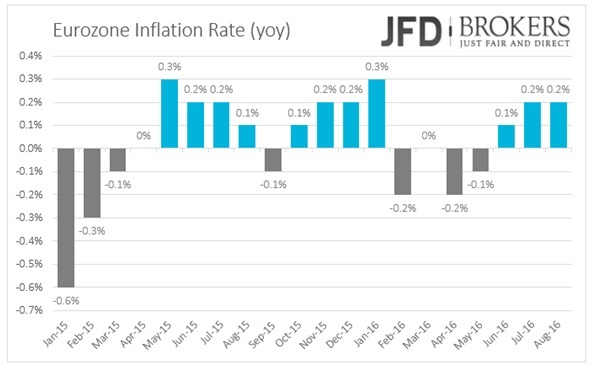
Eurozone’s flash inflation report for September is expected to show an increase of 0.4% from a smaller rise of 0.2% before. If the forecasts come true, it will be the biggest increase since October 2014. Moreover, August’s unemployment rate is estimated to fall at 10.0 from 10.1% before, giving us one more signal that Euro area’s economy may have started to pick up.
In U.S., the personal income and spending figures for August will be released as well as the PCE – price index. A while later, the Michigan consumer sentiment index is coming out for September and is predicted to have increased slightly to 90.0 from 89.8 before.
Good luck with your trades and have a great weekend!
The content we produce does not constitute investment advice or investment recommendation (should not be considered as such) and does not in any way constitute an invitation to acquire any financial instrument or product. JFD Group, its affiliates, agents, directors, officers or employees are not liable for any damages that may be caused by individual comments or statements by JFD Group analysts and assumes no liability with respect to the completeness and correctness of the content presented. The investor is solely responsible for the risk of his investment decisions. Accordingly, you should seek, if you consider appropriate, relevant independent professional advice on the investment considered. The analyses and comments presented do not include any consideration of your personal investment objectives, financial circumstances or needs. The content has not been prepared in accordance with the legal requirements for financial analyses and must therefore be viewed by the reader as marketing information. JFD Group prohibits the duplication or publication without explicit approval.
72,99% of the retail investor accounts lose money when trading CFDs with this provider. You should consider whether you can afford to take the high risk of losing your money. Please read the full Risk Disclosure: https://www.jfdbank.com/en/legal/risk-disclosure
Recommended Content
Editors’ Picks
AUD/USD failed just ahead of the 200-day SMA

Finally, AUD/USD managed to break above the 0.6500 barrier on Wednesday, extending the weekly recovery, although its advance faltered just ahead of the 0.6530 region, where the key 200-day SMA sits.
EUR/USD met some decent resistance above 1.0700

EUR/USD remained unable to gather extra upside traction and surpass the 1.0700 hurdle in a convincing fashion on Wednesday, instead giving away part of the weekly gains against the backdrop of a decent bounce in the Dollar.
Gold stays firm amid higher US yields as traders await US GDP data

Gold recovers from recent losses, buoyed by market interest despite a stronger US Dollar and higher US Treasury yields. De-escalation of Middle East tensions contributed to increased market stability, denting the appetite for Gold buying.
Ethereum suffers slight pullback, Hong Kong spot ETH ETFs to begin trading on April 30

Ethereum suffered a brief decline on Wednesday afternoon despite increased accumulation from whales. This follows Ethereum restaking protocol Renzo restaked ETH crashing from its 1:1 peg with ETH and increased activities surrounding spot Ethereum ETFs.
Dow Jones Industrial Average hesitates on Wednesday as markets wait for key US data

The DJIA stumbled on Wednesday, falling from recent highs near 38,550.00 as investors ease off of Tuesday’s risk appetite. The index recovered as US data continues to vex financial markets that remain overwhelmingly focused on rate cuts from the US Fed.