EUR/USD Current price: 1.1214
Majors are quieter this Friday, with the dollar recovering part of the ground lost earlier this week, but still broadly weak, amid FED's decision to keep rates on hold. The EUR/USD pair is trading near the 1.1200 level, pressured during the European morning by weak growth figures, according to the Markit PMIs. The EU Markit Composite PMI dropped to 52.6, the lowest in 20 months, while the German figure came in at 52.7, the lowest in over a year. In both cases, the services sector was the one showing a deeper slow, while manufacturing figures came better than in August. Scheduled for later on today, is the US Markit manufacturing PMI preliminary for September, expected at 51.9 from previous 52.0, and the weekly Baker Hughes report on active oil rigs in the country.
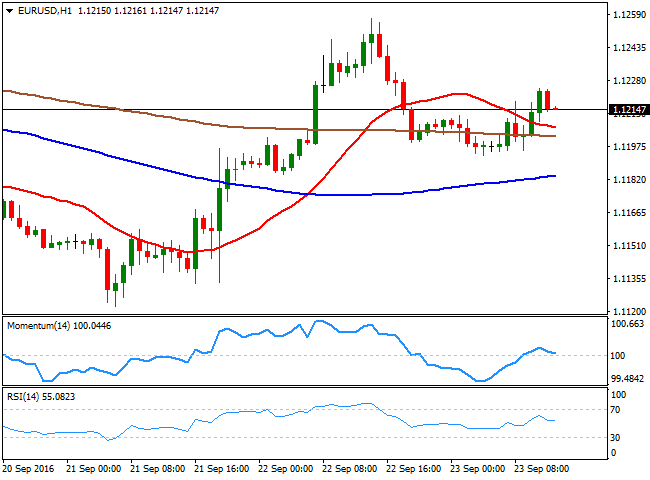
As for the technical picture for the pair, the 1 hour chart retains a modest positive tone, as the price is so far holding above all of its moving averages, while indicators are located in positive territory, although lacking directional strength. In the 4 hours chart, the price continues hovering around moving averages, while the technical indicators hold well above their mid-lines, but losing upward strength, limiting chances of a sharper recovery for the upcoming US session.
Support levels: 1.1190 1.1160 1.1120
Resistance levels: 1.1220 1.1250 1.1280
GBP/USD Current price: 1.2971
View Live Chart for the GBP/USD
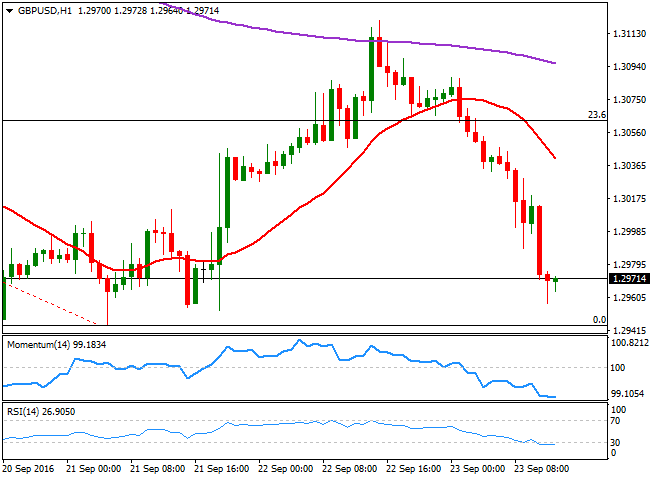
The GBP/USD pair resumed its bearish trend, accelerating its decline through the 1.3000 figure, and reaching 1.2956, trading not far from this last ahead of Wall Street's opening. There were no relevant macroeconomic news released in the UK this week, with the Pound still weighed by the latest BOE's decision to keep its policy unchanged. The short term picture supports a continued decline for the rest of the day, as in the 1 hour chart, the 20 SMA has turned sharply lower well above the current level, whilst the technical indicators have decelerated their declines, but remain within oversold readings and heading modestly lower. In the 4 hours chart, the price has broken below its 20 SMA, but the Momentum indicator remains flat around the 100 level, and the RSI around 38, with a break below the 1.2944 level, the weekly low, now required to confirm further declines.
Support levels: 1.2945 1.2910 1.2880
Resistance levels: 1.3000 1.3035 1.3070
USD/JPY Current price: 100.77
View Live Chart for the USD/JPY
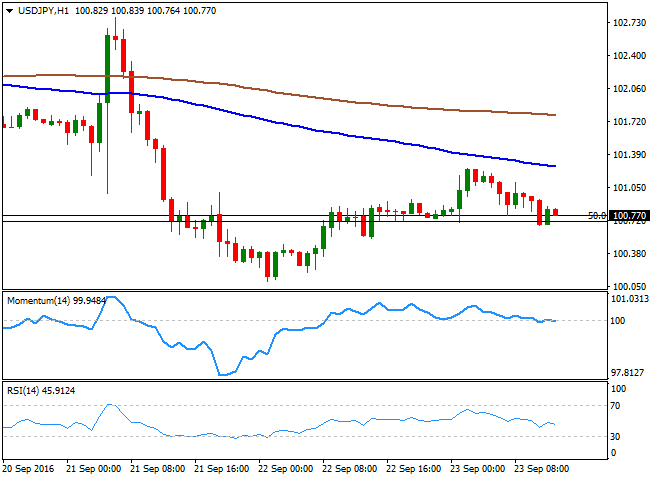
The USD/JPY pair corrected higher, reaching a daily high of 101.24 during the past Asian session, although the yen slowly recovered, holding now not far from the critical Fibonacci support around 100.65. Ahead of the release of US data, the pair retains the bearish tone, with the latest upward move understood as corrective. Technically, the 1 hour chart shows that the 100 SMA maintains a strong bearish slope above the current level, now capping the upside around the mentioned daily high, while indicators are heading south, now around their mid-lines. In the 4 hours chart, the Momentum indicator heads sharply lower within negative territory while the RSI indicator holds around 42 and the price well below their mid-lines, also supporting a retest of the 100.00 region, particularly if US macroeconomic figures disappoint.
Support levels: 100.65 100.35 100.00
Resistance levels: 101.10 101.60 102.00
AUD/USD Current price: 0.7627
View Live Chart for the AUD/USD
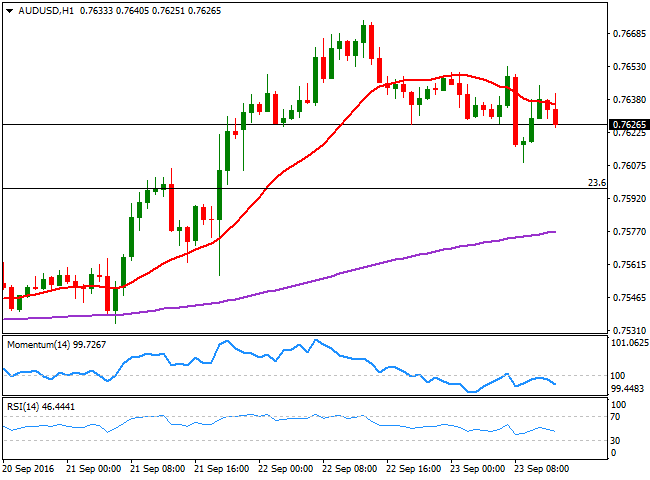
The AUD/USD pair trades modestly lower this Friday, weighed by a retracement in base metal prices, albeit gold remains near its weekly high. Still, the pair bounced quickly after an approach to the 0.7600 level, indicating that the downward potential remains limited. Technical readings in the 1 hour chart converge with such view, as in the 1 hour chart, the pair presents a neutral stance, hovering around its 20 SMA and with technical indicators heading nowhere within neutral territory. In the 4 hours chart, the price is above a sharply bullish 20 SMA, whilst technical indicators are slowly correcting overbought readings. The pair needs now to advance beyond 0.7675 to be able to extend its gains through the 0.7700 figure, with scope then to advance up to 0.7750.
Support levels: 0.7600 0.7570 0.7530
Resistance levels: 0.7675 0.7710 0.7750
Information on these pages contains forward-looking statements that involve risks and uncertainties. Markets and instruments profiled on this page are for informational purposes only and should not in any way come across as a recommendation to buy or sell in these assets. You should do your own thorough research before making any investment decisions. FXStreet does not in any way guarantee that this information is free from mistakes, errors, or material misstatements. It also does not guarantee that this information is of a timely nature. Investing in Open Markets involves a great deal of risk, including the loss of all or a portion of your investment, as well as emotional distress. All risks, losses and costs associated with investing, including total loss of principal, are your responsibility. The views and opinions expressed in this article are those of the authors and do not necessarily reflect the official policy or position of FXStreet nor its advertisers. The author will not be held responsible for information that is found at the end of links posted on this page.
If not otherwise explicitly mentioned in the body of the article, at the time of writing, the author has no position in any stock mentioned in this article and no business relationship with any company mentioned. The author has not received compensation for writing this article, other than from FXStreet.
FXStreet and the author do not provide personalized recommendations. The author makes no representations as to the accuracy, completeness, or suitability of this information. FXStreet and the author will not be liable for any errors, omissions or any losses, injuries or damages arising from this information and its display or use. Errors and omissions excepted.
The author and FXStreet are not registered investment advisors and nothing in this article is intended to be investment advice.
Recommended Content
Editors’ Picks
EUR/USD clings to daily gains above 1.0650

EUR/USD gained traction and turned positive on the day above 1.0650. The improvement seen in risk mood following the earlier flight to safety weighs on the US Dollar ahead of the weekend and helps the pair push higher.
GBP/USD recovers toward 1.2450 after UK Retail Sales data

GBP/USD reversed its direction and advanced to the 1.2450 area after touching a fresh multi-month low below 1.2400 in the Asian session. The positive shift seen in risk mood on easing fears over a deepening Iran-Israel conflict supports the pair.
Gold holds steady at around $2,380 following earlier spike

Gold stabilized near $2,380 after spiking above $2,400 with the immediate reaction to reports of Israel striking Iran. Meanwhile, the pullback seen in the US Treasury bond yields helps XAU/USD hold its ground.
Bitcoin Weekly Forecast: BTC post-halving rally could be partially priced in Premium

Bitcoin price shows no signs of directional bias while it holds above $60,000. The fourth BTC halving is partially priced in, according to Deutsche Bank’s research.
Week ahead – US GDP and BoJ decision on top of next week’s agenda

US GDP, core PCE and PMIs the next tests for the Dollar. Investors await BoJ for guidance about next rate hike. EU and UK PMIs, as well as Australian CPIs also on tap.