EUR/USD Current price: 1.1279
The dollar closed the day mixed, marginally lower against the common currency, but holding within familiar ranges, as the market waits for Yellen's speech this Friday. The EUR/USD pair advanced up to 1.1297 before retreating partially to settle around 1.1280, undermined by German's IFO survey, showing that the business climate suffered a setback in August, down to 106.2 from July´s 108.3. The assessment of the current situation fell down to 112.8 from previous 114.8, whilst the expectations sub-component fell to its lowest since October 2014, printing 100.1. In the US, weekly unemployment claims came in at 261K for the week ending August 19, better than the previous 262K and the 265K expected, showing that the labor market remains healthy. Orders for durable goods advanced by the most in almost a year, up by 4.4%, while ex transportation came un at 1.5% from previous -0.3%. The preliminary US Markit Services PMI, however, fell down to 50.9, showing that the sector's growth remains sluggish.
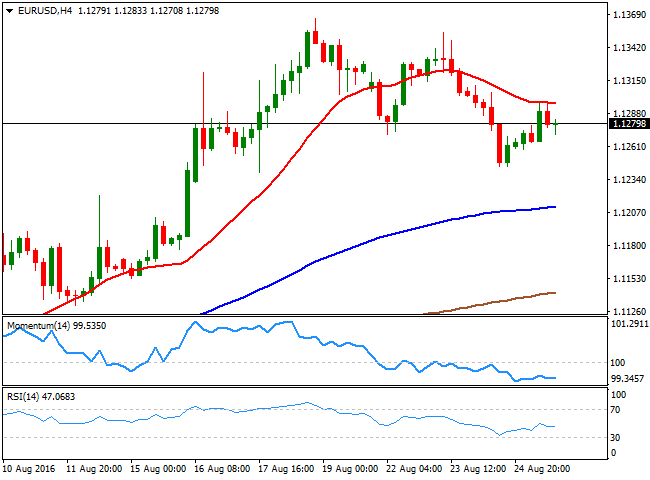
From a technical perspective, the pair has made no progress from previous updates, but the fact that it has been unable to regain the 1.1300 level inclines the balance towards the downside. In the 4 hours chart, the price has been capped by a now flat 20 SMA, currently at 1.1300, whilst the technical indicators head modestly lower within bearish territory, also in line with further slides. Anyway, upcoming direction will depend on how the market takes whatever Janet Yellen has to say on the timing of the next US Federal Reserve rate hike.
Support levels: 1.1245 1.1210 1.1180
Resistance levels: 1.1300 1.1340 1.3075
EUR/JPY Current price: 113.41
View Live Chart for the EUR/JPY
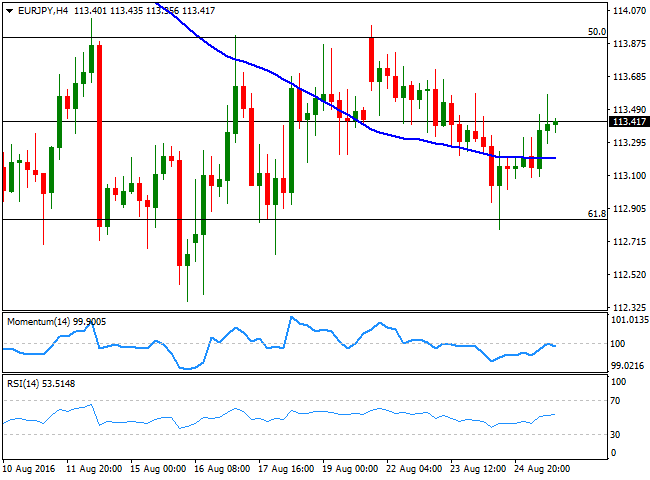
The EUR/JPY pair recovered some ground as the Japanese yen eased modestly against its major rivals, while the common currency saw some intraday demand. Nevertheless, the pair remains confined to the same range in where it has been trading for the last three weeks, as both currencies are totally dollar-dependent these days. The neutral stance persists in the short term, as in the 1 hour chart, the price is hovering around a horizontal 100 SMA, while the Momentum indicator heads is also flat, but within positive territory, as the RSI indicator heads north around 58, keeping the downside limited. In the 4 hours chart, the price is a few pips above a horizontal 100 SMA, whilst the technical indicators hold flat around their mid-lines, lacking directional strength.
Support levels: 112.80 112.40 112.00
Resistance levels: 113.75 114.05 114.45
GBP/USD Current price: 1.3180
View Live Chart for the GBP/USD
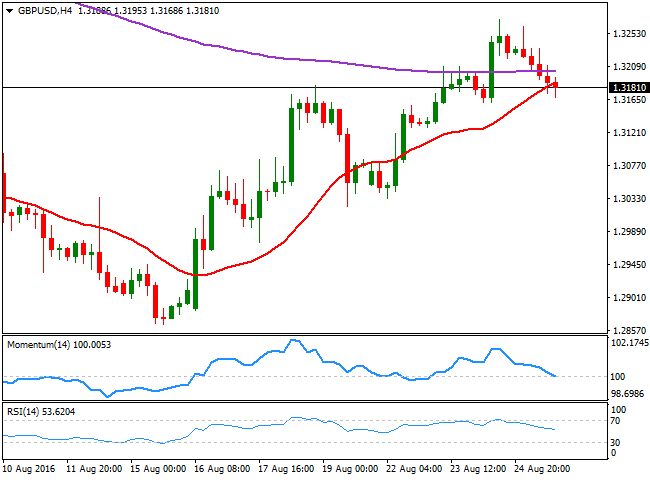
The GBP/USD pair closed lower for the first time this week, retreating modestly below the 1.3200 figure, in spite of positive data coming from the UK. According to the CBI distributive trades survey for August, the volume of retain trading rose in the month to 9 from -14 in July, while total volume rose to 17 from -11 in July. The report is hardly a market mover, but is another sign of how a cheaper Pound is helping local economic growth, at least for now. This Friday, the UK will release the only piece of relevant data for the week, its Q2 preliminary GDP readings, which may disappoint, as economic activity shrank in the three months to June and ahead of the Brexit referendum vote. The short term picture has turned bearish, given that in the 1 hour chart, the price is now well below a bearish 20 SMA, currently around 1.3210, while the technical indicators have resumed their declines within negative territory. In the 4 hours chart, the price is back below its 200 EMA and a few pips below a bullish 20 SMA, while indicators head lower around their mid-lines, suggesting the decline may extend further, particularly on a break below 1.3160, Wednesday's low.
Support levels: 1.3160 1.3125 1.3080
Resistance levels: 1.3210 1.3235 1.3270
USD/JPY Current price: 100.53
View Live Chart for the USD/JPY
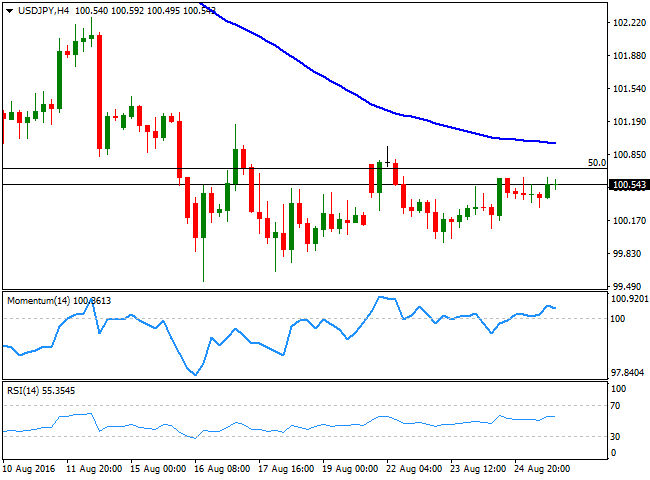
The USD/JPY pair closed the day barely above its opening level, still trading within a tight range daily basis, as investors remained side-lined ahead of the Jackson Hole Symposium, and any clue they may get from Yellen over a possible rate hike this year. Japan will release its latest inflation figures during the upcoming Asian session, generally expected to remain within negative territory, which can trigger some speculation over the possibility of more stimulus coming from the BOJ, although the pair is hardly expected to rally on that. The most likely scenario is that the market will wait for Yellen and jump into the pair after that. In the 1 hour chart, the price is above its 100 and 200 SMAs, both around 100.35, while the technical indicators have lost upward strength and turned lower, holding above their mid-lines. In the 4 hours chart, the price is below its 100 SMA, but more relevant, below 100.65, a major Fibonacci resistance as the level stands for the 50% retracement of the 2011/2015 rally. In this last time frame, indicators have lost upward strength after gaining some positive ground, overall maintaining the neutral stance seen earlier this week.
Support levels: 100.25 99.90 99.55
Resistance levels: 100.65 100.95 101.30
AUD/USD Current price: 0.7611
View Live Chart for the AUD/USD
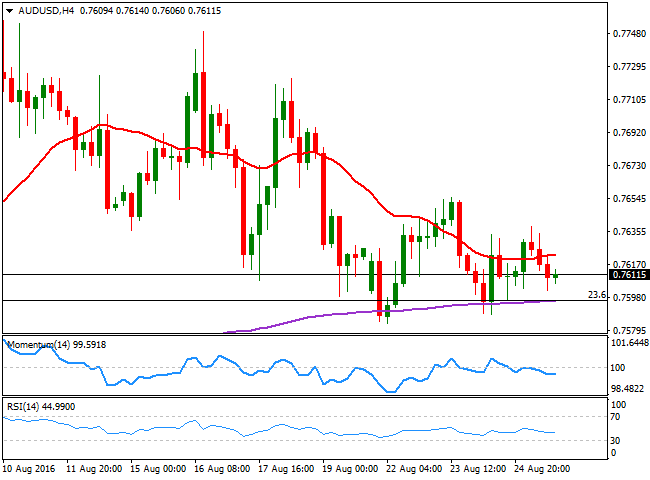
The Australian dollar advanced at the beginning of the day, extending up to 0.7638 against its American rival, helped by a modest advance in commodities. Nevertheless, the pair was unable to hold on to gains, and fell down to 0.7601, as gold prices fell to fresh 4-week lows during the US afternoon. There were no relevant news released in Australia, and the calendar will also remain empty this Friday, which means the pair will trade accordingly to dollar's self strength/weakness. From a technical point of view, the pair remains at risk of breaking lower, as it has been unable to recover from the lower range of the 0.76 region. In the 1 hour chart, the price is below a horizontal 20 SMA, while the technical indicators hold flat within negative territory, reflecting the absence of directional strength seen over these last few days. In the 4 hours chart, the 200 EMA converges with the 23.6% retracement of this year early rally at 0.7600, a strong static support, while the technical indicators head modestly lower within negative territory. A bearish acceleration through the mentioned support, can open doors for a steeper decline, down to 0.7450 during the upcoming days.
Support levels: 0.7600 0.7570 0.7535
Resistance levels: 0.7640 0.7690 0.7735
Information on these pages contains forward-looking statements that involve risks and uncertainties. Markets and instruments profiled on this page are for informational purposes only and should not in any way come across as a recommendation to buy or sell in these assets. You should do your own thorough research before making any investment decisions. FXStreet does not in any way guarantee that this information is free from mistakes, errors, or material misstatements. It also does not guarantee that this information is of a timely nature. Investing in Open Markets involves a great deal of risk, including the loss of all or a portion of your investment, as well as emotional distress. All risks, losses and costs associated with investing, including total loss of principal, are your responsibility. The views and opinions expressed in this article are those of the authors and do not necessarily reflect the official policy or position of FXStreet nor its advertisers. The author will not be held responsible for information that is found at the end of links posted on this page.
If not otherwise explicitly mentioned in the body of the article, at the time of writing, the author has no position in any stock mentioned in this article and no business relationship with any company mentioned. The author has not received compensation for writing this article, other than from FXStreet.
FXStreet and the author do not provide personalized recommendations. The author makes no representations as to the accuracy, completeness, or suitability of this information. FXStreet and the author will not be liable for any errors, omissions or any losses, injuries or damages arising from this information and its display or use. Errors and omissions excepted.
The author and FXStreet are not registered investment advisors and nothing in this article is intended to be investment advice.
Recommended Content
Editors’ Picks
AUD/USD failed just ahead of the 200-day SMA

Finally, AUD/USD managed to break above the 0.6500 barrier on Wednesday, extending the weekly recovery, although its advance faltered just ahead of the 0.6530 region, where the key 200-day SMA sits.
EUR/USD met some decent resistance above 1.0700

EUR/USD remained unable to gather extra upside traction and surpass the 1.0700 hurdle in a convincing fashion on Wednesday, instead giving away part of the weekly gains against the backdrop of a decent bounce in the Dollar.
Gold keeps consolidating ahead of US first-tier figures

Gold finds it difficult to stage a rebound midweek following Monday's sharp decline but manages to hold above $2,300. The benchmark 10-year US Treasury bond yield stays in the green above 4.6% after US data, not allowing the pair to turn north.
Bitcoin price could be primed for correction as bearish activity grows near $66K area

Bitcoin (BTC) price managed to maintain a northbound trajectory after the April 20 halving, despite bold assertions by analysts that the event would be a “sell the news” situation. However, after four days of strength, the tables could be turning as a dark cloud now hovers above BTC price.
Bank of Japan's predicament: The BOJ is trapped

In this special edition of TradeGATEHub Live Trading, we're joined by guest speaker Tavi @TaviCosta, who shares his insights on the Bank of Japan's current predicament, stating, 'The BOJ is Trapped.'