EUR/USD
4 hour
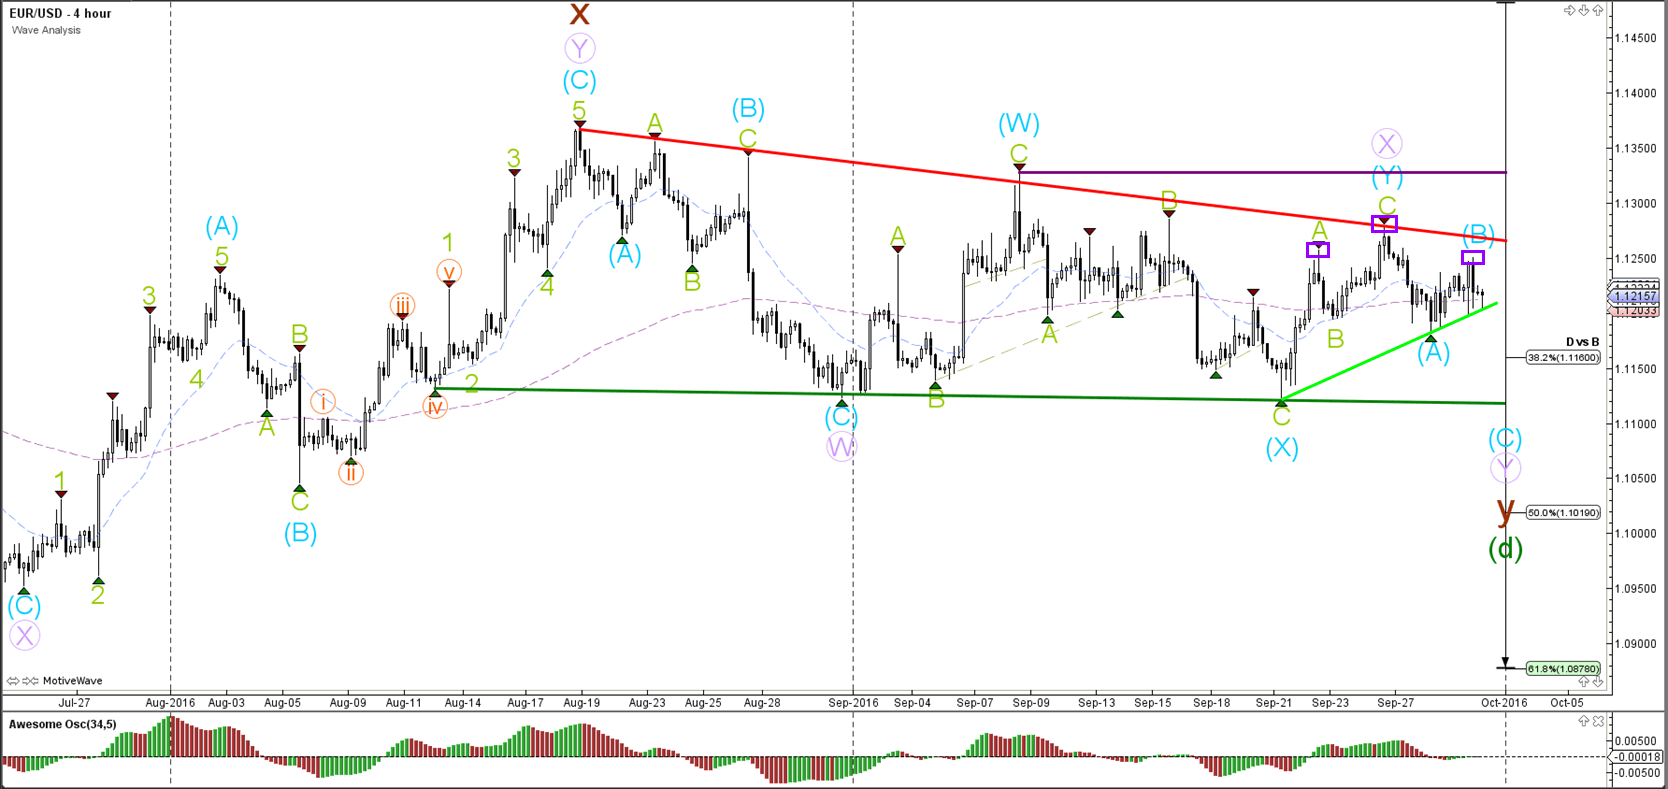
The EUR/USD continued with its bullish retracement yesterday but the resistance at 1.1250 has so far stopped price from moving higher. As expected in yesterday’s analysis, the head and shoulders pattern (purple boxes) is a reversal pattern that could indicate a bearish bounce if price manages to break the neck line (light green) of that pattern. Such a rejection could occur when a bearish ABC (blue) zigzag occurs that could bring price back towards the bottom of the larger consolidation zone (purple/green lines).
1 hour
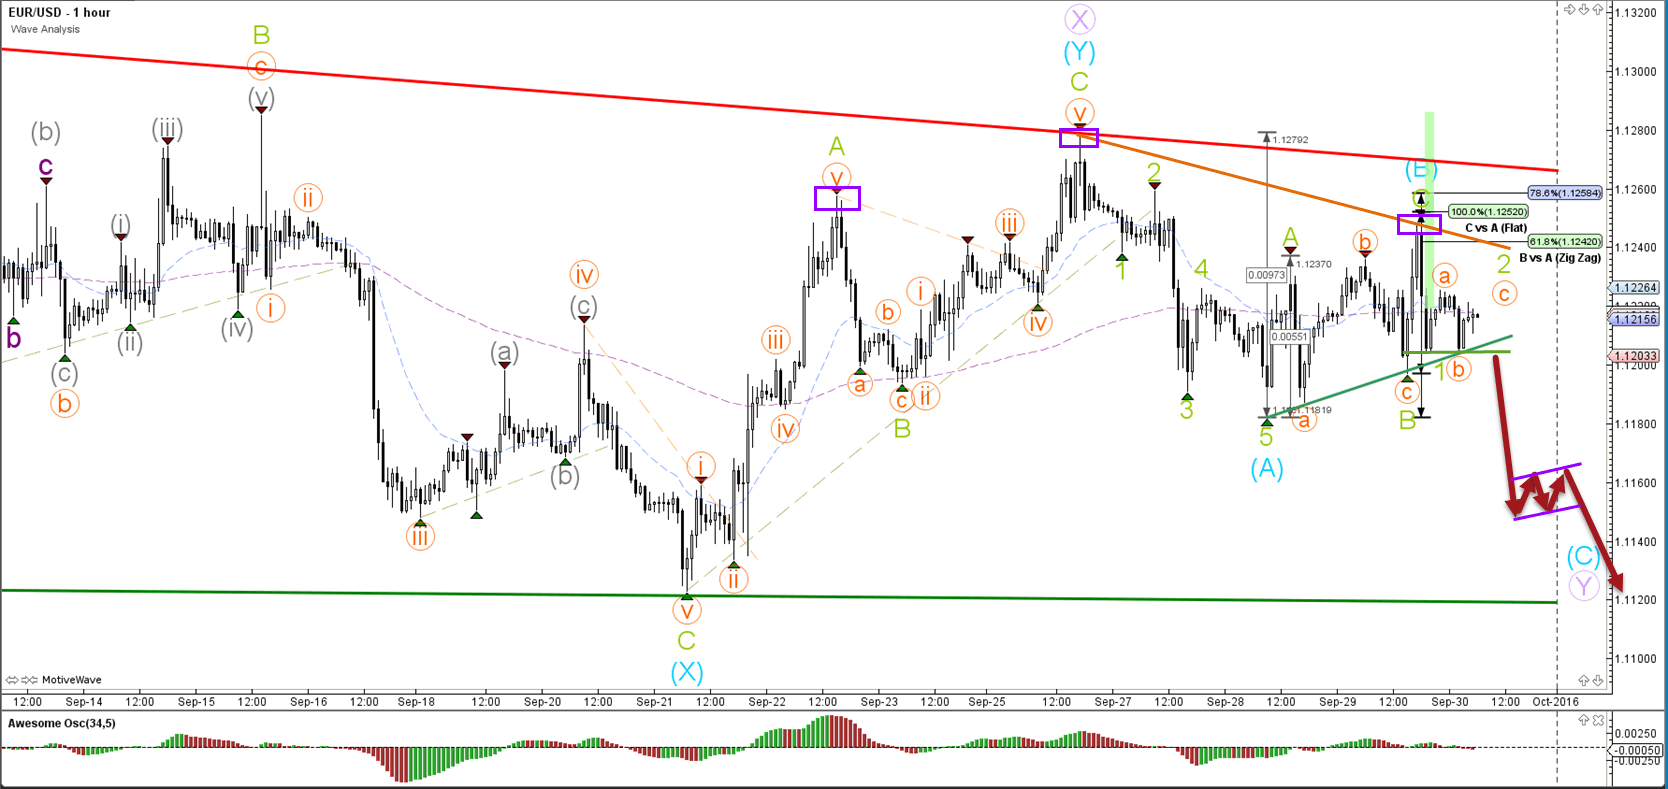
The EUR/USD seems to have completed a bullish ABC zigzag (green) within wave B (blue). A move higher would still resistance at trend lines (orange/red) and Fib levels but a break above that zone would invalidate the current ABC (blue). A break below support (light green) could see the potential start of bearish momentum (dark red arrows).
GBP/USD
4 hour
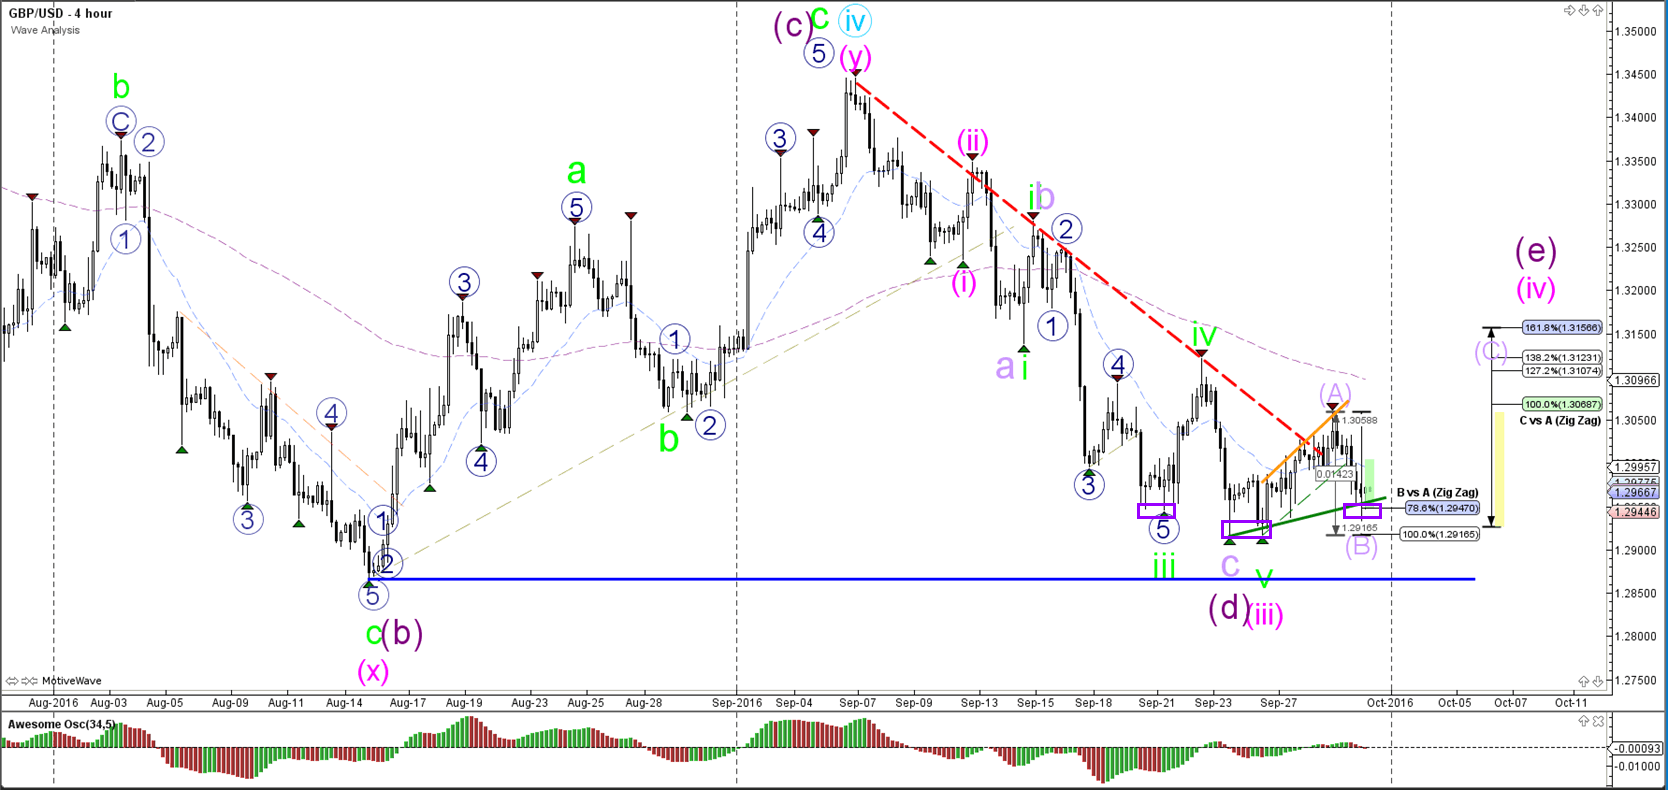
The GBP/USD bearish price action seems to move correctively, which makes a larger ABC (light purple) the most likely wave structure at the moment. Price has retested the previous bottom and is stopping at the 78.6% Fibonacci retracement of wave B (light purple), which is the level of a potential inverted head and shoulders (purples boxes) reversal pattern. Price could either be in a wave E (purple) or wave 4 (pink), which depends on whether price moves above the 100% Fibonacci level (wave E) or stays below it (wave 4).
1 hour
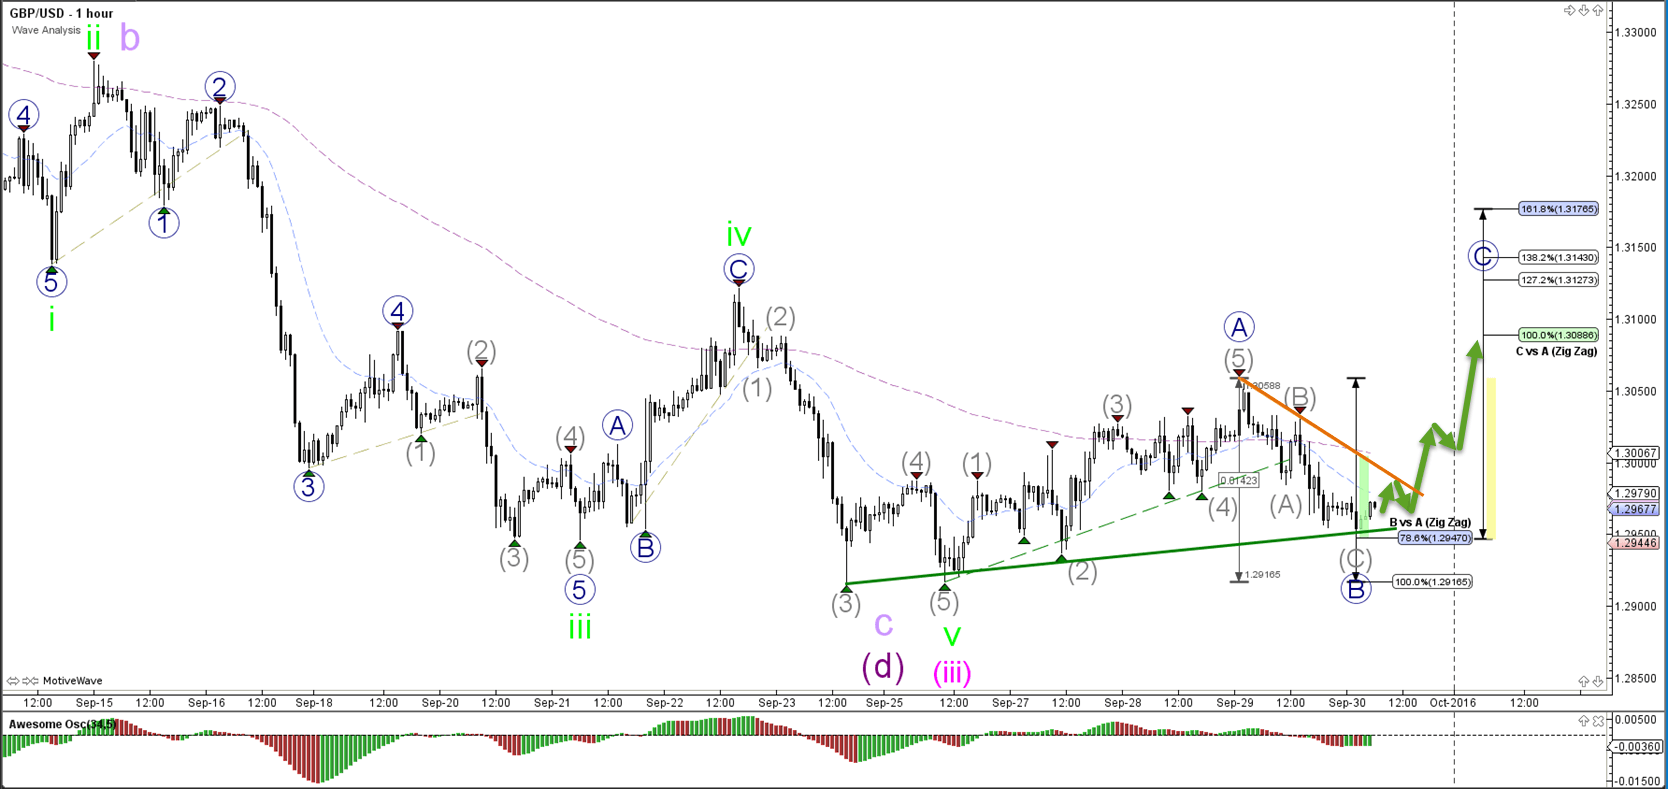
The GBP/USD break above resistance (orange) could see a bullish move higher but a break below the 100% Fibonacci invalidates the wave B (blue).
USD/JPY
4 hour
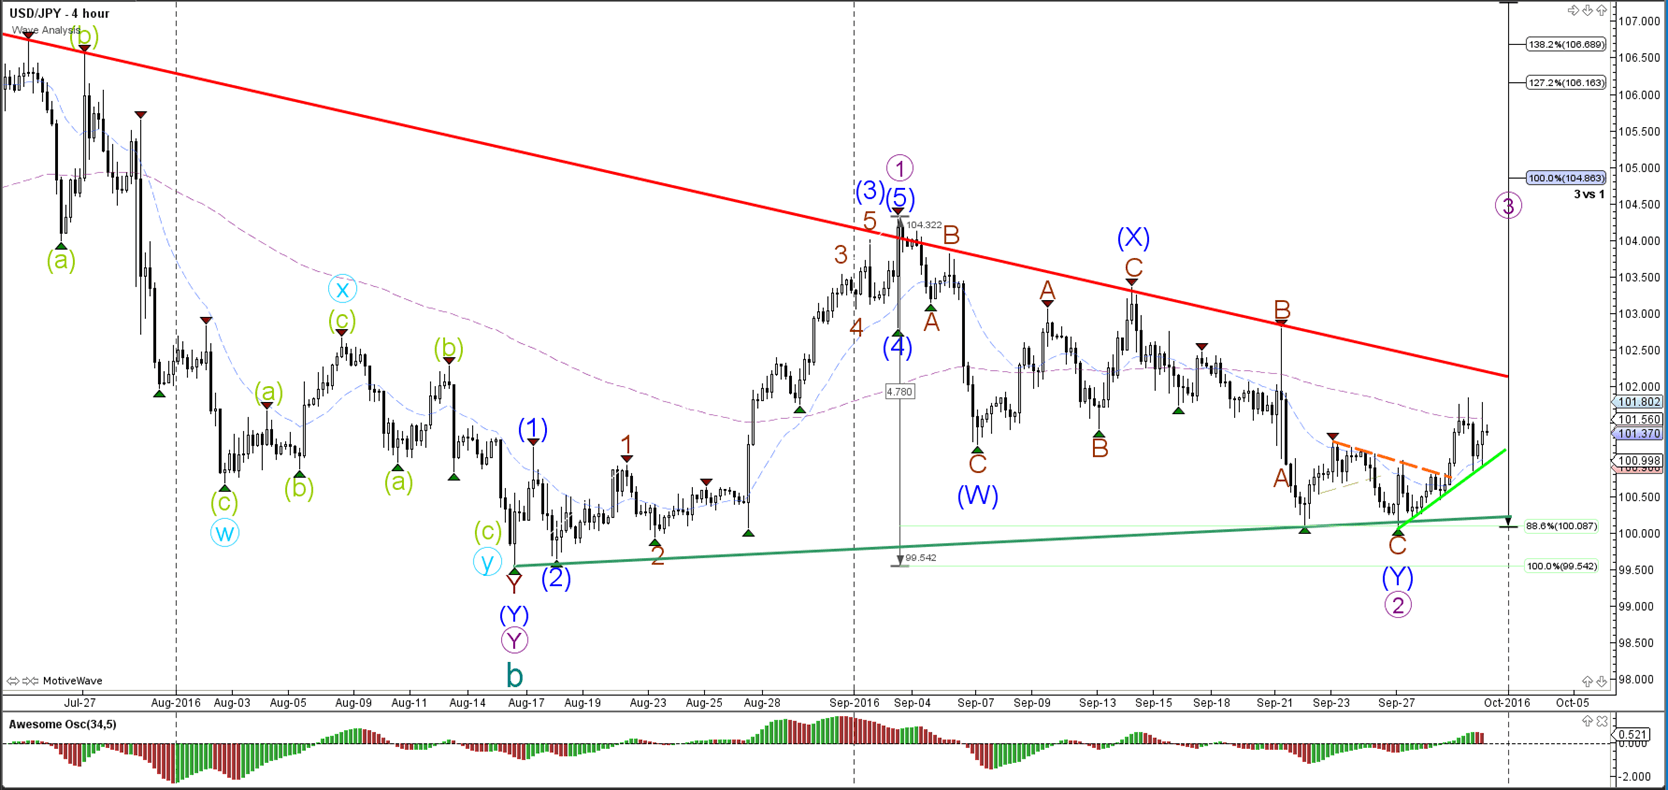
The USD/JPY remains stuck between the resistance of the daily downtrend channel (red) and the support of the various bottoms (green) and 88.6% Fibonacci level of wave 2 (purple). A break below the bottoms invalidates the bullish reversal, whereas a break above the bearish channel confirms the potential for a wave 3 (purple).
1 hour
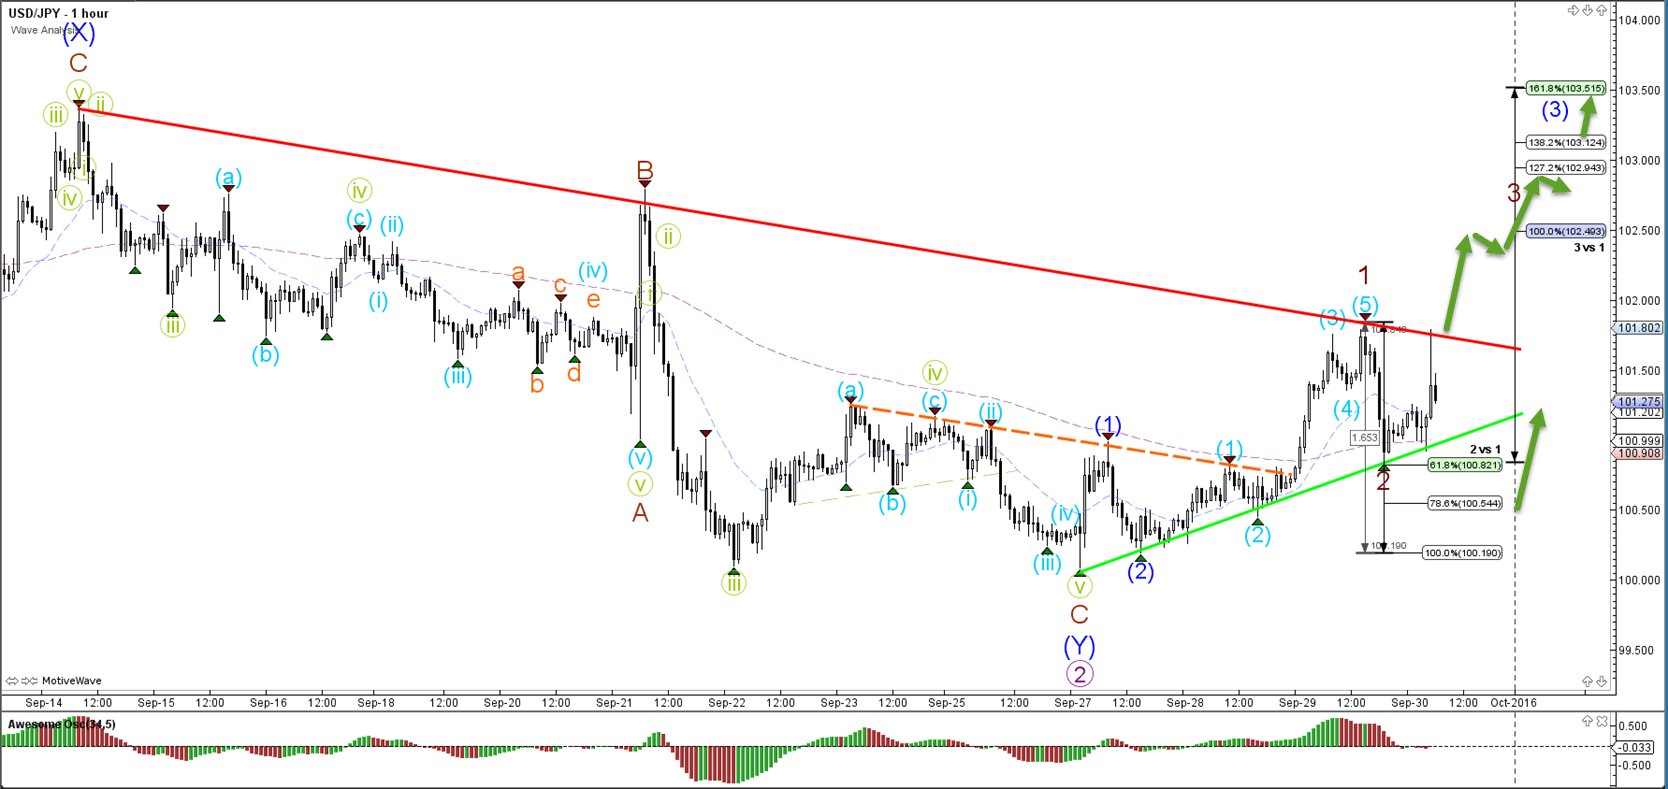
The USD/JPY potential break above the resistance (red) trend line could spark the start of a wave 3 (brown/blue) bullish momentum. A push lower could still see price bounce at the 78.6% Fibonacci retracement level but a break below the 100% Fib invalidates the wave 1-2 (brown).
Elite CurrenSea Training Program(s) should not be treated as a recommendation or a suggestion to buy or sell any security or the suitability of any investment strategy for Student. The purchase, sale, or advice regarding any security, other financial instrument or system can only be performed by a licensed Industry representative; such as, but not limited to a Broker/Dealer, Introducing Broker, FCM and/or Registered Investment Advisor. Neither Elite CurrenSea nor its representatives are licensed to make such advisements. Electronic active trading (trading) may put your capital at risk, hence all trading decisions are made at your own risk. Furthermore, trading may also involve a high volume & frequency of trading activity. Each trade generates a commission and the total daily commission on such a high volume of trading can be considerable. Trading accounts should be considered speculative in nature with the objective being to generate short-term profits. This activity may result in the loss of more than 100% of an investment, which is the sole responsibility of the client. Any trader should realise the operation of a margin account under various market conditions and review his or her investment objectives, financial resources and risk tolerances to determine whether margin trading is appropriate for them. The increased leverage which margin provides may heighten risk substantially, including the risk of loss in excess of 100% of an investment.
Recommended Content
Editors’ Picks
AUD/USD posts gain, yet dive below 0.6500 amid Aussie CPI, ahead of US GDP

The Aussie Dollar finished Wednesday’s session with decent gains of 0.15% against the US Dollar, yet it retreated from weekly highs of 0.6529, which it hit after a hotter-than-expected inflation report. As the Asian session begins, the AUD/USD trades around 0.6495.
USD/JPY finds its highest bids since 1990, approaches 156.00

USD/JPY broke into its highest chart territory since June of 1990 on Wednesday, peaking near 155.40 for the first time in 34 years as the Japanese Yen continues to tumble across the broad FX market.
Gold stays firm amid higher US yields as traders await US GDP data

Gold recovers from recent losses, buoyed by market interest despite a stronger US Dollar and higher US Treasury yields. De-escalation of Middle East tensions contributed to increased market stability, denting the appetite for Gold buying.
Ethereum suffers slight pullback, Hong Kong spot ETH ETFs to begin trading on April 30

Ethereum suffered a brief decline on Wednesday afternoon despite increased accumulation from whales. This follows Ethereum restaking protocol Renzo restaked ETH crashing from its 1:1 peg with ETH and increased activities surrounding spot Ethereum ETFs.
Dow Jones Industrial Average hesitates on Wednesday as markets wait for key US data

The DJIA stumbled on Wednesday, falling from recent highs near 38,550.00 as investors ease off of Tuesday’s risk appetite. The index recovered as US data continues to vex financial markets that remain overwhelmingly focused on rate cuts from the US Fed.