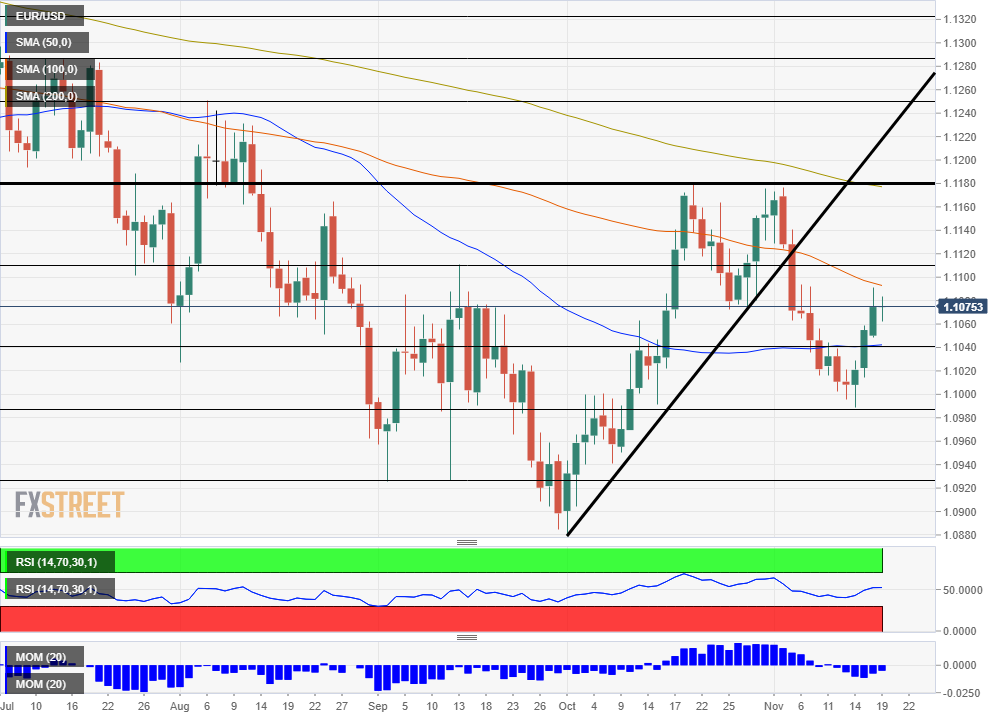
- EUR/USD's recovery attempt has been thwarted at the 1.1180 double-top.
- The world's most popular currency pair has failed to recover from losing uptrend support.
- Moving averages on the daily chart are pointing to further falls.
Are the US and China close to signing a deal? Will the Federal Reserve cut interest rates once again? What will Christine Lagarde, the new President of the European Central Bank, do for the old continent? These fundamental questions and others have been moving euro/dollar – and perhaps too much.
The high level of noise in the world's No. 1 currency pair makes it "hard to see the forest from the trees." The broader picture is that the US economy is outperforming the 19-country euro area one. And the following question – more substantial question for traders – is: what is priced in?
EUR/USD may be enjoying an uptrend in the past few days, but this may be a rise before the fall.
There were reasons to believe that euro/dollar's prices already reflect this economic divergence. However, looking at the greater scheme of things – the daily EUR/USD chart – shows that the common currency has more room to fall.
Here are three technical reasons that support the bearish outlook:
1) Decisive double-top
EUR/USD has been enjoying a recovery from the lows of 1.0879 to 1.1180 – no fewer than 301 pips within three weeks in October. However, that level proved insurmountable. The second attempt to break higher in early November already created a double-top.
Contrary to previous cases where euro/dollar made false was rejected at resistance only to surge afterward – this barrier proved robust. EUR/USD has been drifting away from that level.
2) Uptrend support is lost
The second fallback at 1.1180 has also resulted in piercing through the uptrend support line. That convincing cushion was lost in a determined manner. Since losing it, EUR/USD has failed to get closer to the line – nor the 1.1115 level where it lost that level.
Rising alongside that uptrend was accompanied by upside momentum, which has also disappeared and turned negative.
3) SMAs paint a gloomy picture
While EUR/USD has managed to bounce above the 50-day Simple Moving Average, it is currently capped by the 100-day SMA at 1.1100. More importantly, the 200-day SMA continues clouding the outlook for euro/dollar bulls and ominously converges with the 1.1180 level mentioned earlier.
How low can it go?
Euro/dollar is not only the world's most popular currency pair but perhaps also the most stubborn one. While any upside is limited, the downside grind may be slow as well. Support awaits at the 50 SMA, which hits the price the 1.1040. It is followed by 1.0990, the November's low, by the double-bottom at 1.0925, and finally by the 2019-low of 1.0879.
Information on these pages contains forward-looking statements that involve risks and uncertainties. Markets and instruments profiled on this page are for informational purposes only and should not in any way come across as a recommendation to buy or sell in these assets. You should do your own thorough research before making any investment decisions. FXStreet does not in any way guarantee that this information is free from mistakes, errors, or material misstatements. It also does not guarantee that this information is of a timely nature. Investing in Open Markets involves a great deal of risk, including the loss of all or a portion of your investment, as well as emotional distress. All risks, losses and costs associated with investing, including total loss of principal, are your responsibility. The views and opinions expressed in this article are those of the authors and do not necessarily reflect the official policy or position of FXStreet nor its advertisers. The author will not be held responsible for information that is found at the end of links posted on this page.
If not otherwise explicitly mentioned in the body of the article, at the time of writing, the author has no position in any stock mentioned in this article and no business relationship with any company mentioned. The author has not received compensation for writing this article, other than from FXStreet.
FXStreet and the author do not provide personalized recommendations. The author makes no representations as to the accuracy, completeness, or suitability of this information. FXStreet and the author will not be liable for any errors, omissions or any losses, injuries or damages arising from this information and its display or use. Errors and omissions excepted.
The author and FXStreet are not registered investment advisors and nothing in this article is intended to be investment advice.
Recommended Content
Editors’ Picks
EUR/USD retreats below 1.0700 after US GDP data

EUR/USD came under modest bearish pressure and retreated below 1.0700. Although the US data showed that the economy grew at a softer pace than expected in Q1, strong inflation-related details provided a boost to the USD.
GBP/USD declines below 1.2500 as USD rebounds

GBP/USD declined below 1.2500 and erased the majority of its daily gains with the immediate reaction to the US GDP report. The US economy expanded at a softer pace than expected in Q1 but the price deflator jumped to 3.4% from 1.8%.
Gold drops below $2,320 as US yields shoot higher

Gold lost its traction and turned negative on the day below $2,320 in the American session on Thursday. The benchmark 10-year US Treasury bond yield is up more than 1% on the day above 4.7% after US GDP report, weighing on XAU/USD.
XRP extends its decline, crypto experts comment on Ripple stablecoin and benefits for XRP Ledger

Ripple extends decline to $0.52 on Thursday, wipes out weekly gains. Crypto expert asks Ripple CTO how the stablecoin will benefit the XRP Ledger and native token XRP.
After the US close, it’s the Tokyo CPI

After the US close, it’s the Tokyo CPI, a reliable indicator of the national number and then the BoJ policy announcement. Tokyo CPI ex food and energy in Japan was a rise to 2.90% in March from 2.50%.