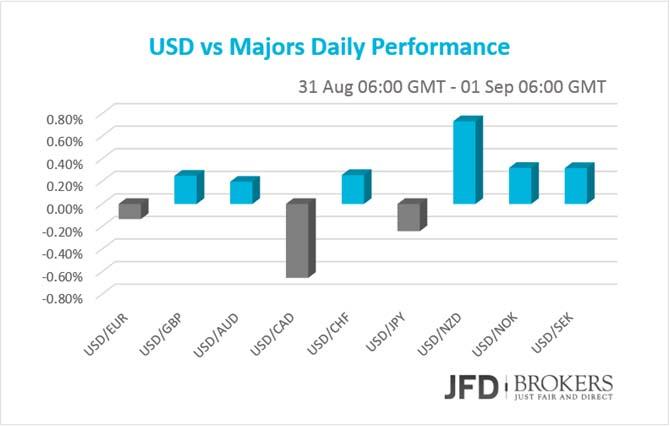
The greenback was being traded mixed marginally unchanged versus most of the G10 currencies on Monday and early Tuesday. The US dollar recorded significant gains only against the New Zealand dollar on weak ANZ Business Confidence and considerable losses against the Canadian dollar on the back of improved Canadian Current Account for the second quarter.
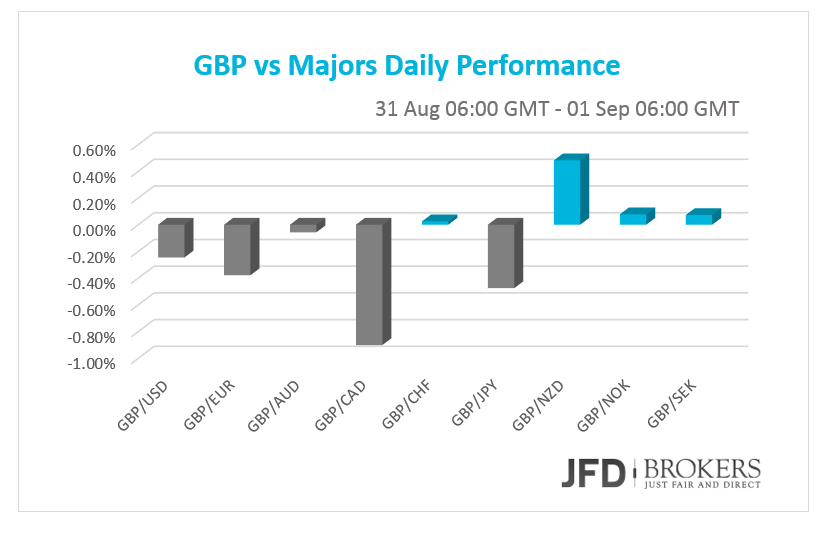
Reserve Bank of Australia policy meeting failed to have a significant impact on the currency, after the announcement that interest rates remained unchanged. Euro rose on better than expected Inflation Rate in Eurozone while British Pound was mainly driven from other currencies as all was quiet on the domestic front due to Bank Holiday in UK. Japanese Yen is traded higher vs the US dollar. The precious metal gained momentum while oil surged nearly 9%. US Indices post their worst month in August from the years.
Euro Rose vs G10 on Upbeat Data
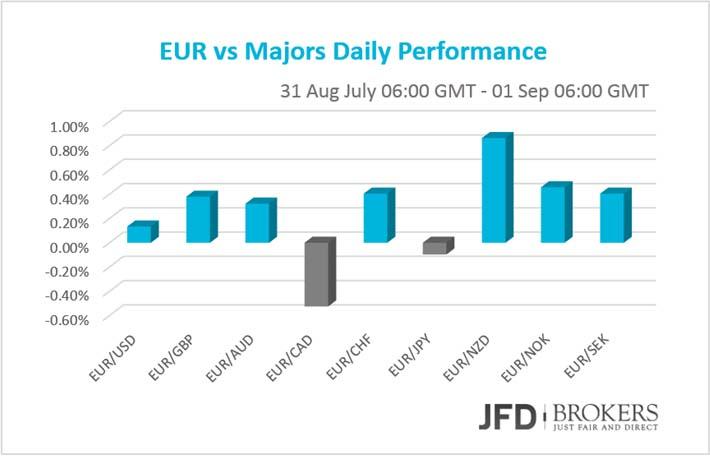
The shared currency rose against most of the G10 currencies after the better than expected Inflation Rate estimate from Eurozone for August. The consuming prices in Eurozone are estimated to have risen by 0.2% in August, compared to the same month a year before, while the market has forecasted just 0.1%. Moreover, the German Retail Sales accelerated by 1.4%, on a monthly basis, the steepest pace of the last nine months.
EUR/USD testing the 23.6% Fibonacci level
The euro posted monthly gains against the dollar on Monday erasing its July’s monthly losses as it benefited from a global stock-market panic and concerns that the Fed might not raise interest rates this year. The EUR/USD surged 2.10% in August, its largest monthly gains since April +4.6%, to trade above the key support level of 1.1215.
As it is, I think we need to see further confirmation before determining that the bias in the market has changed from bearish to bullish, especially for the short-term. Going forward, there is a clear battle going on between 1.1200 – 1.1280 but it’s not clear at this stage who has the upper hand, the bulls or the bears.
The 50-SMA on the 4-hour chart and the 23.6% Fibonacci level are continuing to provide resistance above, while the 1.1160 level is providing support below, for now. If we see a break lower, further support should be found around 1.1080, where the 200-SMA intersects the descending trend line. A break higher, on the other hand, would suggest the bias is still bullish in the market, prompting a move back towards the key level of 1.1330.
GBP/USD uptrend expected to return at 1.5460
The GBP/USD has fallen for the second month in a row and retreated from a 10-month high reached earlier the previous month. The pair fell more than 400 pips since it reached the psychological level of 1.5800, having broken through a number of key support levels over the last few days, including the 1.5500 barrier as well as the 50-SMA on the daily and weekly chart.
Looking at the daily chart, the price is receiving support from the 200-SMA slightly above the 1.5330 level. The pair is pushing back towards the 1.5400 level, which has been a strong support level throughout the past month. Typically a 4-hour close above the 1.5450 – 1.5465 or below 1.5330 should set the direction of trade. A break above the aforementioned zone might drive the battle towards the 1.5525 level while a close below the 1.5330 should push the rate towards the 1.5300 level and then to 1.5250. A violation of the above hurdles would find the rate lying in territories not seen since May 2015.
RBA leaves cash rate on hold; AUD/USD unchanged
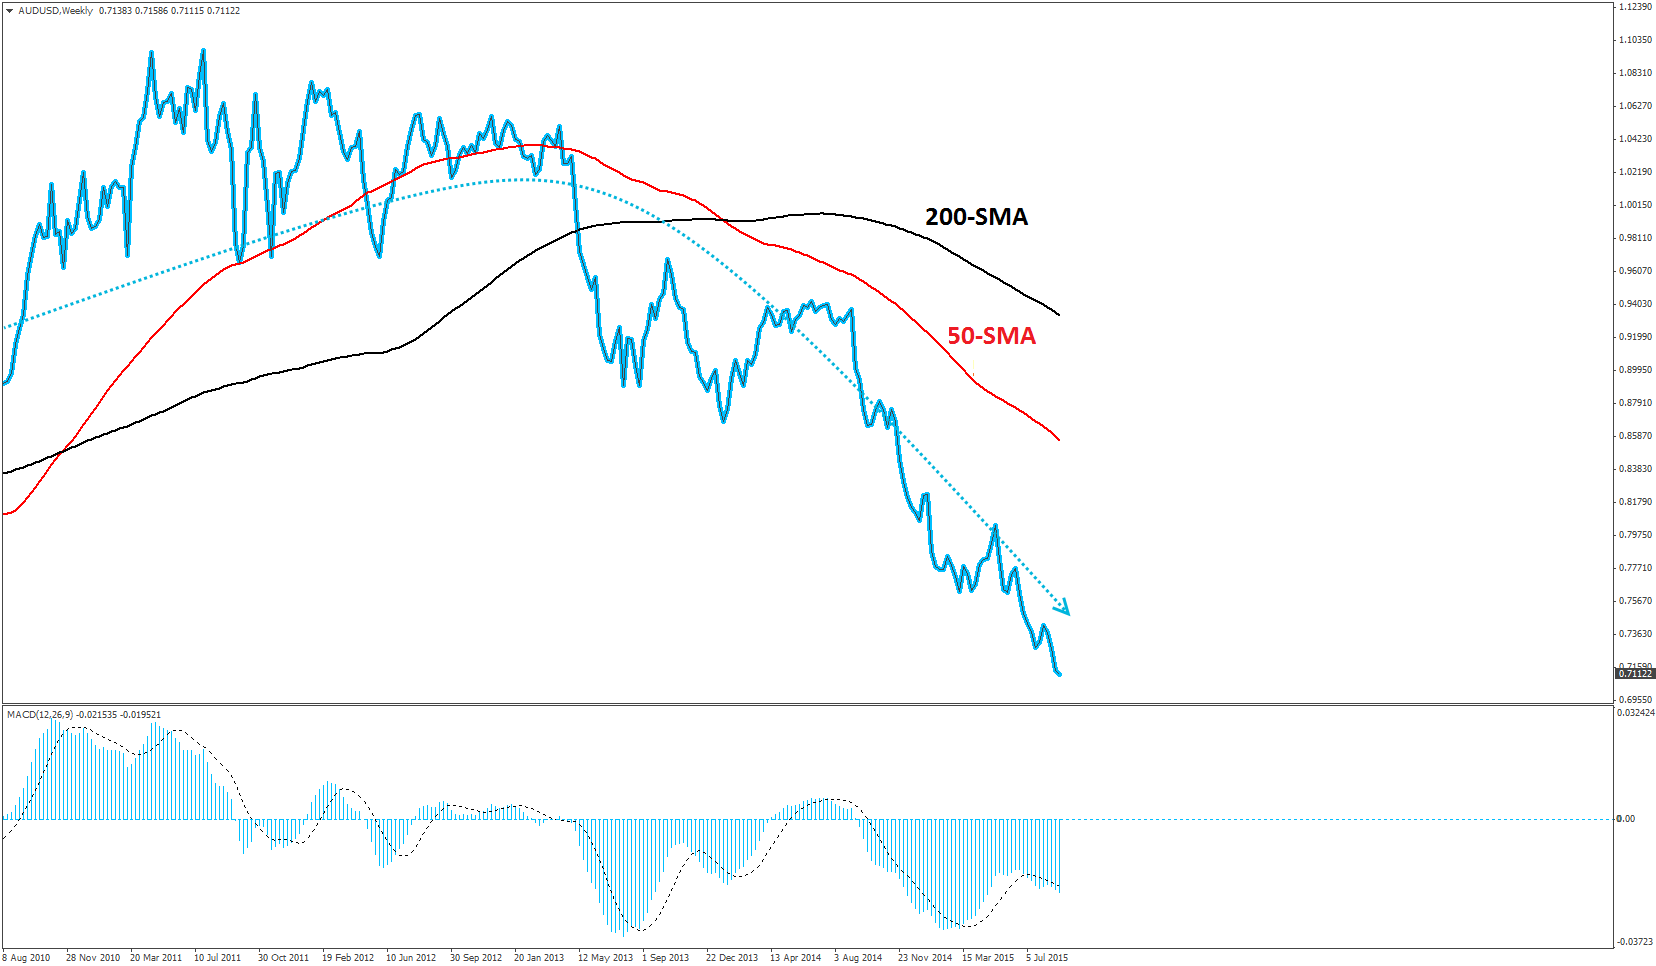
The Australian dollar remained unchanged, roughly around 0.7120, against the US dollar after the Reserve Bank of Australia on Tuesday left the cash rate at its record low 2 percent for the fourth month in a row. The Australian dollar finished 2014 lower -8.30% against the US dollar while is trading -13.30% for this year. It also delivered a negative August -2.60% following a negative July -5.24%. Furthermore, the AUD/USD has seen three consecutive negative weeks, bringing us below the key level of 0.7200.
The AUD/USD has been in a strong downward trend for several years now. The pair crossed below both the 100-SMA and the 200-SMA on the weekly chart in the middle of 2013 and turned even more bearish at the beginning of 2014 when the 50-SMA crossed below the 200-SMA.
The pair also remains below the short-term trend line while the 50-SMA lies below the 200-SMA, confirming that the downtrend is still in effect. The pair is trading slightly below the key level of 0.7200 in early trading. On the upside, the pair needs to clear resistance at 0.7210, before testing its weekly high at 0.7250. This is a significant level since it coincides with the short-term descending trend line, as well as the 50-SMA on the daily chart.
For the moment, the picture looks a shade more bearish than bullish, with 4-hour MACD still moving in a negative territory. Therefore, I would expect the selling pressure to continue in the near-term and the bears to reach the psychological level of 0.6900 in the next few days.
USD/JPY flat around 120.50
The Japanese Yen is currently trading slightly higher against the US Dollar. There was a slew of overnight economic releases from Japan yesterday. Housing Starts fell more-than-expected in the last quarter with Construction orders to plunge -4.0% in July. Housing Starts fell to a seasonally adjusted 7.4%, from 16.3% in the preceding quarter.
The USD/JPY moved slightly lower after testing the 121.60 level, slightly below the 200-SMA on the daily chart. The pair had a sideways Monday session within a fairly narrow range. I would be fairly neutral though on any directional move and we could yet see the dollar come under further pressure, with much depending on the lead coming from China.
Gold price gains momentum
The precious metal continues to move higher, following the sell-off seen earlier in the week. The latest consolidation above the $1,112 has respected the 4-hour 200-SMA closely as support, which makes it a strong obstacle to the downside. XAU/USD was up 0.21% at $1,136.60 during yesterday’s session after an uneventful session on Friday when the gold closed the day negative -0.10%.
Going forward, following the strong rebound from $1,117 I have not seen the signs of a reversal lower yet and, therefore, the bullish outlook remains intact. In the short-term another leg higher seems likely towards $1,146 and then to $1,150.
Oil surged nearly 9%; What is next?
Oil prices surged nearly 9% on Monday, with investors covering short positions and taking profits after UK Brent and US WTI jumped more than 8% in the previous session. Oil prices are continuing to rise and in early-Tuesday after the market posted its biggest one-day surge for close to six years.
The Brent is trading above the key support zone – previous resistance – of $49.50 - $50.00 and it seems that the bulls are back into the game! Therefore I would expect further increase towards the key resistance level of $57.90. This is a significant level as it includes the 200-SMA on the daily chart.
A similar picture prevails in WTI. The commodity is continuing to rally, having broken through a number of key resistance levels over the last few days. If the buying pressure continues and we see a clear break above the key resistance level of $50.00, then would strongly suggest there is been a strong change of bias in the markets.
U.S. Indices plunged despite Oil Strong Rebound
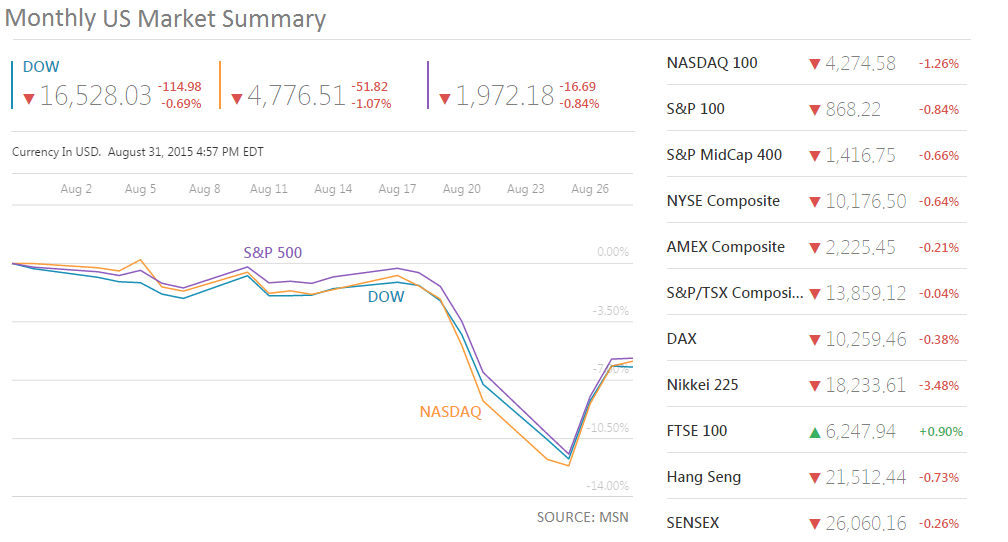
US Indices plunged for one more day despite oil strong rebound, with S&P 500 records its worst month since May 2012! The last day of August the index posted losses of 0.84%, 16.69 points down, closing the month 6.26% negative, a total of 133 points lower than the months opening level! Currently, the index is being traded below the psychological level of 2,000.
The Dow Jones Industrial Average also posted the highest negative performed month in the last seven years of 6.57% down. Monday’s drop of 0.69%, 115 points down added to the month’s negative performance. The Nasdaq Composite Index slipped 52 points, -1.07% of its value, closing the month 6.86% below its month opening level.
Economic Indicators
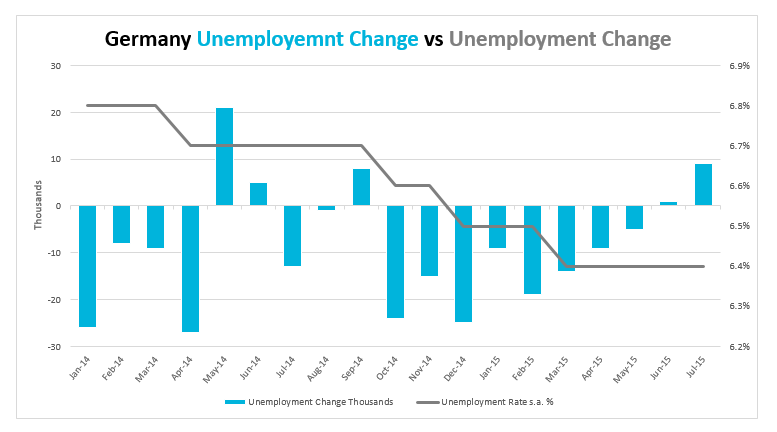
The Economic Calendar is looking pretty busy today, with Markit PMIs for various countries, unemployment rates and Gross Domestic Products announcements. Early in the morning, August’s final Markit Manufacturing PMI for Eurozone as a whole, Germany, UK, France, Italy, Greece and Spain will be out. Meanwhile, Germany’s unemployment rate for August is forecasted to have remained unchanged while the unemployment change is expected to show that 3,000 unemployed people found a job in August. It notable that since last October, only the last two months had positive figures, which means increase in unemployment.
A while late, in UK, the Mortgage Approvals in July will be announced as well as the Net Lending to Individuals for the same month. At the same time, EUR traders will watch closely Eurozone’s Unemployment Rate, two days ahead of the ECB policy meeting. Going forward, in Canada, the final Gross Domestic Product for the second quarter will attract some attention, as well as the RBC Manufacturing Index for August. Later in the day, the focus will be turned in US. The Markit and ISM Manufacturing PMIs for August, the Construction Spending for July and the Economic Optimism for September will be released. Overnight, Australia will publish its GDP for Q2, which is forecasted to have risen on a weakest pace than the previous quarter.
The content we produce does not constitute investment advice or investment recommendation (should not be considered as such) and does not in any way constitute an invitation to acquire any financial instrument or product. JFD Group, its affiliates, agents, directors, officers or employees are not liable for any damages that may be caused by individual comments or statements by JFD Group analysts and assumes no liability with respect to the completeness and correctness of the content presented. The investor is solely responsible for the risk of his investment decisions. Accordingly, you should seek, if you consider appropriate, relevant independent professional advice on the investment considered. The analyses and comments presented do not include any consideration of your personal investment objectives, financial circumstances or needs. The content has not been prepared in accordance with the legal requirements for financial analyses and must therefore be viewed by the reader as marketing information. JFD Group prohibits the duplication or publication without explicit approval.
72,99% of the retail investor accounts lose money when trading CFDs with this provider. You should consider whether you can afford to take the high risk of losing your money. Please read the full Risk Disclosure: https://www.jfdbank.com/en/legal/risk-disclosure
Recommended Content
Editors’ Picks
EUR/USD clings to daily gains above 1.0650

EUR/USD gained traction and turned positive on the day above 1.0650. The improvement seen in risk mood following the earlier flight to safety weighs on the US Dollar ahead of the weekend and helps the pair push higher.
GBP/USD recovers toward 1.2450 after UK Retail Sales data

GBP/USD reversed its direction and advanced to the 1.2450 area after touching a fresh multi-month low below 1.2400 in the Asian session. The positive shift seen in risk mood on easing fears over a deepening Iran-Israel conflict supports the pair.
Gold holds steady at around $2,380 following earlier spike

Gold stabilized near $2,380 after spiking above $2,400 with the immediate reaction to reports of Israel striking Iran. Meanwhile, the pullback seen in the US Treasury bond yields helps XAU/USD hold its ground.
Bitcoin Weekly Forecast: BTC post-halving rally could be partially priced in Premium

Bitcoin price shows no signs of directional bias while it holds above $60,000. The fourth BTC halving is partially priced in, according to Deutsche Bank’s research.
Week ahead – US GDP and BoJ decision on top of next week’s agenda

US GDP, core PCE and PMIs the next tests for the Dollar. Investors await BoJ for guidance about next rate hike. EU and UK PMIs, as well as Australian CPIs also on tap.
