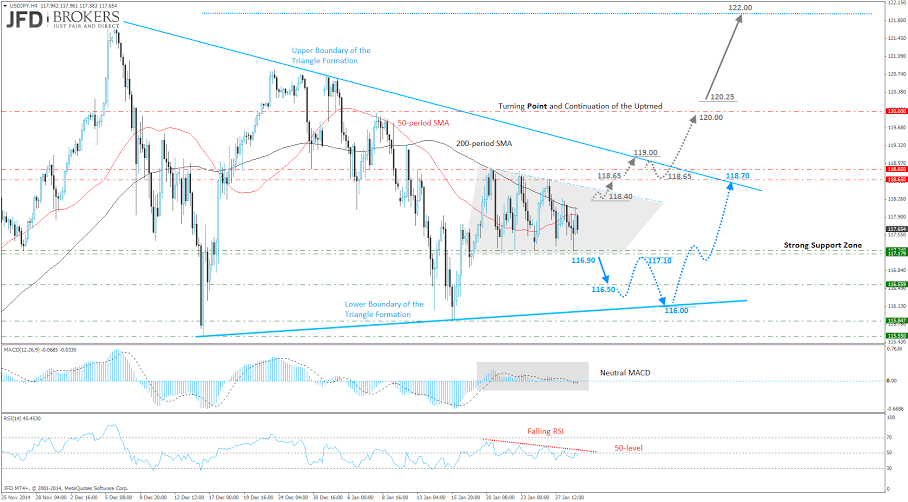
The USD/JPY pair has been trading in a symmetrical triangle formation since the beginning of December 2014, following the aggressive buy above the 110.00 in late October 2014. Furthermore, the pair remains stuck in a range the last couple of weeks or so, between the key support zone of 117.18 – 117.25 and the strong resistance level at 118.65.
Technically speaking, the 4-hour chart certainly suggests we could see some bearish movements over the next few days, while the daily chart highlights a general lack of direction at the moment. Remaining on the 4-hour chart, the dollar is still struggling to break above the short-term descending trend line, where the 200-period simple moving average and the 118.00 level, combined to provide significant resistance to the pair.
On the downside, the pair is finding strong support at the 117.25 level. A dip lower from here, would trigger some stops and could open the door for further pressure on the key support level at 116.50. From there, I would expect the bulls to give their fight and if they manage to win the battle, then they could push the price higher towards the 117.10 for a retest. However, I would expect the price to retest the lower boundary of the triangle formation before it exits the formation.
Moreover, we are approaching the apex of the triangle formation and a breakout is expected anytime soon. Ordinarily, this comes around two-thirds of the way into the triangle which would mean a breakout is already overdue and therefore we should watch this closely.
Otherwise, if we see a move higher, based on how these setups usually behave, I would be inclined to believe that the odds of a breakout to the upside would be increased, prompting a more aggressive move towards the upper boundary of the triangle formation and the 122.00 level.
Both the MACD and the Stochastic lie near their neutral levels confirming the validity of the formation, while the stochastic is moving near the 50 level, reaffirming the disagreement between investors.
The content we produce does not constitute investment advice or investment recommendation (should not be considered as such) and does not in any way constitute an invitation to acquire any financial instrument or product. JFD Group, its affiliates, agents, directors, officers or employees are not liable for any damages that may be caused by individual comments or statements by JFD Group analysts and assumes no liability with respect to the completeness and correctness of the content presented. The investor is solely responsible for the risk of his investment decisions. Accordingly, you should seek, if you consider appropriate, relevant independent professional advice on the investment considered. The analyses and comments presented do not include any consideration of your personal investment objectives, financial circumstances or needs. The content has not been prepared in accordance with the legal requirements for financial analyses and must therefore be viewed by the reader as marketing information. JFD Group prohibits the duplication or publication without explicit approval.
72,99% of the retail investor accounts lose money when trading CFDs with this provider. You should consider whether you can afford to take the high risk of losing your money. Please read the full Risk Disclosure: https://www.jfdbank.com/en/legal/risk-disclosure
Recommended Content
Editors’ Picks
AUD/USD hovers around 0.6500 amid light trading, ahead of US GDP

AUD/USD is trading close to 0.6500 in Asian trading on Thursday, lacking a clear directional impetus amid an Anzac Day holiday in Australia. Meanwhile, traders stay cautious due ti risk-aversion and ahead of the key US Q1 GDP release.
USD/JPY finds its highest bids since 1990, near 155.50

USD/JPY keeps breaking into its highest chart territory since June of 1990 early Thursday, testing 155.50 for the first time in 34 years as the Japanese Yen remains vulnerable, despite looming Japanese intervention risks. Focus shifts to Thursday's US GDP report and the BoJ decision on Friday.
Gold price treads water near $2,320, awaits US GDP data

Gold price recovers losses but keeps its range near $2,320 early Thursday. Renewed weakness in the US Dollar and the US Treasury yields allow Gold buyers to breathe a sigh of relief. Gold price stays vulnerable amid Middle East de-escalation, awaiting US Q1 GDP data.
Injective price weakness persists despite over 5.9 million INJ tokens burned

Injective price is trading with a bearish bias, stuck in the lower section of the market range. The bearish outlook abounds despite the network's deflationary efforts to pump the price. Coupled with broader market gloom, INJ token’s doomed days may not be over yet.
Meta Platforms Earnings: META sinks 10% on lower Q2 revenue guidance Premium

This must be "opposites" week. While Doppelganger Tesla rode horrible misses on Tuesday to a double-digit rally, Meta Platforms produced impressive beats above Wall Street consensus after the close on Wednesday, only to watch the share price collapse by nearly 10%.
