![]() Richard Perry
Richard Perry
Independent Analyst
Market Overview
After several days of significant weakness in which the US dollar broken through a series of key supports there seems to be something of a retracement underway, something that is impacting across forex markets. With the Dollar Index rallying sharply from its initial breach of key support at 92.6, the question needs to be asked whether this is a false downside break? This means that many of the dollar forex pairs are now showing key near term reversal indicators. This may still just prove to be a near term unwinding but it certainly appears that the appetite for selling the dollar has abated, at least for now. Equity markets continue to come under pressure as the data out of China has weighed on resources sectors and with oil off its recent highs this is also not helping either. Wall Street closed 0.9% lower, which filtered into a weak Asian session and European markets are set for mild early losses too.
In forex markets, the unwinding of dollar losses continues, with the Japanese yen the biggest underperformer, however as the European session has kicked in Sterling has found a touch of support. Interestingly though just a day after the RBA cut rates, the Aussie has bounced slightly and is the best performing major currency. With the dollar regaining ground, the precious metals are lower with gold and silver weaker. The oil price is consolidating after the correction of the past couple of days.
Traders will be looking out for the service sector PMIs which for the Eurozone come out at 0900BST (53.2 expected), whilst the ISM Non-Manufacturing PMI is at 1500BST which is expected to pick up slightly to 54.7 (from 54.5). There is also the ADP Employment change at 1315BST which is expected to improve slightly to 205,000 (from 200,000) whilst the US Trade Deficit is expected to improve slightly to -$45.6bn (from -$47.1bn), and US Factory Orders are forecast to grow by +0.7% for the month. The EIA oil inventories are at 1530BST and are expected to show another build of 2.5m barrels.
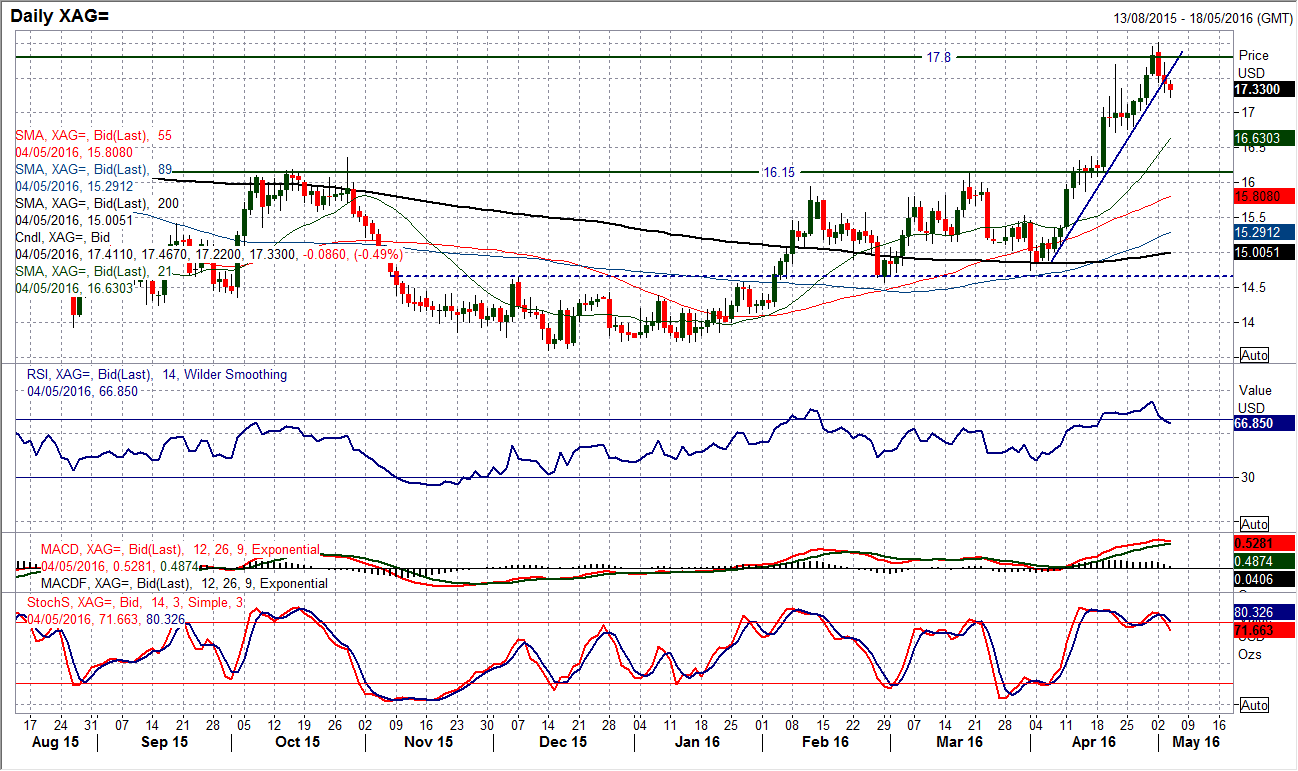
Chart of the Day – Silver
After a huge run higher silver is showing serious signs now of a correction. The run higher over the past four weeks has taken silver from just under $15 to a peak at $18.00 on Monday (around 22%). However the profit takers may now be ready to move in as the reversal from the peak has formed a bearish engulfing candle (or bearish key one day reversal bar) as the price closed below Friday’s low of $17.54 at $17.53 (only just but the sentiment is the same).Furthermore, the reversal was followed up yesterday by a further corrective candle that has broken what had been a four week uptrend. The RSI has unwound from 82 at its peak give a basic crossover sell signal, but the Stochastics are showing a bearish divergence with a bear crossover (yet to be confirmed). Could this be the start of a corrective phase now? I have spoken previously about the long term key overhead supply between $17.80/$18.50 and this will be an area of key resistance long term for silver. For the first time since the four week uptrend began the hourly MACD lines are in a negative configuration. Another early move lower today is adding to the downside pressure and a move back to test $16.80 could now be seen, a level which is key near term. A move back above the lower high at $17.72 would re-engage the bulls.
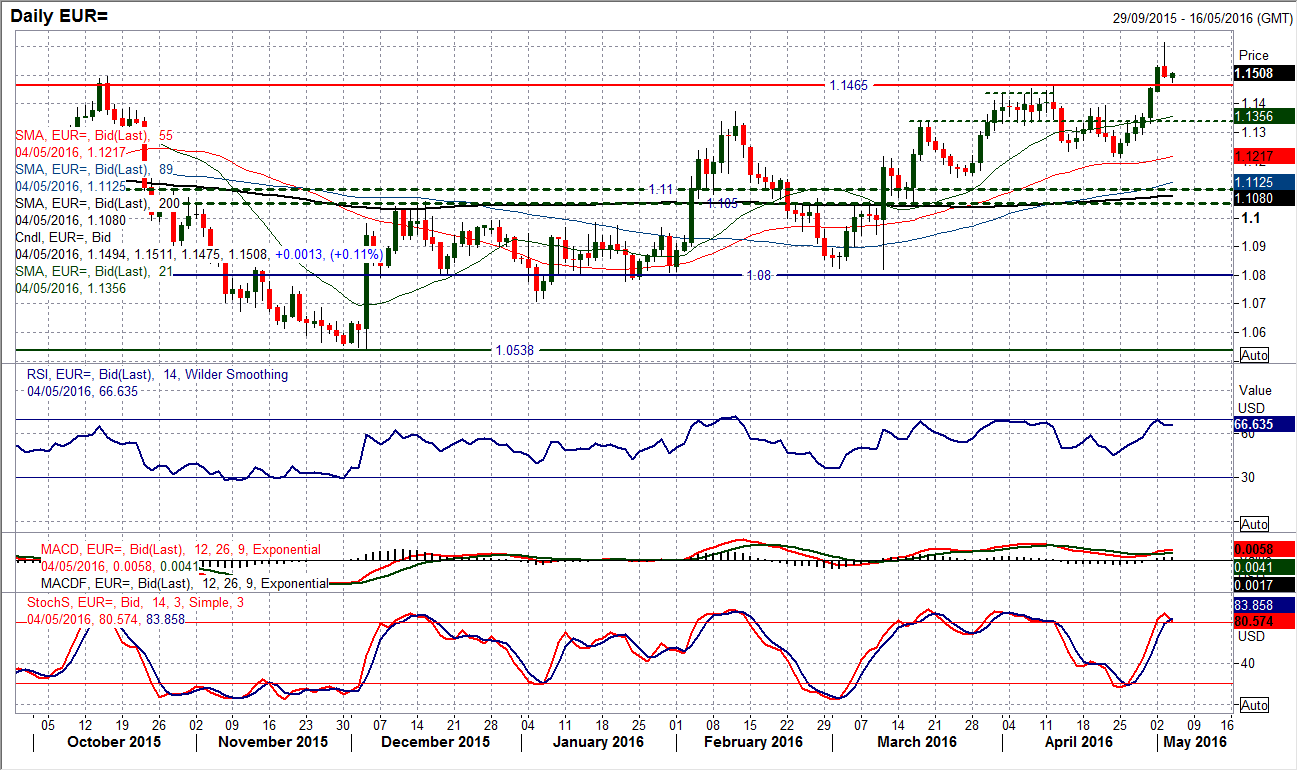
EUR/USD
After the positive run of candles comes to an end, is there about to be a correction setting in? Yesterday we saw a peak at $1.1614 before a sharp intraday reversal that closed at the low of the day. This has completed a shooting star candlestick and can be a powerful near term reversal signal. Add to the fact that the RSI peaked at 70 on Monday, whilst the Stochastics are also crossing lower in sell signal territory. A second consecutive negative candle today would confirm the corrective move. The old long term breakout of $1.1465 is supportive today but I would also look at the hourly chart because there is a near term support at $1.1445 which will be watched. A move below $1.1445 would open $1.1395. Initial resistance is $1.1538 before $1.1614 above which would abort the correction.
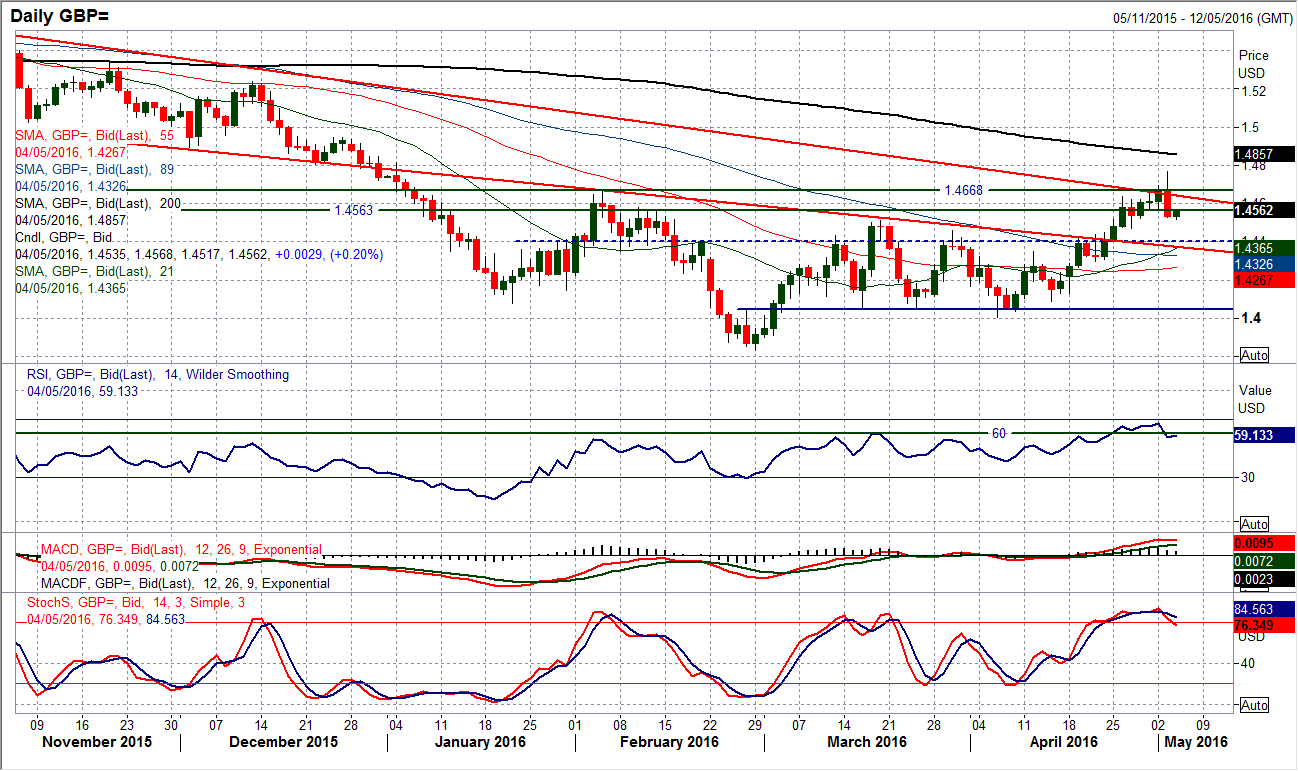
GBP/USD
A bearish engulfing candlestick completely changes the near term complexion of the chart. The run higher since the middle of April had been trending higher until yesterday but this changed (on the announcement of much weaker than expected UK Manufacturing PMI) which left a high at $1.4770 to close almost at the low of the day and below the previous day’s low of $1.4576 at $1.4527. This now adds more of a corrective outlook to the chart with the momentum indicators losing traction as the Stochastics cross over and come close to confirming a sell signal today. I have spoken previously about the run higher which consistently found support at old breakout levels however, this is being seriously tested by yesterday’s decline with the support band $1.4510/$1.4520 under pressure. Already the old support at $1.4570 is becoming a basis of resistance and this needs to be watched on an early rebound. A decisive move back below $1.4510 would re-open $1.4400 around which is much greater support and could be seen as an area for the next buying opportunity.
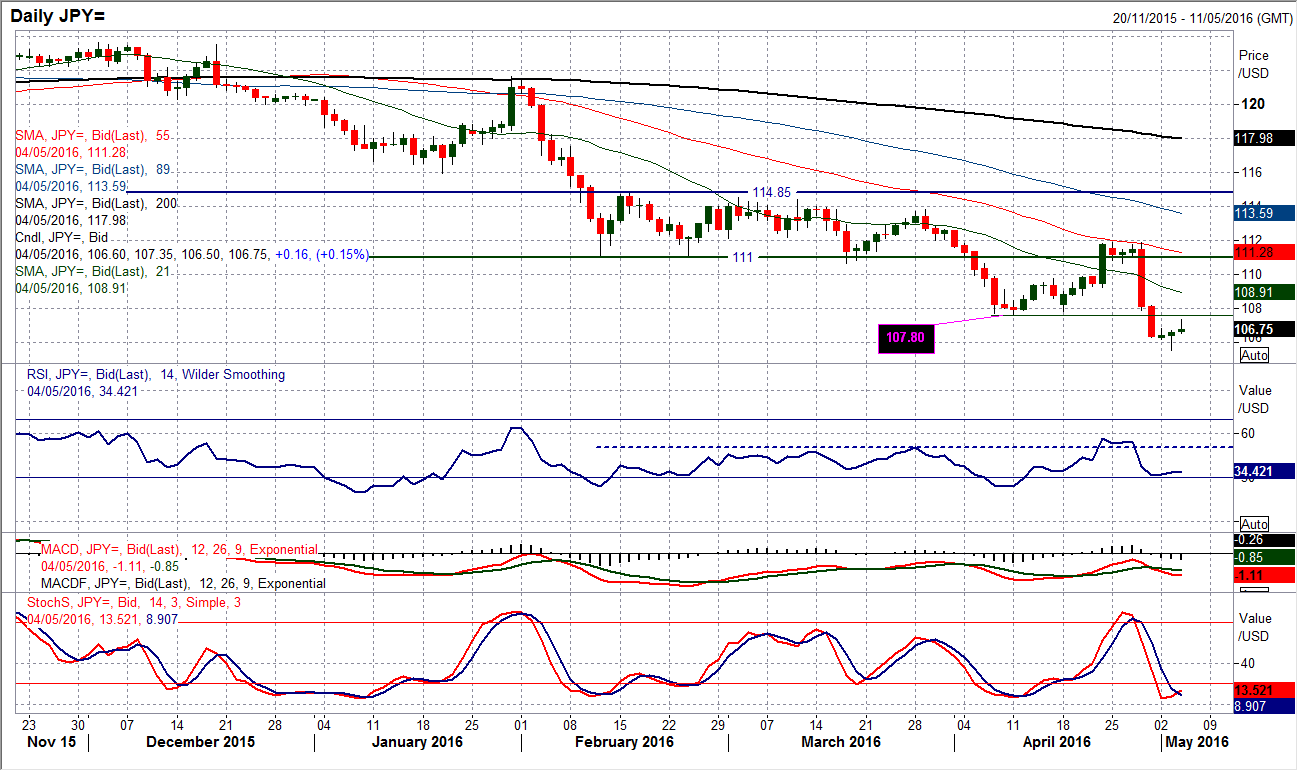
USD/JPY
The strength of the yen which has been dragging Dollar/Yen (and other yen crosses) sharply lower may now be coming under something of a retracement. A bull hammer reversal candlestick completed yesterday as the pair bounced to leave a low at 105.52 to close near to the day high. This has now been followed up by gains in the Asian session overnight. The difficult factor here is the thin trading amidst the Golden week public holiday in Japan which continues today and tomorrow. This could mean that with a lot of Japanese traders out of the market there could be a short squeeze potentially. The reaction to a test of the old breakdown at 107.60 will be interesting if it were to be seen possibly today.
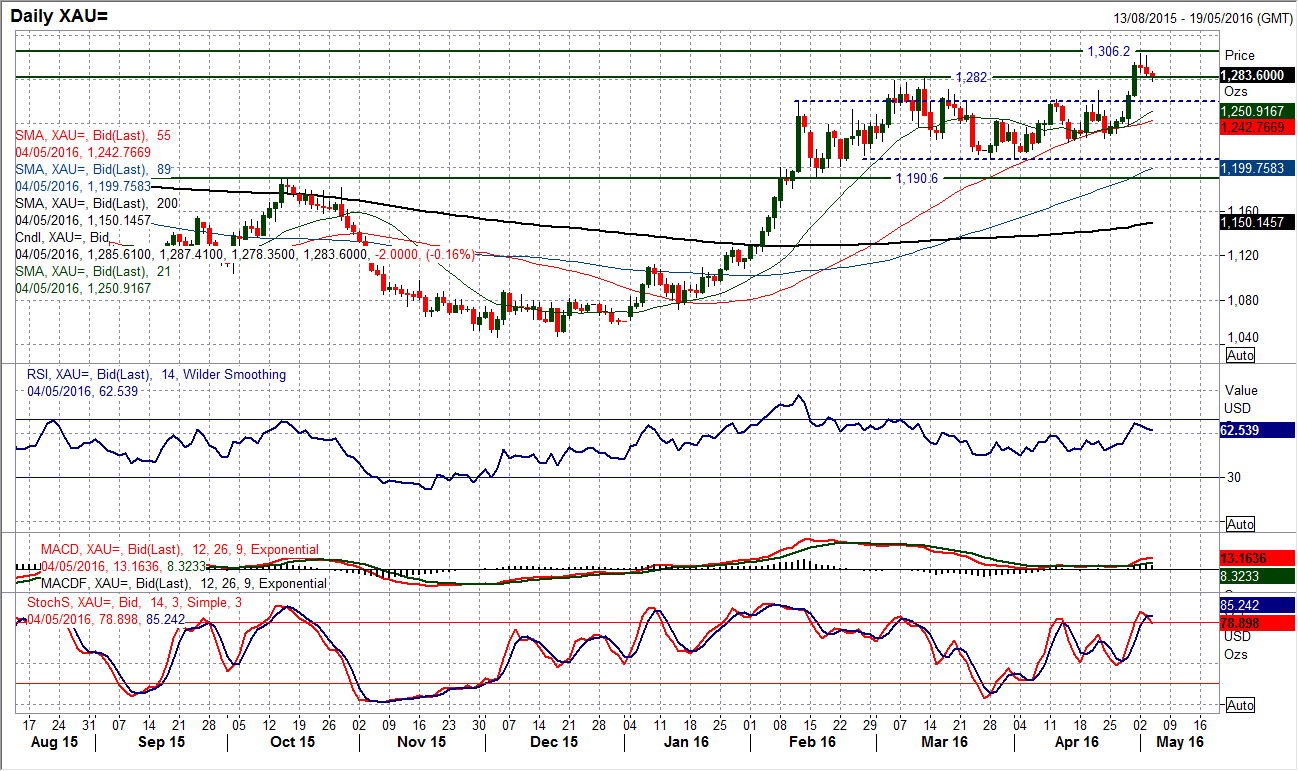
Gold
I discussed the possibility of a near term correction after Monday’s corrective candle and this has been added to by another negative candle and the prospect of the correction is no growing. The breakout above $1282.50 is now seeing a retracement which will be interesting to see how far it goes. A new higher low in the band $1260/$1282.50 would be considered strong move which could be the basis of support for the next bull move. However the near term outlook is corrective. The Stochastics have crossed lower and will now look for confirmation. The intraday hourly chart shows a small top pattern which has left minor resistance at $1288 and this now protects the high at $1303.60. Support at $1270.10 comes in initially today, whilst horly momentum indicators turn to a more corrective mode.
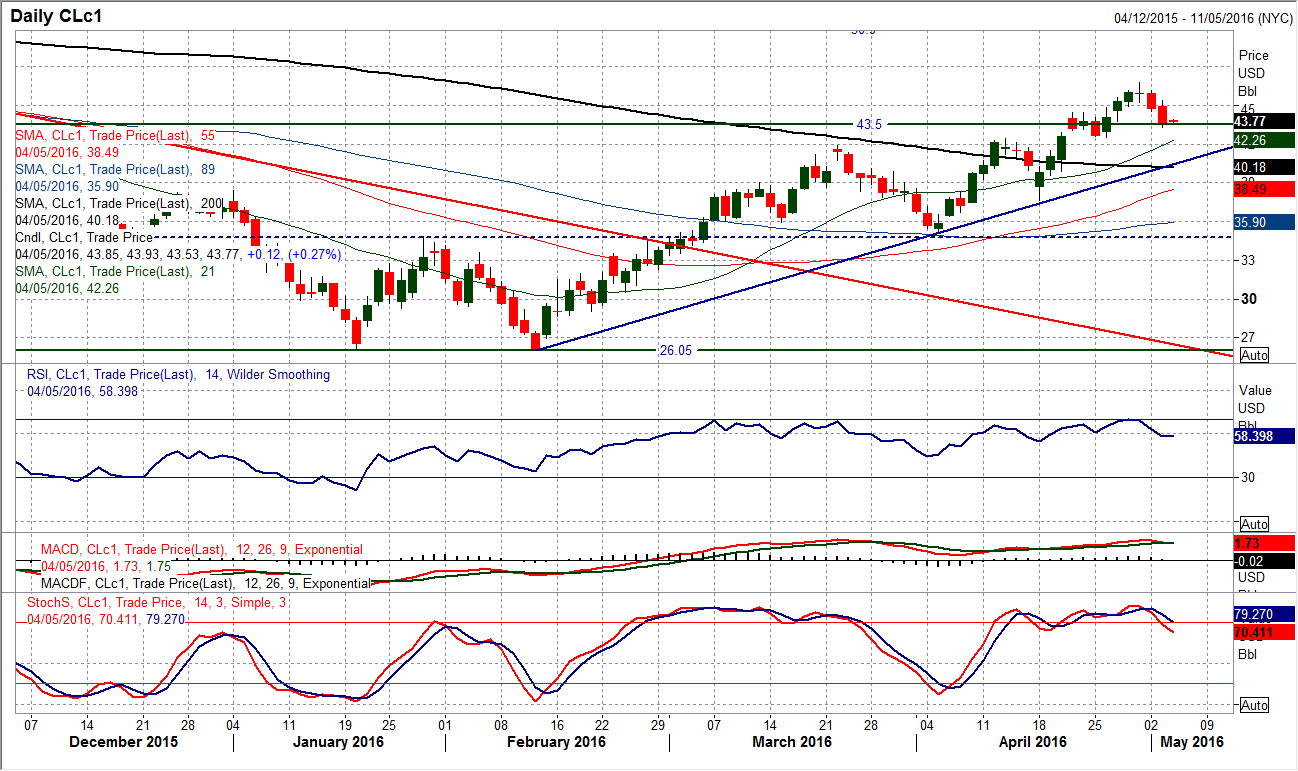
WTI Oil
A second corrective candle with a 2.5% decline on the day back to the support around $43.50. The move is helping to unwind overbought momentum and should help to renew upside potential. However the bulls will need to find their feet once more before the first key support at $42.58 is breached otherwise there may be a continuation of the near term correction back to the 12 week uptrend that currently comes in around $40.50. The intraday hourly chart shows the near term correction has formed a series of lower highs and lower lows with initial resistance at $44.60 where the hourly RSI and MACD lines have taken on more of a corrective configuration. A move back above yesterday’s high at $45.35 would re-engage the bulls.
Note: All information on this page is subject to change. The use of this website constitutes acceptance of our user agreement. Please read our privacy policy and legal disclaimer. Opinions expressed at FXstreet.com are those of the individual authors and do not necessarily represent the opinion of FXstreet.com or its management. Risk Disclosure: Trading foreign exchange on margin carries a high level of risk, and may not be suitable for all investors. The high degree of leverage can work against you as well as for you. Before deciding to invest in foreign exchange you should carefully consider your investment objectives, level of experience, and risk appetite. The possibility exists that you could sustain a loss of some or all of your initial investment and therefore you should not invest money that you cannot afford to lose. You should be aware of all the risks associated with foreign exchange trading, and seek advice from an independent financial advisor if you have any doubts.
Recommended Content
Editors’ Picks
AUD/USD remained bid above 0.6500

AUD/USD extended further its bullish performance, advancing for the fourth session in a row on Thursday, although a sustainable breakout of the key 200-day SMA at 0.6526 still remain elusive.
EUR/USD faces a minor resistance near at 1.0750

EUR/USD quickly left behind Wednesday’s small downtick and resumed its uptrend north of 1.0700 the figure, always on the back of the persistent sell-off in the US Dollar ahead of key PCE data on Friday.
Gold holds around $2,330 after dismal US data

Gold fell below $2,320 in the early American session as US yields shot higher after the data showed a significant increase in the US GDP price deflator in Q1. With safe-haven flows dominating the markets, however, XAU/USD reversed its direction and rose above $2,340.
Bitcoin price continues to get rejected from $65K resistance as SEC delays decision on spot BTC ETF options

Bitcoin (BTC) price has markets in disarray, provoking a broader market crash as it slumped to the $62,000 range on Thursday. Meanwhile, reverberations from spot BTC exchange-traded funds (ETFs) continue to influence the market.
US economy: slower growth with stronger inflation

The dollar strengthened, and stocks fell after statistical data from the US. The focus was on the preliminary estimate of GDP for the first quarter. Annualised quarterly growth came in at just 1.6%, down from the 2.5% and 3.4% previously forecast.