![]() Richard Perry
Richard Perry
Independent Analyst
Market Overview
Markets are trading fairly mixed on a quiet Monday morning as traders begin to look ahead to some key central bank meetings this week which have the potential to drive some significant volatility. Equities are trading around the flat line whilst commodities are also lacking significant direction. Wall Street closed all but flat on Friday and Asian markets were mixed early this morning. Treasury yields are holding up but there is a little bit of ground being given back by the dollar following on from its rally late last week.
In forex markets the dollar is coming under some corrective pressure today as markets look ahead to the FOMC meeting this week. The sharp gains versus the yen last week are just being pared slightly, however sterling which has been the best performer of the past week (as President Obama and potential next President Hillary Clinton have both sided with the Remain camp as part of the UK referendum) continues to gain ground. Expect reduced volumes on the Kiwi and Aussie today with public holidays for ANZAC day.
Traders will be on the lookout for German Ifo Business Climate at 0900BST with an expectation of a continued recovery to 107.1 (from 106.7 last month) which would be a 3 month high. The US New Home Sales are expected to show an improvement of around 3% to around 530,000.
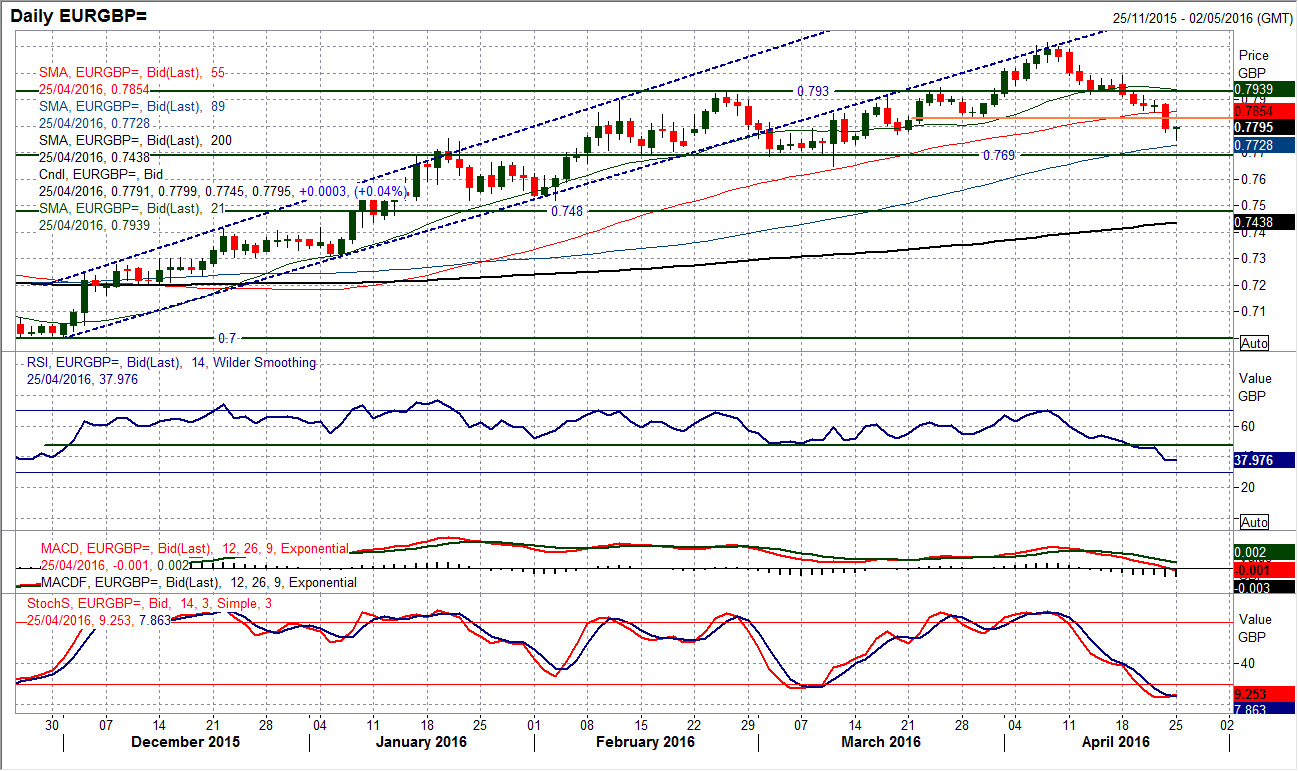
Chart of the Day – EUR/GBP
With the euro corrective in the wake of the dovish ECB and sterling making ground, there has been a considerable turnaround in the medium term outlook over the past couple of weeks. I have talked previously about the support band £0.7830/£0.7930, however this level has now been breached and I see this as a decisive medium term breakdown. The move has seen the pair below the 55 day moving average (currently £0.7855) for the first time since early December, whilst the RSI has also dropped below 48 and to a near 5 month low (as have the MACD lines). This all points towards growing corrective momentum and a move back towards a test of the next key support band £0.7650/£0.7700. The old support band around £0.7930 becomes a basis of resistance this week and rallies become a chance to sell. I would also watch out for the 21 day moving average (today at £0.7938) which has previously been a basis of support now potentially becoming a basis of resistance too in the coming days. The hourly chart shows the continued slide of the past couple of weeks and that any unwinding of the hourly RSI back into the 50s seems to be seen as a chance to sell. The overnight bounce from £0.7745 could prove to be that chance, with initial resistance between £0.7850/£0.7900.
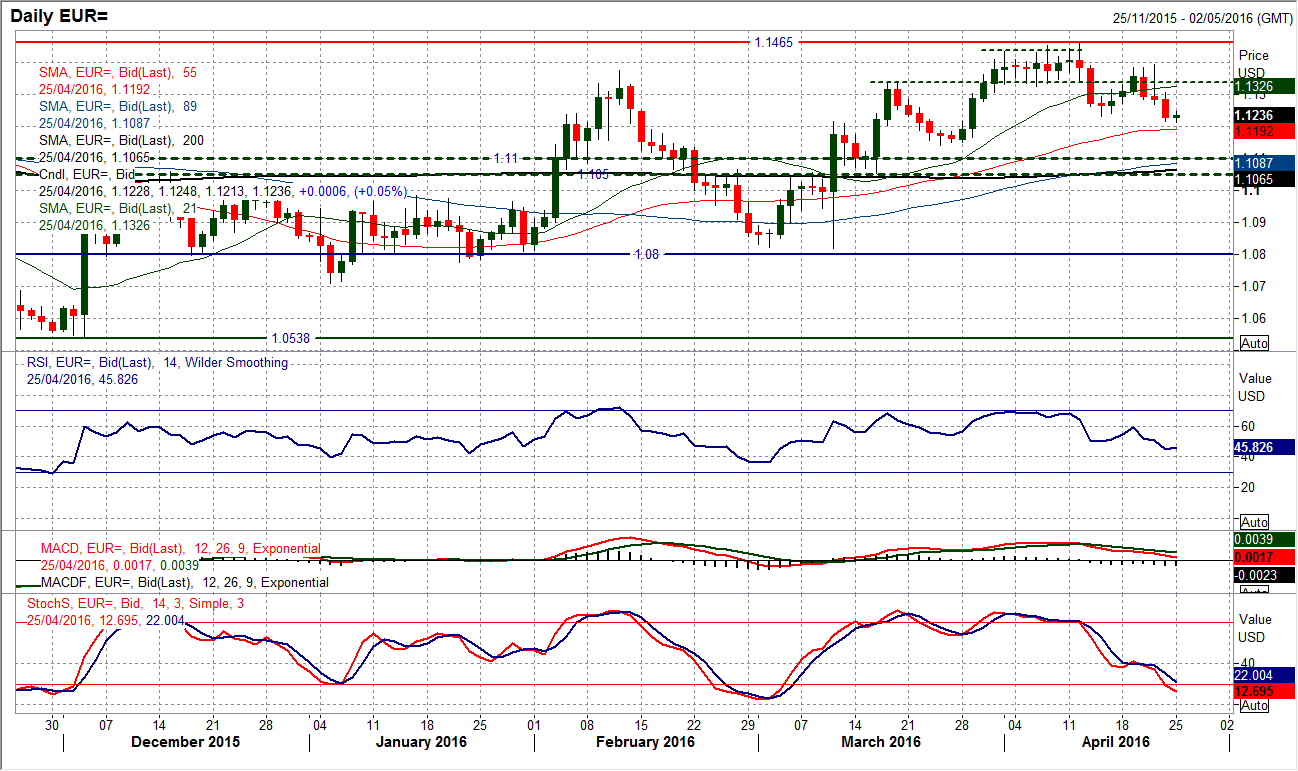
EUR/USD
The sellers are beginning to ramp up the corrective pressure now after a third consecutive bearish candle. The decline on Friday has also broken below the support of the mid-April low at $1.1230 and although it has not been a decisive break the sequence for a lower high ($1.1395 in the wake of the ECB press conference) and now a new lower low ($1.1216 from Friday) is now forming. Add in this to momentum indicators that are confirming the slide and the near term outlook is increasingly building towards a potential pullback towards the long term pivot band at $1.1100, whilst the next key reaction low is at $1.1140. So lookout for the near term rallies to find resistance and again fall over. Initial resistance is now in the band $1.1275/$1.1300.
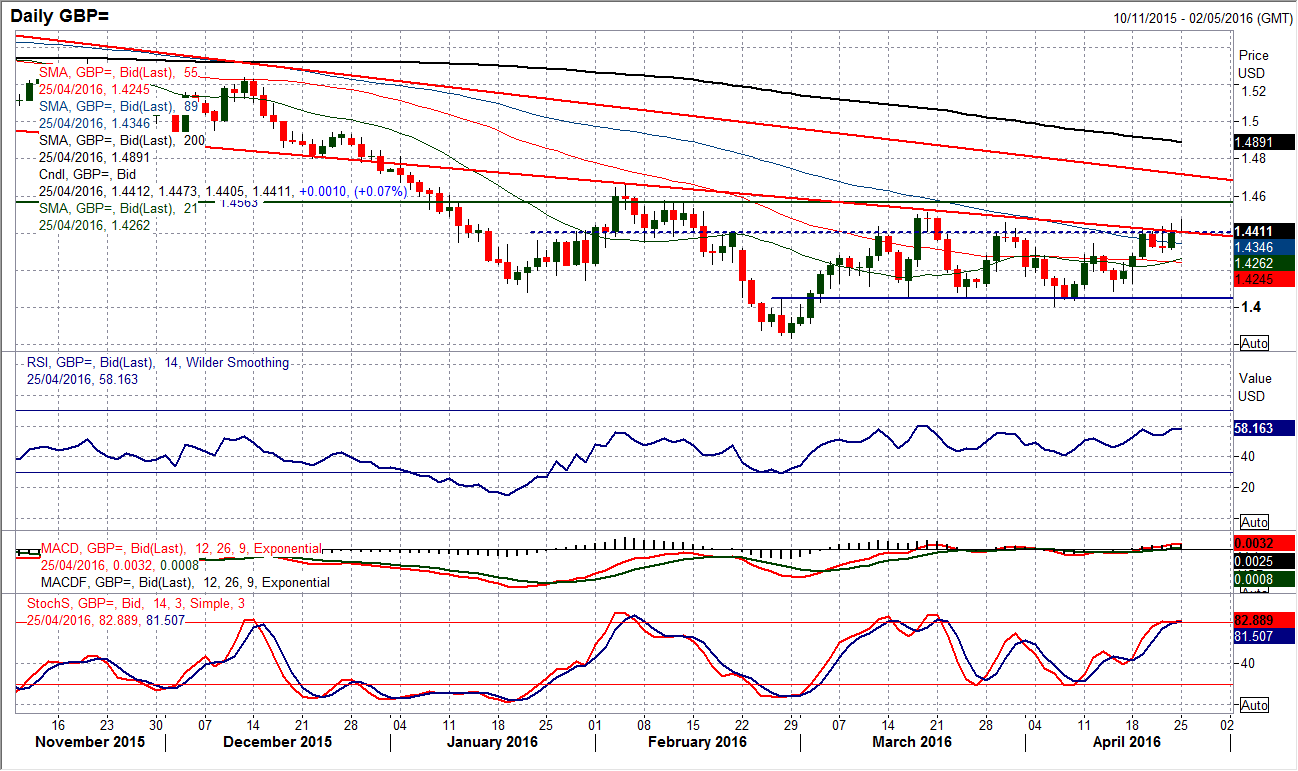
GBP/USD
The sterling bulls are fighting hard now to prevent the usual rally that gets sold from taking hold once more. This move up to the resistance band of the March highs is becoming important for the medium term outlook. The move has certainly been bolstered by the Obama interjection over the Brexit argument an it will be interesting to see if European traders come in and run with it now. The overhead chart resistance between $1.4460/$1.4515 capped the moves in March and if this is broken to the upside it could prove to be a significant breakout. The sequence of lower highs is already being challenged by some early morning gains today, but the RSI could be the telling indicator here, as it has not been above 60 since August 2015 and a move into stronger positive momentum would really suggest that the bulls were ready to make a move. A break above $1.4515 could be arguably seen as a range breakout implying around 460 pips of upside potential. The intraday hourly chart shows the support between $1.4300/$1.4320 is growing and that dips are a chance to buy.
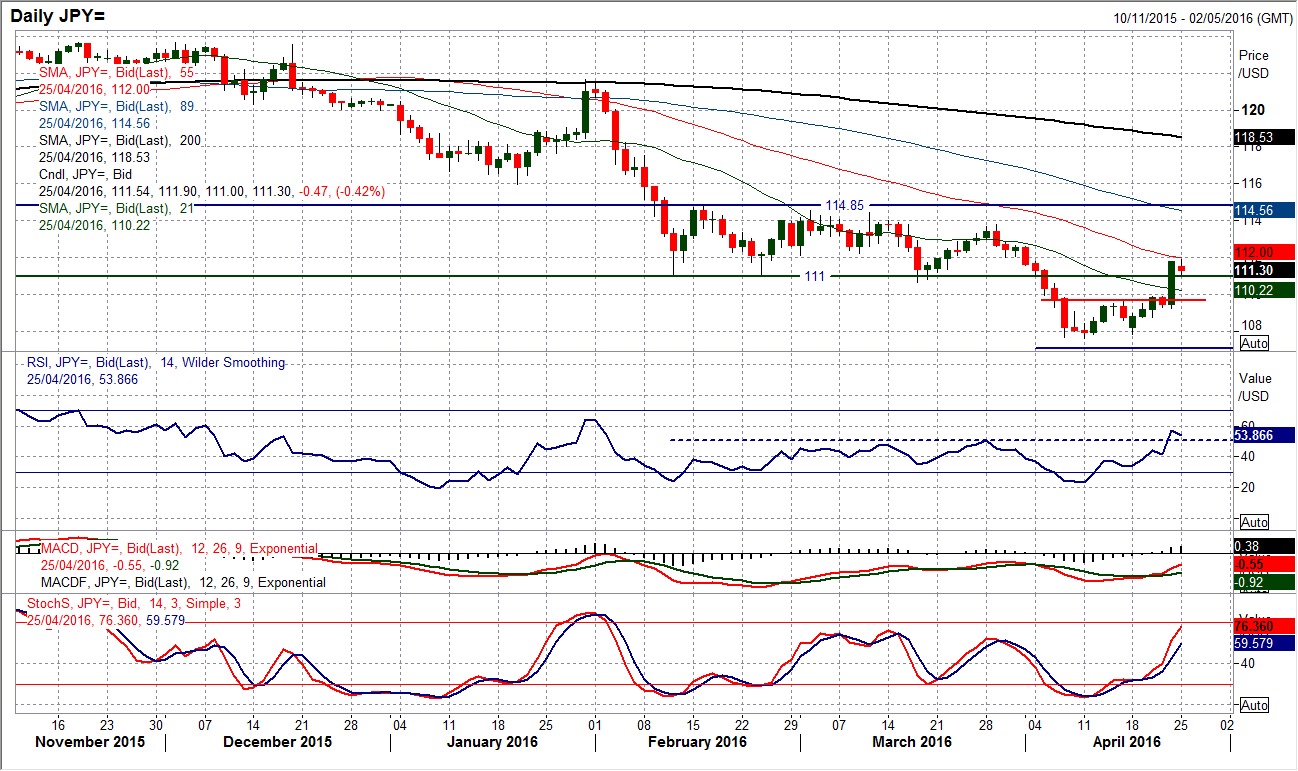
USD/JPY
An incredibly strong bull candle formed on Friday which added pips in what was the first seriously bullish candle on Dollar/Yen for a good couple of months. However is it a candle that seriously changes the outlook? That could all depend upon how the bulls react today. Often you will see strong candles failing to confirm the move and then unwinding back in the coming days. The implied target of 111.60 from the near term base pattern has already been achieved so we are now looking for the next signal. Overnight in the Asian session we have seen the retracement starting to kick in and this now means that the old 111.00 support area will be important. If the retracement moves back below 111.00 to close below it, this would be taken as more of a corrective signal. The momentum indicators are unwinding on the daily chart but the medium term outlook remains negatively configured and there is much to be done to change the outlook that says rallies are a chance to sell. The hourly RSI is falling back again and if this can settle above 40 then the bulls could see this as a positive sign. With the Bank of Japan set to report monetary policy this week this is an important time for the yen.
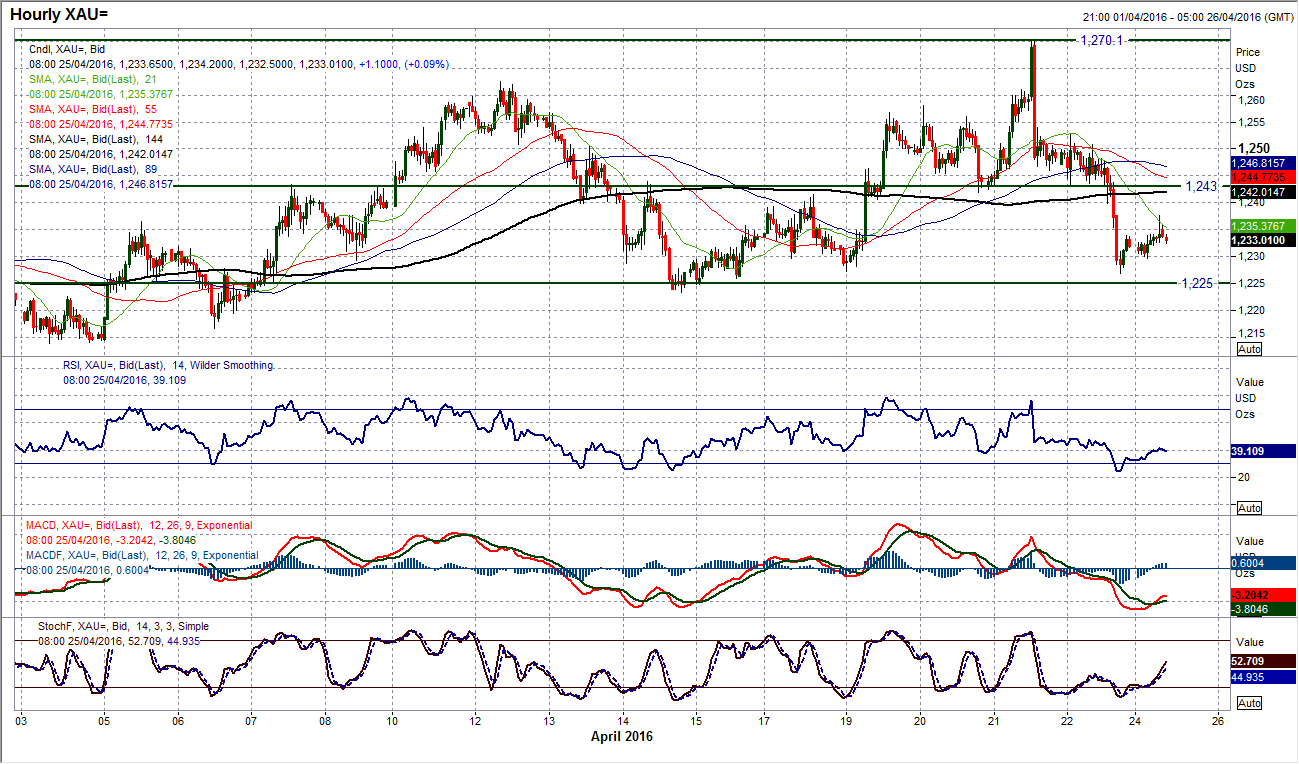
Gold
The gold bulls just cannot find any real traction that would be needed to seriously threaten an upside breakout. Every time the resistance is tested the bears come back in to maintain the range play. Friday’s corrective candle has again dragged the price back lower. The move has pulled the price below the 55 day moving average (at $1235) and also with the choppy momentum indicators falling back lower again, there is little suggestion that there will be a range break any time soon. The hourly chart shows the importance of the pivot at $1243 which once broken has pulled the price lower towards the next key pivotal support at $1225. The pivot at $1243 now becomes an area of resistance near term. If $1225 is broken the initial support is $1216 but the chances are that there would be a pullback to the more important support around $1208. The choppy range continues.
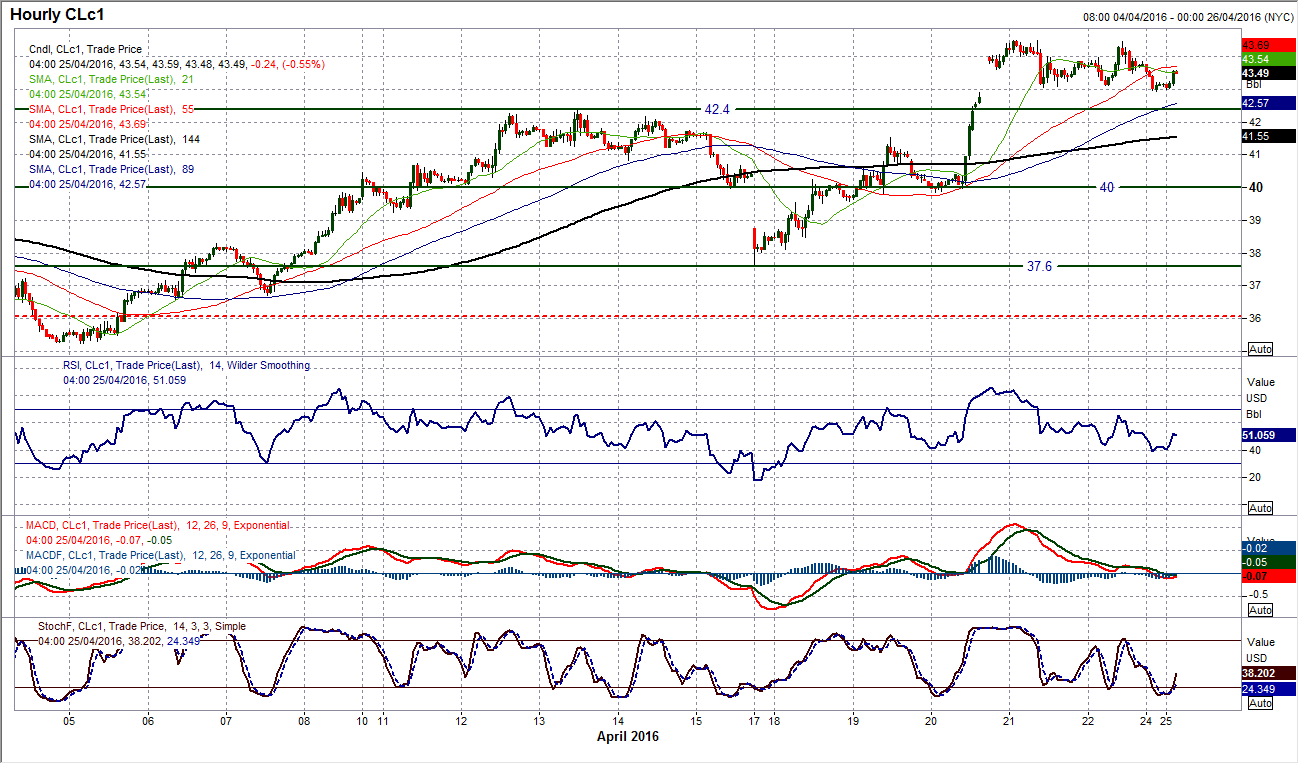
WTI Oil
The oil price is beginning to build a consolidation pattern between $43/$44.50 which will need to be watched. The breakout above $43.50 has not been decisive and the bulls are just having to battle now to hold on to the recent gains. Medium term momentum indicators remain strongly configured on the daily chart, although interestingly, the RSI is back at 68 which could be argued to be looking somewhat stretched considering the RSI failed to get above 70 during the March rally. The hourly chart shows that a decisive move below $43.00 would open a near term correction. The hourly chat shows that there is a basis of support forming at $42.10 for the bulls to build from now, whilst the main band of support is $41.50/$42.40.
Note: All information on this page is subject to change. The use of this website constitutes acceptance of our user agreement. Please read our privacy policy and legal disclaimer. Opinions expressed at FXstreet.com are those of the individual authors and do not necessarily represent the opinion of FXstreet.com or its management. Risk Disclosure: Trading foreign exchange on margin carries a high level of risk, and may not be suitable for all investors. The high degree of leverage can work against you as well as for you. Before deciding to invest in foreign exchange you should carefully consider your investment objectives, level of experience, and risk appetite. The possibility exists that you could sustain a loss of some or all of your initial investment and therefore you should not invest money that you cannot afford to lose. You should be aware of all the risks associated with foreign exchange trading, and seek advice from an independent financial advisor if you have any doubts.
Recommended Content
Editors’ Picks
EUR/USD stays weak near 1.0650 ahead of Eurozone PMI data

EUR/USD remains on the back foot near 1.0650 in European trading on Tuesday. Resurgent US Dollar demand amid a cautious risk tone weighs on the pair. Investors stay wary ahead of the preliminary Eurozone and US business PMI data.
GBP/USD eases below 1.2350, UK PMIs eyed

GBP/USD is dropping below 1.2350 in the European session, as the US Dollar sees fresh buying interest on tepid risk sentiment. The further downside in the pair could remain capped, as traders await the UK PMI reports for fresh trading impetus.
Gold price flirts with $2,300 amid receding safe-haven demand, reduced Fed rate cut bets

Gold price (XAU/USD) remains under heavy selling pressure for the second straight day on Tuesday and languishes near its lowest level in over two weeks, around the $2,300 mark heading into the European session.
PENDLE price soars 10% after Arthur Hayes’ optimism on Pendle derivative exchange

Pendle is among the top performers in the cryptocurrency market today, posting double-digit gains. Its peers in the altcoin space are not as forthcoming even as the market enjoys bullish sentiment inspired by Bitcoin price.
Focus on April PMIs today

In the euro area, focus today will be on the euro area PMIs for April. The previous months' PMIs have shown a return of the two-speed economy with the service sector in expansionary territory and manufacturing sector stuck in contraction.