Market Overview
Investor sentiment is once again taking a nose dive as indicators that had been recovering in the last week or so have sharply reversed again. Once more it is the oil price which is the chief cause of concern for markets and which is driving safe haven flows. Rumours of an agreement on potential production limits between OPECC and Russia have evaporated and the ensuing sell-off has ratcheted up the fear gauge once more. Key trigger markets such as the Japanese yen and US Treasuries are the preferred destination to park funds, with the US 10 year Treasury yield bursting below the 1.900% support to a level not seen since April 2015. Furthermore there is a significant retracement of the weakness on the yen that came following the easing actions of the Bank of Japan. However, can the markets look past the weakness on oil and focus on the China Services PMI data which improved to 52.4 (above the 50.2 of last month) which was a six month high and reflects a much needed improvement in the growing service sector.
This is all means that equity markets are under considerable strain once more and Wall Street saw sharp losses into the close again, with the S&P 500 down 1.9%. Asian markets followed suit today with the Nikkei off 3.1% and European indices are also lower in early moves.
There is very little movement across the forex majors so far today, although the Kiwi is the standout performer. New Zealand unemployment saw an unexpected sharp drop to 5.3% from 6.0% last month and well below the expected increase to 6.1%, in addition to comments from the central bank that there was unlikely to be a rate cut in March. Gold continues to consolidate, whilst interestingly the oil price has been stable in the early moves today.
Today is the turn of the services PMIs to drive sentiment. Already China has shown a welcome improvement, with the Eurozone data released at 0900GMT which means that the composite PMI is expected to show a slide to 53.5 (down from last month’s 54.3). The UK services PMI is announced at 0930GMT and is expected to dip slightly to 55.3 from 55.5. The ISM Manufacturing is the key release and is expected to slie to 55.1 from 55.8 last month. The ADP Employment report will also be watched at 1315GMT as it can have a lead for Friday’s crucial payrolls data, with an expectation of a dip to 195,000 from 257,000 last month. The weekly US EIA crude oil stocks are expected to show yet another inventory build of +5.0m barrels (last week +8.4m).
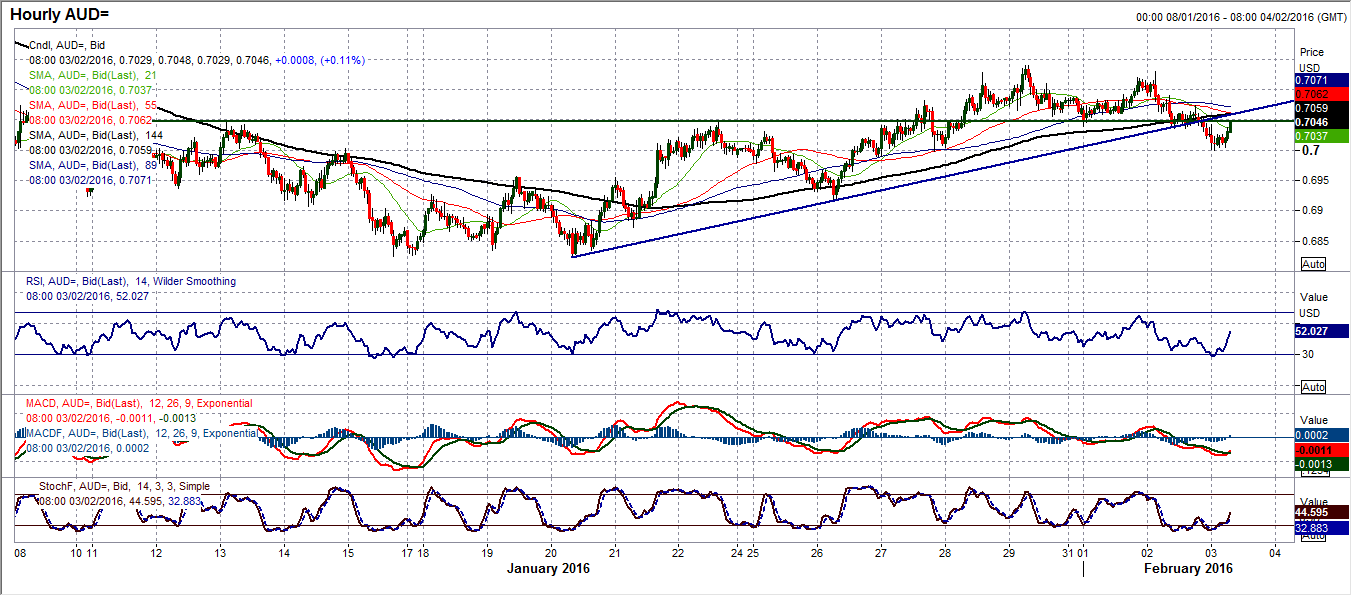
Chart of the Day – AUD/USD
The recovery on the Aussie could be in the process of breaking down as the outlook is increasingly looks as though the next turn will be lower. The Aussie rally from the $0.6825 low managed to complete a base pattern on a move above $0.7050, however the rally seems to have petered out at $0.7140 and now the bearish signals are beginning to come through again. The RSI is again seemingly turning lower from the 55/60 area which has often previously been where the bulls have run out of steam. The concern is also that there is also a crossover sell signal on the Stochastics which is close to being confirmed, with the previous sell signal coming just prior to the January sell-off. The uptrend of the past two weeks has also now been broken and on the hourly chart this could come in as resistance, currently around $0.7060. The hourly chart also shows the hourly RSI consistently bouncing around the 30 point and if this level is broken it would also be a signal to be of concern. The old neckline of the base pattern at 0.7050 has broken and a near term top pattern has completed which which would imply 90 pips of downside to 0.6960. There is minor support around $0.7000 which has held initially, but the bears are increasingly in control. There is little real support until $0.6915.
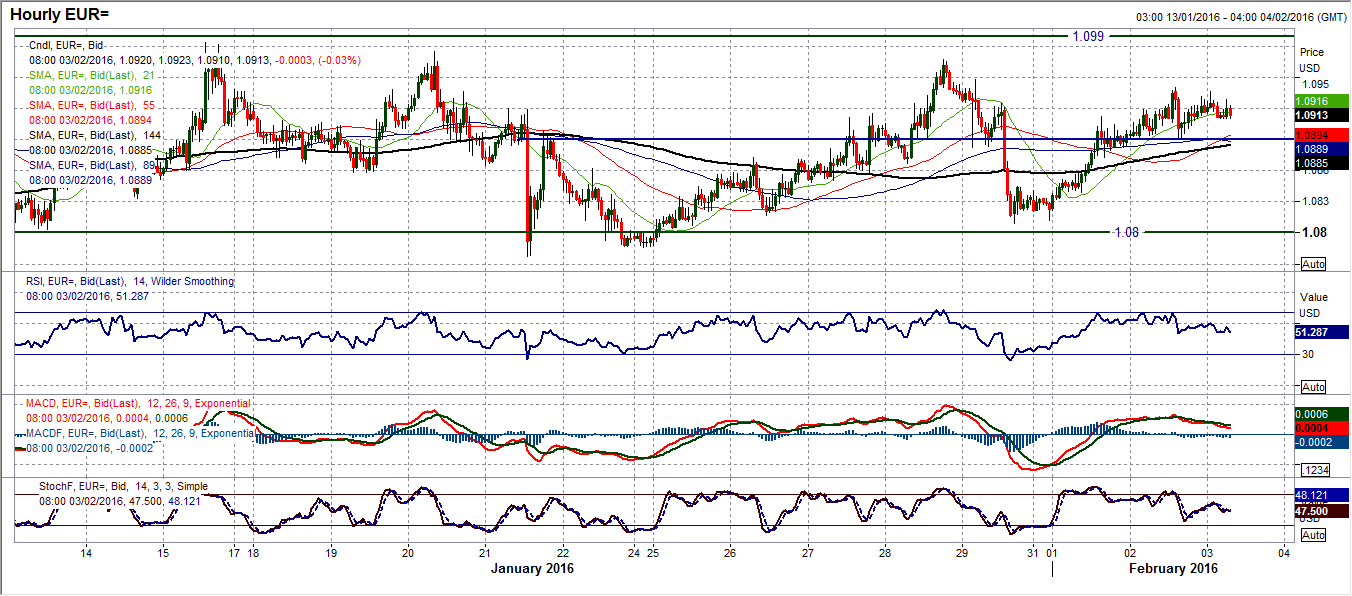
EUR/USD
As the pair once again drifts higher, the euro seems to be taking on a similar theme of trading to how it played last week. The rather benign moves on the euro in recent weeks make it rather difficult to come up with something new to say every day, but one more the pair is moving into an area at which the near term sellers will be eying potential opportunities. The extremely neutrally configured technical indicators do not point towards an imminent breakout and as such the resistance band that starts to come in around $1.0940 up towards $1.0990 is likely to act once more as the overhead supply for the next retracement back towards the $10810 range lows. A close above $1.0940 may start to change the outlook but for now the range continues. The momentum indicators on the hourly chart have already rolled over and are starting to suggest the sellers are ready to pounce. A move back below $1.0890 would open the retracement again.
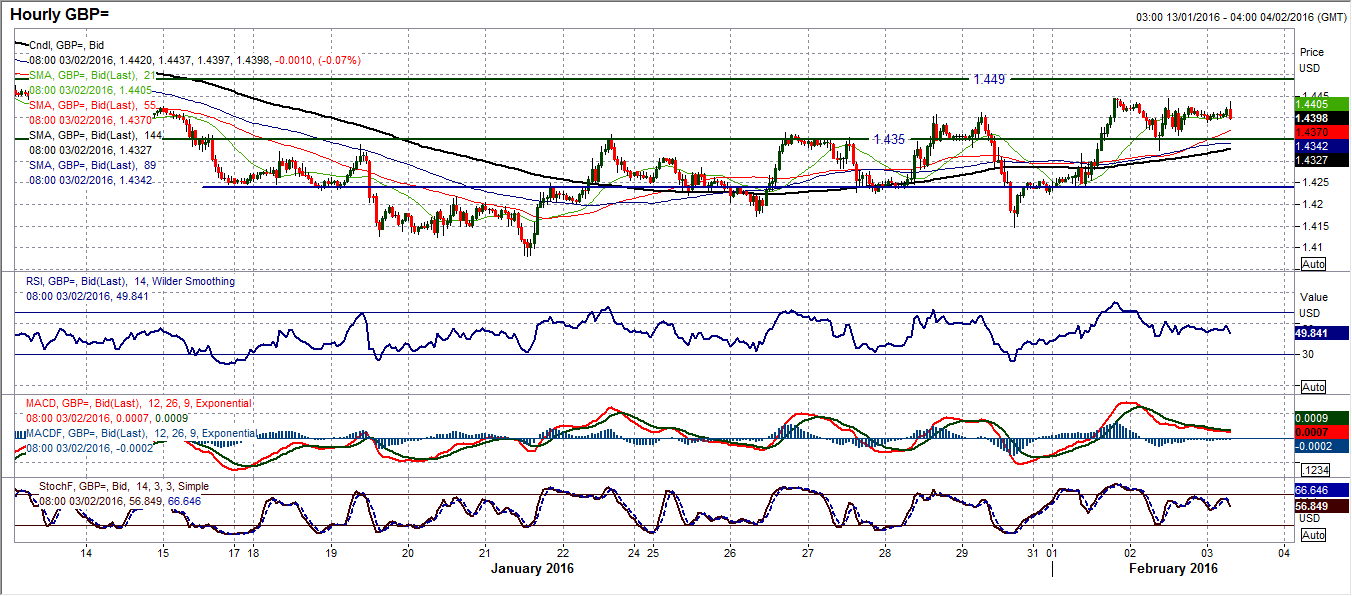
GBP/USD
Finally the sequence of sharp retracements has been broken, but can we trust an upside move on Cable? The momentum indicators certainly seem to suggest the improvement as the Stochastics and MACD lines improve. Also a two day closing level clear of the 23.6% Fibonacci retracement of the $1.5238/$1.4079 sell-off (at $1.4353) is a notable improvement which should now open a move back towards the $38.2% Fib level at $1.4522. However, I am interested to note that the daily RSI is in a very well defined downtrend which actually dates all the way back to May 2015 with multiple touches and the latest rebound to that downtrend on the RSI is around 48, a level at which the RSI is at now. This may suggest limited potential in this recovery. However, the hourly chart shows the near term picture as far more positive with the $1.4350 old pivot still playing a role as support and with more positively configures momentum. However the $1.4445 resistance is the intraday barrier overhead that has held twice. A break would open $1.4490 as the next resistance. Below $1.4325 re-opens $1.4235.
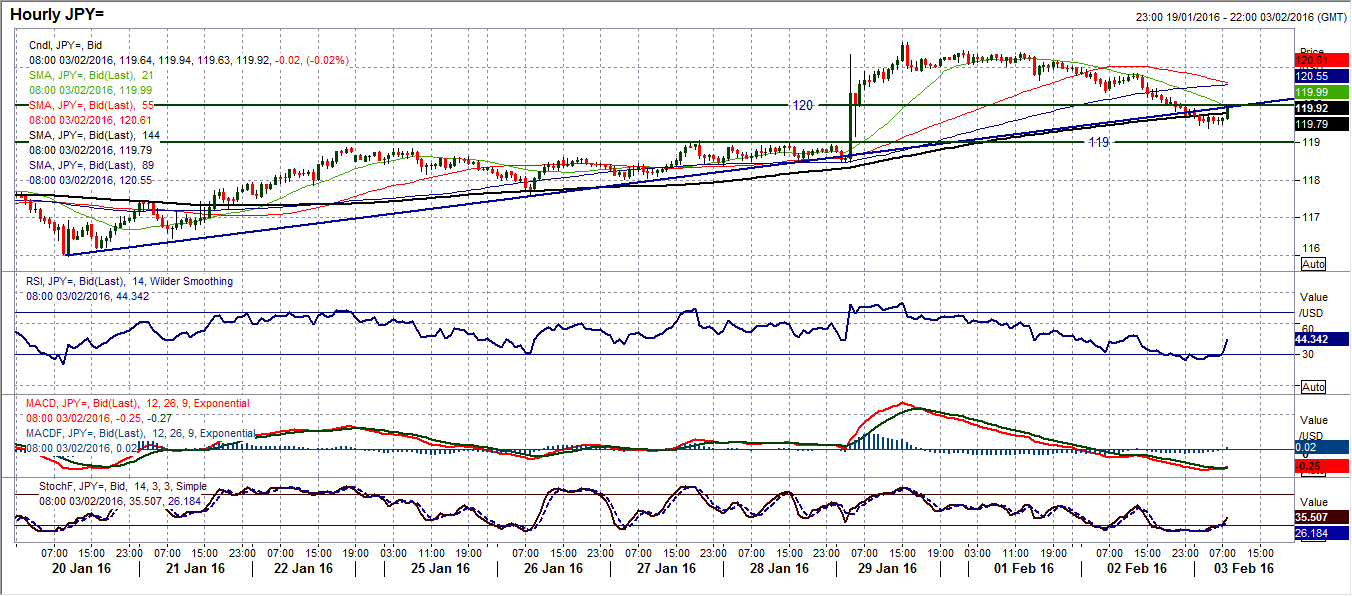
USD/JPY
Once again the yen is a safe haven play. The concerns that I had yesterday of the retracement of the Dollar/Yen bull move seem to have been well founded as a sharp bear candle of over 100 pips has unwound much of the move. The daily momentum indicators are a concern now with the Stochastics looking to confirm a sell signal and the MACD lines merely having unwound back to the neutral line and helps to renew downside potential. The hourly chart shows how a sequence of lower highs has accelerated in the past day and a half as a correction has set in A breach of the initial support at 120.00 now becomes the basis of resistance, with further overhead supply in the band 120.35/120.65. The hourly chart also shows a broken uptrend of the recovery, and momentum indicators far more negatively configured. This would suggest that intraday rallies are now being sold into and a retracement back towards the initial key support area around 119.00 could easily be seen.
Gold
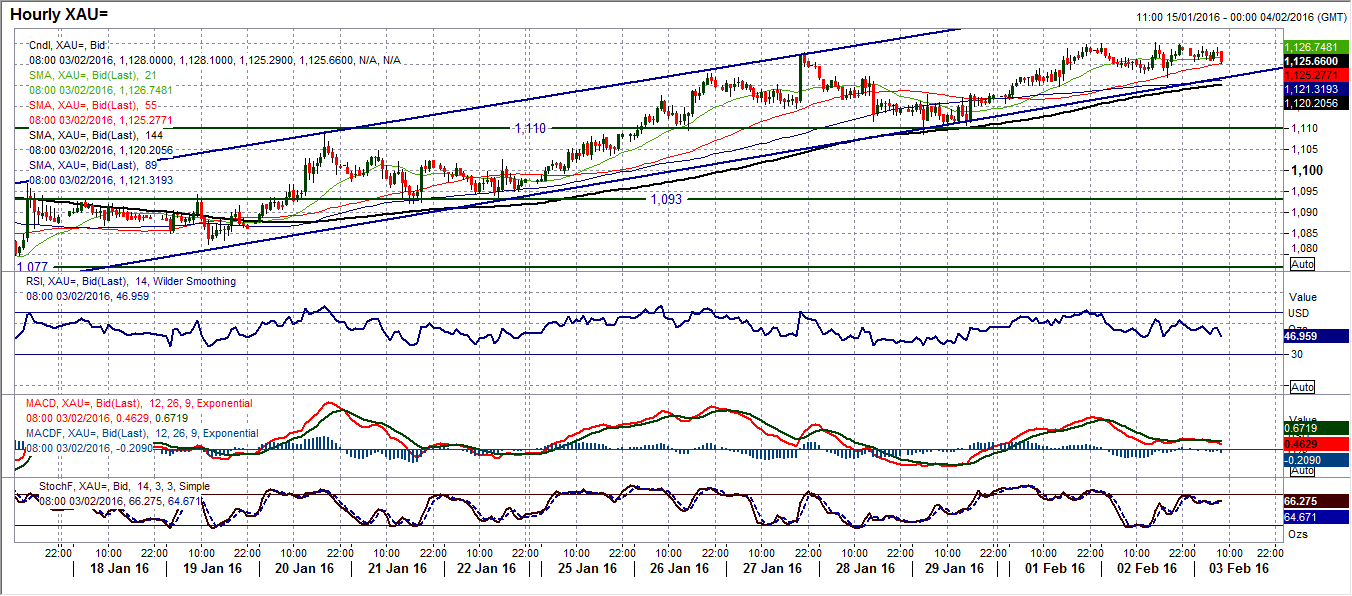
All the bullish near to medium term arguments continue to hold steady. The uptrend channel that has been pulling gold higher in the past three weeks continues, as does the strong momentum which shows the RSI with higher highs, the MACD lines rising and the Stochastics in bullish configuration. Yesterday’s candle that only showed minor gains on the day still held up against the profit takers but the outlook remains buying into dips for now. The uptrend channel comes in at $1120 today. The hourly chart also broadly backs this outlook with positive moving averages, but with a slight caveat of a hint of waning momentum. This would suggest that a decisive break above the resistance around $1130 would be preferable to maintain the momentum. The next resistance is $1136.50 and then $1142. Support at $1120 is strengthening with $1110 now key.
WTI Oil
The direction of the oil price in the next day or so could have significant implications for the next leg of financial markets. Oil is a driver of sentiment now and yesterday’s close back below the psychological $30 level on WTI could be significant. The support at $30 initially held for a few days in mid-January before a sharp breach. There is support in the band between $29.25 and $30 which is vital today, with the lower level marking a reaction low within the recent rally. To lose the support at $29.25 now would open the $26.20 key January low but with the downside momentum renewed it could be even more bearish than that. The Stochastics have crossed back lower again which is the 5th time in 5 months this has happened and every time it has preceded a significant decline. The hourly chart shows momentum is far more negatively configured now and with hourly moving averages in decline the outlook is now one to sell into strength. Resistance levels to watch now come in at $31.25 and $31.75. The bears may not be fully in control yet, but they are on the brink.
Note: All information on this page is subject to change. The use of this website constitutes acceptance of our user agreement. Please read our privacy policy and legal disclaimer. Opinions expressed at FXstreet.com are those of the individual authors and do not necessarily represent the opinion of FXstreet.com or its management. Risk Disclosure: Trading foreign exchange on margin carries a high level of risk, and may not be suitable for all investors. The high degree of leverage can work against you as well as for you. Before deciding to invest in foreign exchange you should carefully consider your investment objectives, level of experience, and risk appetite. The possibility exists that you could sustain a loss of some or all of your initial investment and therefore you should not invest money that you cannot afford to lose. You should be aware of all the risks associated with foreign exchange trading, and seek advice from an independent financial advisor if you have any doubts.
Recommended Content
Editors’ Picks
AUD/USD jumps above 0.6500 after hot Australian CPI data

AUD/USD extended gains and recaptured 0.6500 in Asian trading, following the release of hotter-than-expected Australian inflation data. The Australian CPI rose 1% in QoQ in Q1 against 0.8% forecast, providing extra legs to the Australian Dollar upside.
USD/JPY hangs near 34-year high at 154.88 as intervention risks loom

USD/JPY is sitting at a multi-decade high of 154.88 reached on Tuesday. Traders refrain from placing fresh bets on the pair as Japan's FX intervention risks loom. Broad US Dollar weakness also caps the upside in the major. US Durable Goods data are next on tap.
Gold price cautious despite weaker US Dollar and falling US yields

Gold retreats modestly after failing to sustain gains despite fall in US Treasury yields, weaker US Dollar. XAU/USD struggles to capitalize following release of weaker-than-expected S&P Global PMIs, fueling speculation about potential Fed rate cuts.
Crypto community reacts as BRICS considers launching stablecoin for international trade settlement

BRICS is intensifying efforts to reduce its reliance on the US dollar after plans for its stablecoin effort surfaced online on Tuesday. Most people expect the stablecoin to be backed by gold, considering BRICS nations have been accumulating large holdings of the commodity.
US versus the Eurozone: Inflation divergence causes monetary desynchronization

Historically there is a very close correlation between changes in US Treasury yields and German Bund yields. This is relevant at the current juncture, considering that the recent hawkish twist in the tone of the Fed might continue to push US long-term interest rates higher and put upward pressure on bond yields in the Eurozone.
