![]() Richard Perry
Richard Perry
Independent Analyst
Market Overview
Markets are still coming to terms with the central bank announcements of the last couple of days and the legacy of these decisions continues to impact through the markets with US dollar weakness continuing. The surprise non-move from the Bank of Japan continues to strengthen the yen and the ensuing dollar weakness is spreading across markets. With Treasury yields falling sharply, the dollar has come under significant pressure again and the Dollar Index has fallen below is mid-April low at 93.6 to reach its lowest level since the August 2015 spike low of 92.6. This is having a knock on impact with gains on commodities such as gold and oil. Wall Street suffered after the downbeat US growth data and weakness on megacap stock Apple weighed on sentiment. The S&P 500 closed off 0.9%, whilst Asian markets were also weaker overnight (although the Nikkei was shut for a public holiday). European markets have fallen back again in early moves after bouncing last night into the close.
Forex markets continue to reflect the dollar weakness with the greenback lower once more again all of the major currencies, but again the standout is the outperformance of the Japanese yen. Precious metals also continue to climb with gold and silver again rising strongly. The oil price is consolidating a touch after further gains yesterday.
Traders will be looking out for the first reading of Eurozone CPI inflation which is released at 1000BST which is expected to turn negative again with -0.1% for the year on year reading (from flat last month). There will also be the Fed’s preferred US inflation measure, the Personal Consumption Expenditure at 1330BST and is expected to be +0.1% for the core month on month reading which would reflect a stalling in the inflation uptick. Revised Michigan Sentiment is at 1500BST and is expected to be 90.3 (slightly up from the prelim 89.7).
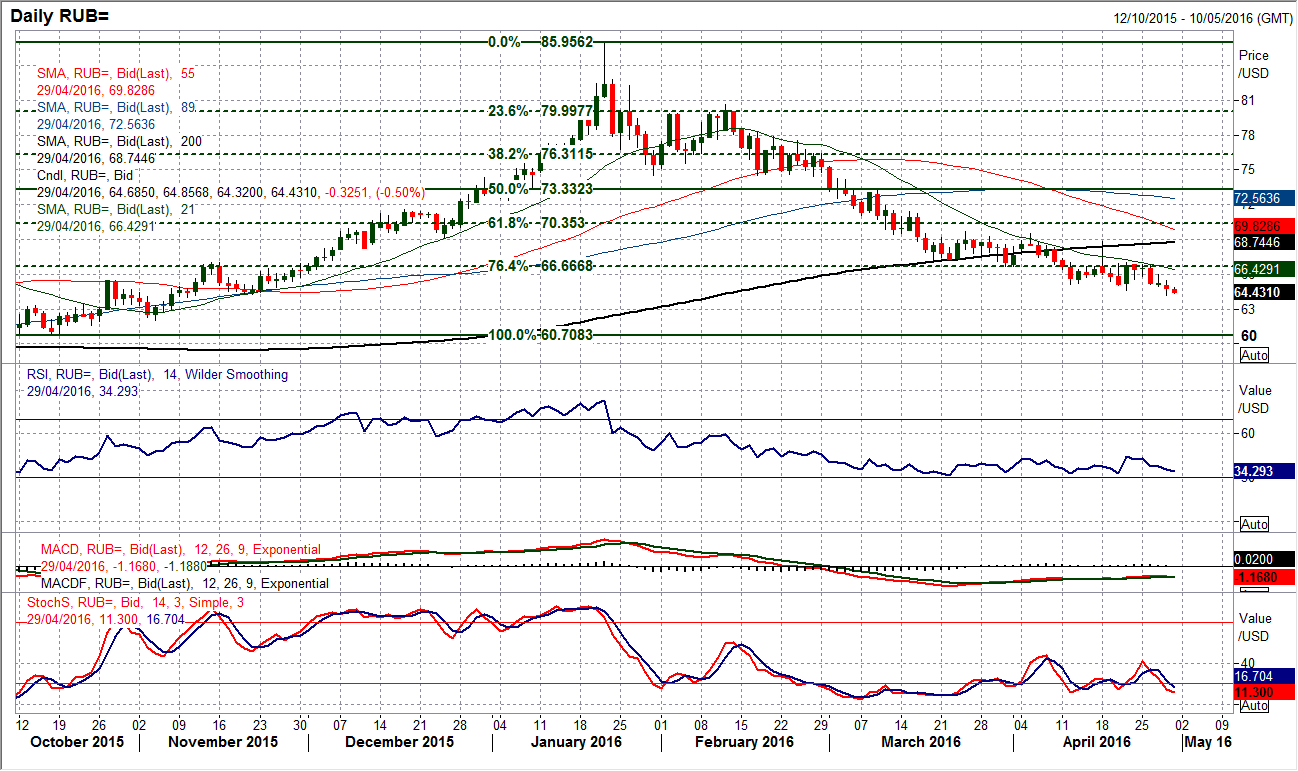
Chart of the Day – USD/RUB
Dollar/Rouble is still falling and is consistently using old support as the basis of new resistance as the retracement back to 60.71 continues. After the breakdown in April below the consolidation range low at 66.70, the bears have used this old support as the basis of the limit for rallies and now we are seeing the next near term support at 64.60 coming under increasing pressure. Although a late bounce saved it from confirming the move, a closing breakdown would open for further downside towards 62.25. Also the fact that the pair is now trading well clear of the 76.4% Fibonacci retracement of 60.71/85.97 at 66.67 suggests that the bears are in control for a full retracement. Momentum indicators also confirm the outlook for using any rallies as a chance to sell, with the RSI firmly in negative configuration and also showing further downside potential in the current move. The hourly chart shows resistance in the band 64.90/66.00 gives a chance to sell.
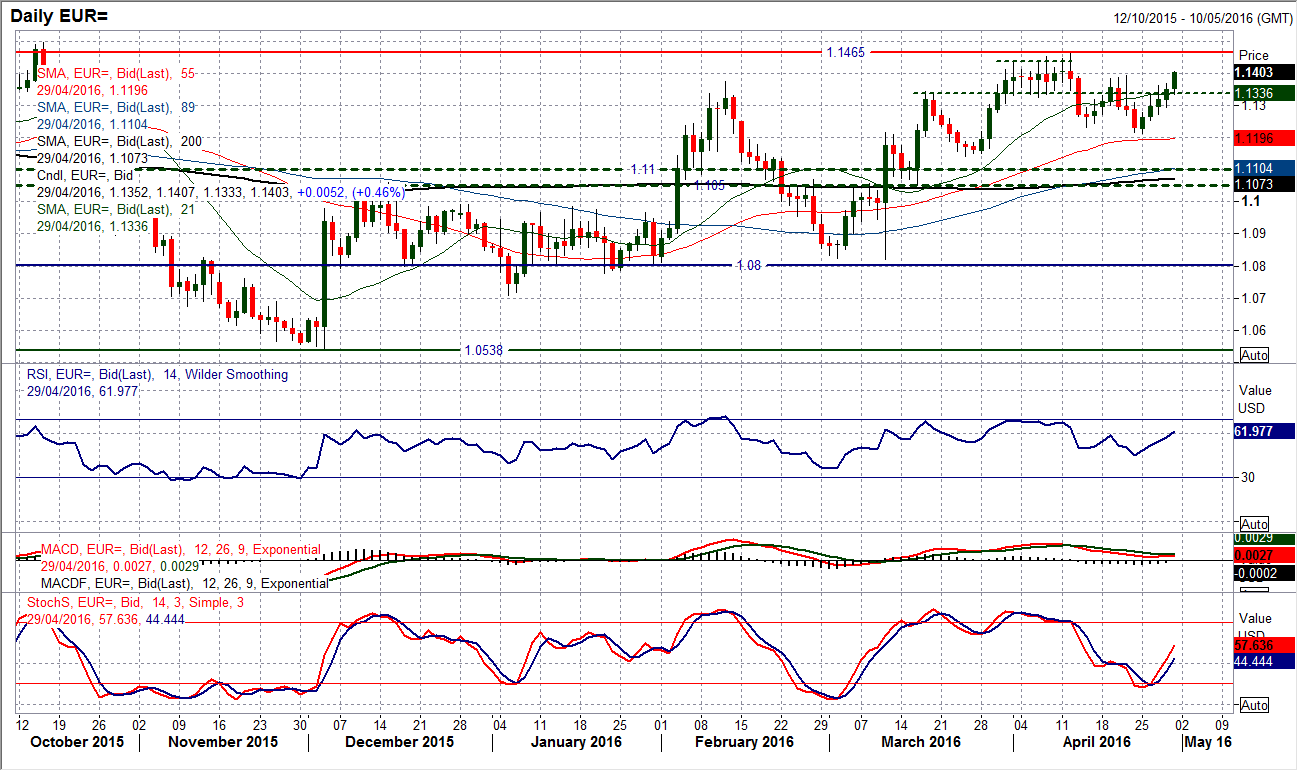
EUR/USD
The rally on the euro has now completed a fourth consecutive solidly positive candle and shows little sign of stopping for now. The rebound from $1.1215 has rallied to close through the near term resistance around $1.1330 and strong gains overnight have taken the euro to challenge the mid-April key lower high at $1.1395. The bulls seem to be increasingly in control and momentum indicators are confirming the improvement with the RSI back above 60 and the Stochastics rising positively now. A close above $1.1395 today would put the bulls in prime position for a test of $1.1465 (remarkable considering the mildly hawkish lean in the FOMC statement). I still expect the long term range to remain intact, however it will be interesting to see how serious the bulls are in this latest rally. The hourly chart shows positive configuration on momentum and intraday corrections being bought into. There is now support at $1.1310 from yesterday’s low, whilst the $1.1330 level is becoming a pivot.
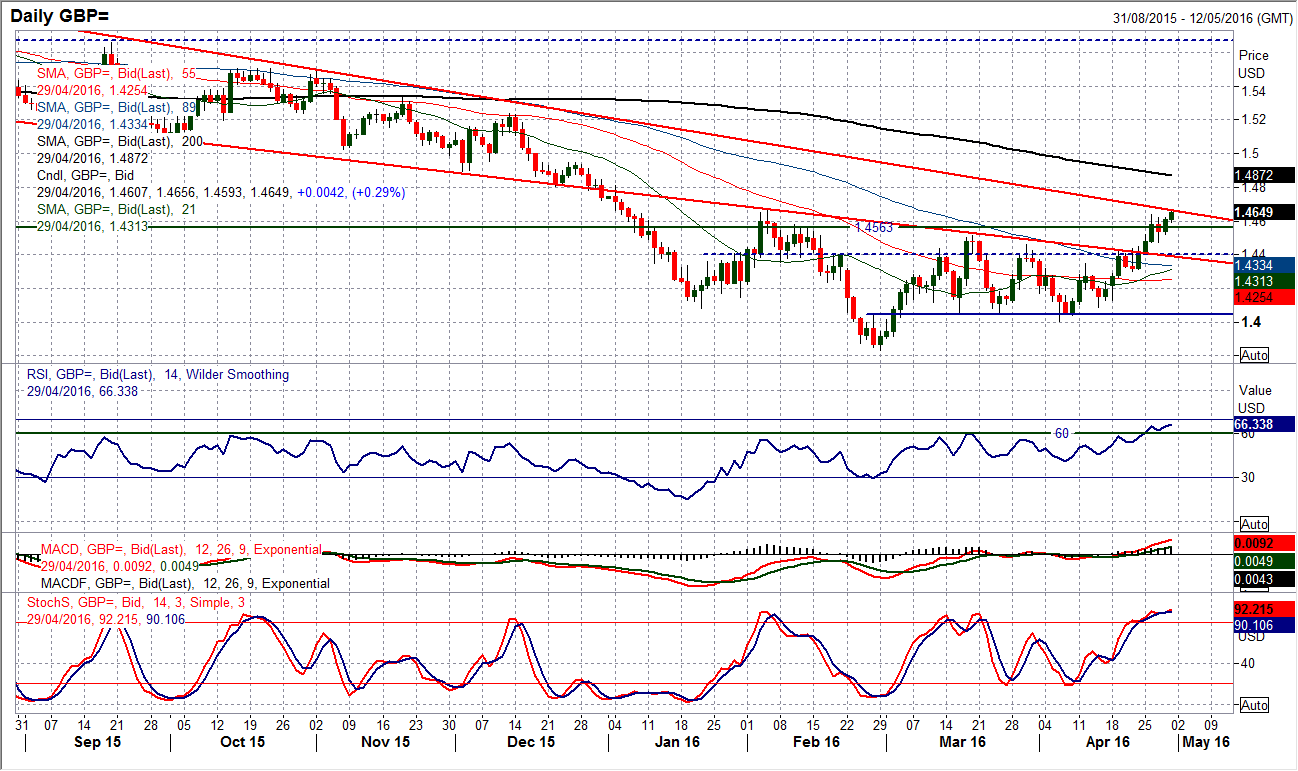
GBP/USD
Sterling continues to make ground towards what would be a significant medium term breakout as the February high at $1.14670 comes under further pressure. A breakout would complete a base pattern (inverted head & shoulders with a slanting neckline) that could imply a move back to $1.5250 on a conservative basis. Also interestingly the rally is testing the resistance of a downtrend that has been in place since August 2015. The next resistance comes in the band $1.4800/$1.4950. The momentum indicators continue to reflect the strengthening momentum with the RSI consistently above 60 and now the highest since June 2015. The hourly chart shows consistent use of old breakout levels being new support with the latest at $1.4520, but also that there is a band of support now $1.4520/$1.4640 to use as a basis on any unwinding correction today. Near term corrections continue to be bought into.
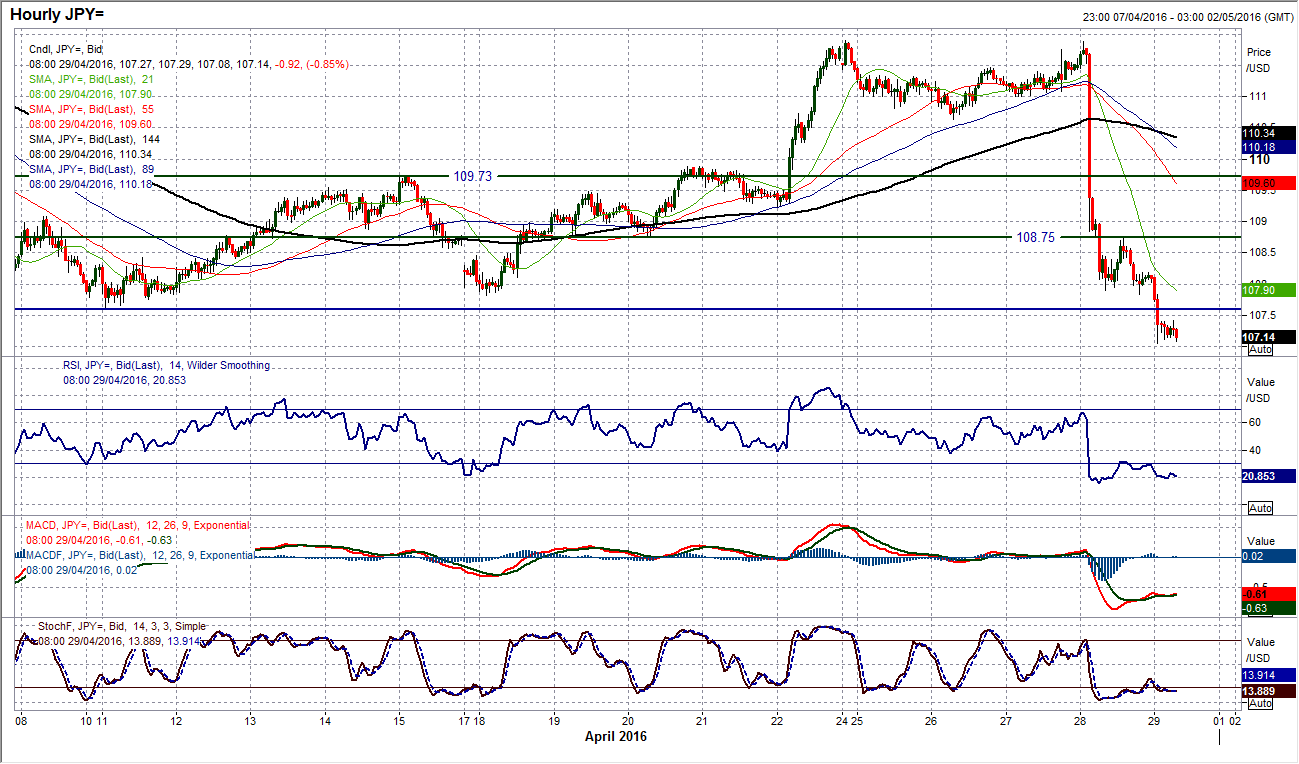
USD/JPY
What a huge bearish candle that we had posted yesterday. With 400 pips of daily range, the pair closed around 340 pips lower on the day. However the move has not stopped yet and the selling pressure has continued overnight to breach the old April low at 107.60 to reach levels not seen since October 2014 again. The medium term downside target of the February/March range at 107.10 has now been achieved and potential targets now become the long term huge head & shoulders top implied move of 105.20 which was also a key support from 2014. Momentum indicators are bearish again (that almost goes without saying) but also there is a Stochastics sell signal, whilst all three of my momentum indicators that I follow also show further downside potential in this move. The hourly chart shows there are some near term resistances in place with the consolidation around 108.00 to be watched on a bounce and 108.70 which is an old pivot. The bears are fully in control.
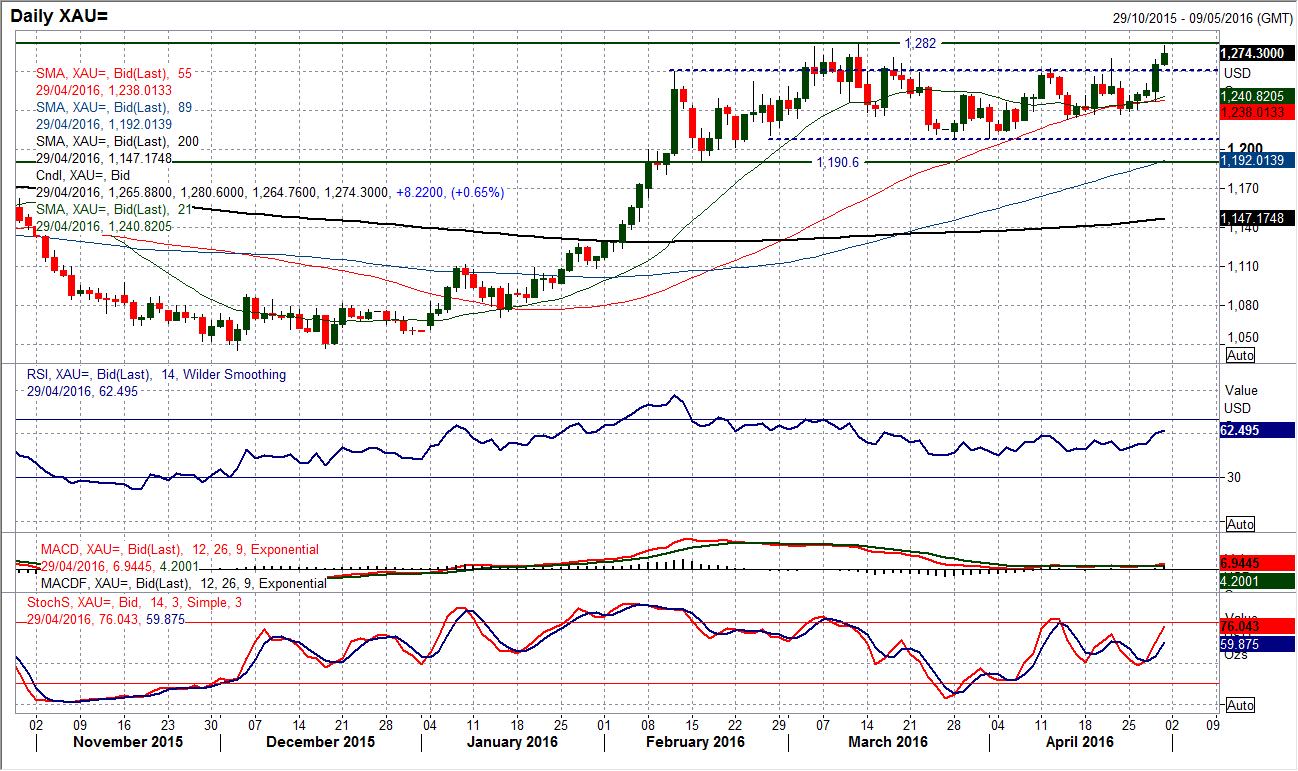
Gold
Finally there is some traction building on gold but can it sustain for the breakout? The strong bullish candle posted yesterday added $21 on the day and resulted in the highest closing price since early March. The RSI confirms the improvement, also moving to a 7 week high and above 60 which would reflect increasingly positive momentum. The key resistance is $1282.50 which was the early March peak and already overnight as the bulls have continued their push there has been an initial test of this level with the bulls backing off at $1280.60 and a consolidation is now forming as the European session takes over. The hourly chart shows strong momentum that is a touch stretched near term but any unwinding would look to build support in the $1262/$1270 band. I retain my bullish bias on gold but would be surprised if there were to be a breakout here above $1282.50. If there were, the next resistance band comes in around $1300 with $1306 the key reaction high from January 2015.
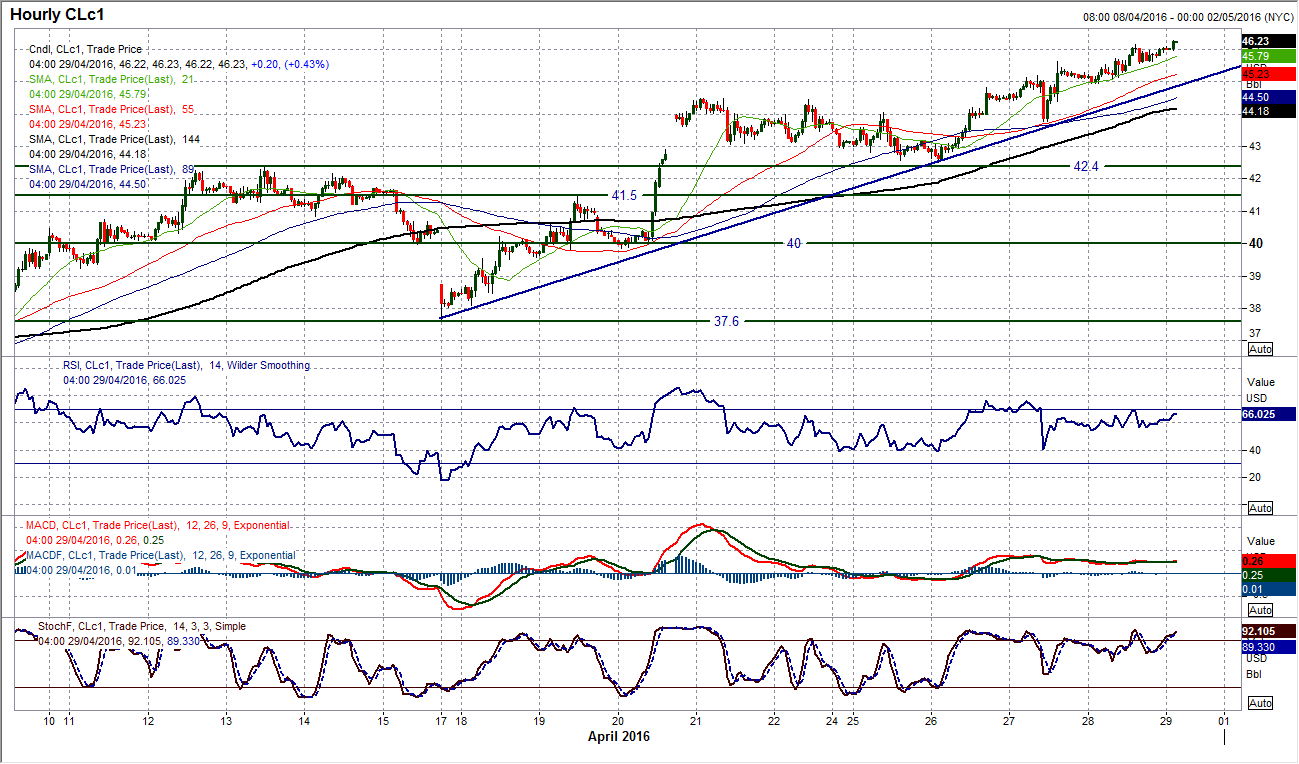
WTI Oil
The gains in oil continue to come with the price again pushing to levels not seen since November. The bulls remain in control but the RSI at 69 would suggest that perhaps immediate upside potential is becoming limited. The RSI twice hit this level in March just prior to corrections. Near term pullbacks continue to be seen as a chance to buy again and I have no doubt that this would continue. The support to look out for is at $42.40 which was the basis for this week’s low. The hourly chart continues to show an 9 day uptrend intact around $44.60, whilst the hourly RSI continues to find support around 40 before the buyers return again. Initial near term support is at $43.75, whilst the next resistance is not until the November high at $48.35.
Note: All information on this page is subject to change. The use of this website constitutes acceptance of our user agreement. Please read our privacy policy and legal disclaimer. Opinions expressed at FXstreet.com are those of the individual authors and do not necessarily represent the opinion of FXstreet.com or its management. Risk Disclosure: Trading foreign exchange on margin carries a high level of risk, and may not be suitable for all investors. The high degree of leverage can work against you as well as for you. Before deciding to invest in foreign exchange you should carefully consider your investment objectives, level of experience, and risk appetite. The possibility exists that you could sustain a loss of some or all of your initial investment and therefore you should not invest money that you cannot afford to lose. You should be aware of all the risks associated with foreign exchange trading, and seek advice from an independent financial advisor if you have any doubts.
Recommended Content
Editors’ Picks
EUR/USD holds gains above 1.0700, as key US data loom

EUR/USD holds gains above 1.0700 in the European session on Thursday. Renewed US Dollar weakness offsets the risk-off market environment, supporting the pair ahead of the key US GDP and PCE inflation data.
GBP/USD extends recovery above 1.2500, awaits US GDP data

GBP/USD is catching a fresh bid wave, rising above 1.2500 in European trading on Thursday. The US Dollar resumes its corrective downside, as traders resort to repositioning ahead of the high-impact US advance GDP data for the first quarter.
Gold price edges higher amid weaker USD and softer risk tone, focus remains on US GDP

Gold price (XAU/USD) attracts some dip-buying in the vicinity of the $2,300 mark on Thursday and for now, seems to have snapped a three-day losing streak, though the upside potential seems limited.
XRP extends its decline, crypto experts comment on Ripple stablecoin and benefits for XRP Ledger

Ripple extends decline to $0.52 on Thursday, wipes out weekly gains. Crypto expert asks Ripple CTO how the stablecoin will benefit the XRP Ledger and native token XRP.
US Q1 GDP Preview: Economic growth set to remain firm in, albeit easing from Q4

The United States Gross Domestic Product (GDP) is seen expanding at an annualized rate of 2.5% in Q1. The current resilience of the US economy bolsters the case for a soft landing.