Market Overview
Markets sentiment has taken a more cautious tone once more as it seemed that Wall Street finally took on board the implications that a strong Non-farm Payrolls report could have on their supply of cheap money. The second part of the equation in the past few months has always been how China has been performing too and overnight, we had the latest inflation data which continues to suggest that the slowdown is ongoing. The China inflation data for both CPI (consumers) and PPI (at the factory gate) were both lower than expected and this could weigh on sentiment today. CPI missed estimates with +1.3% (1.5% exp) and PPI was once more at -5.9%. These do not bode well for the continued decline in growth and trade numbers. Tomorrow’s industrial production and retail sales for China will take on even more importance now and as continued deterioration could drive a flight to safety once more.
So far though, in spite of a 1% decline on the S&P 500 last night, the Asian markets have been fairly stable in their close, with both Shanghai and the Nikkei broadly flat. The European markets are also set to open mildly positive, but again it will be interesting to see if this can last in light of the prospect of a US rate hike and also a slowing China. There is a lack of direction in forex markets for the handover from the Asian to the European session, whilst there has been a slight degree of support for commodity markets such as gold and oil.
Once again there is little for traders to get too interested from an economic data perspective, so it will be interesting to see if the continued weakness in China inflation filters through into a flight towards the safer havens and curtails risk apetite.
Chart of the Day – NZD/USD
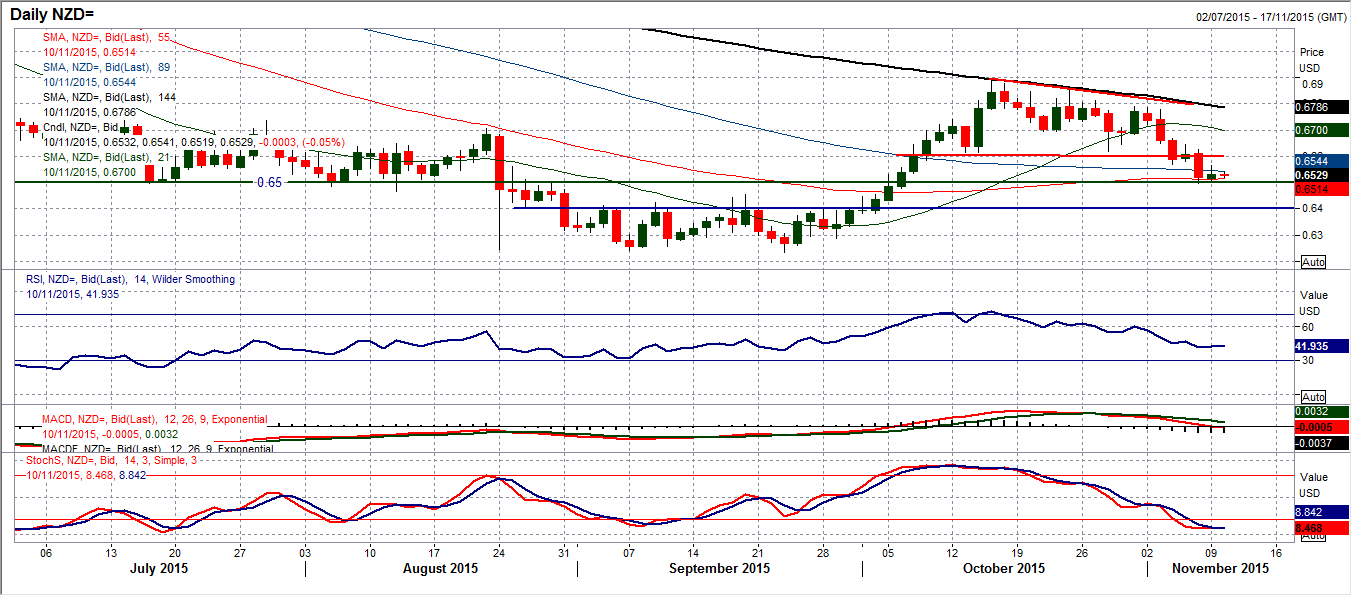
I spoke about the Kiwi forming a head and shoulders top last week and the pattern continues to develop with the bears in control. The downside break of the neckline at $0.6615 completed the pattern which has also now been confirmed by subsequent closing levels below the neckline. Friday’s sharp bear candle has been followed by a small bounce but this should be seen as another chance to sell. The momentum indicators continue to reflect a corrective outlook with the RSI and MACD lines in decline and the Stochastics in bearish configuration. There is some basis of support around $0.6500 which is currently being negotiated but now intraday rallies should still be seen as a chance to sell with the pattern downside target back at $0.6335. The intraday hourly chart shows the consistent lower highs, falling moving averages and bearish configuration on the momentum indicators. Look to possibly use the hourly RSI as a selling gauge as the unwinding moves tend to fizzle out around 60. There is resistance initially at $0.6565 and then more importantly in a band around the neckline $0.6615 towards $0.6650. A breach of $0.6495 would re-open the downside.
EUR/USD
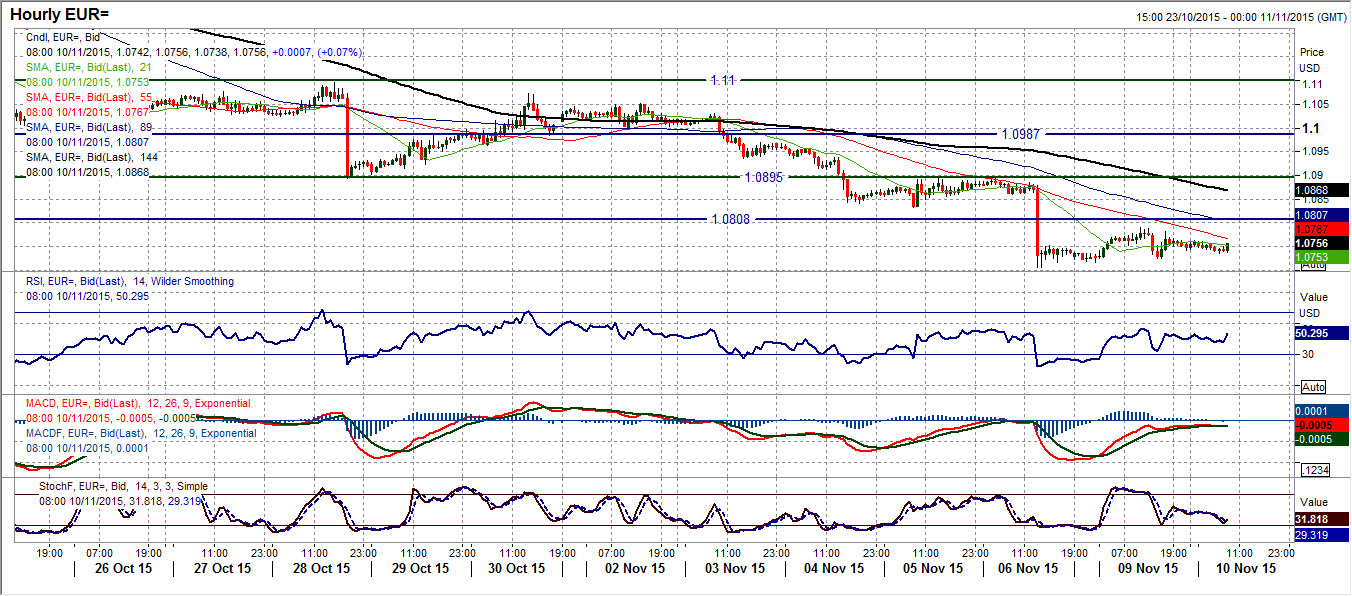
Following the sharp downside break in the wake of the payrolls report yesterday was always going to be interesting to gauge the appetite for a rally. Usually you would find if the bulls feel there is something there for them, the reaction will be fairly quick. However, yesterday’s daily candle was rather indecisive and showed a lack of appetite. This confirms the bearish breakdown of $1.0810 and keeps the dollar bulls (ie. bears of EUR/USD) in control. Momentum indicators remain negatively configured and rallies should be seen as a chance to sell. The ideal selling area would be around the old support at $1.0810 which is now the new basis of resistance but with yesterday’s high at $1.0790, have we already seen the reaction high? The intraday hourly chart still shows the resistance band extends towards $1.0895, whilst hourly momentum indicators are configured very bearishly now. I continue to expect that rallies will be sold into and a retest of Friday’s low at $1.0705 will be seen prior to further downside. Next support is $1.0660.
GBP/USD
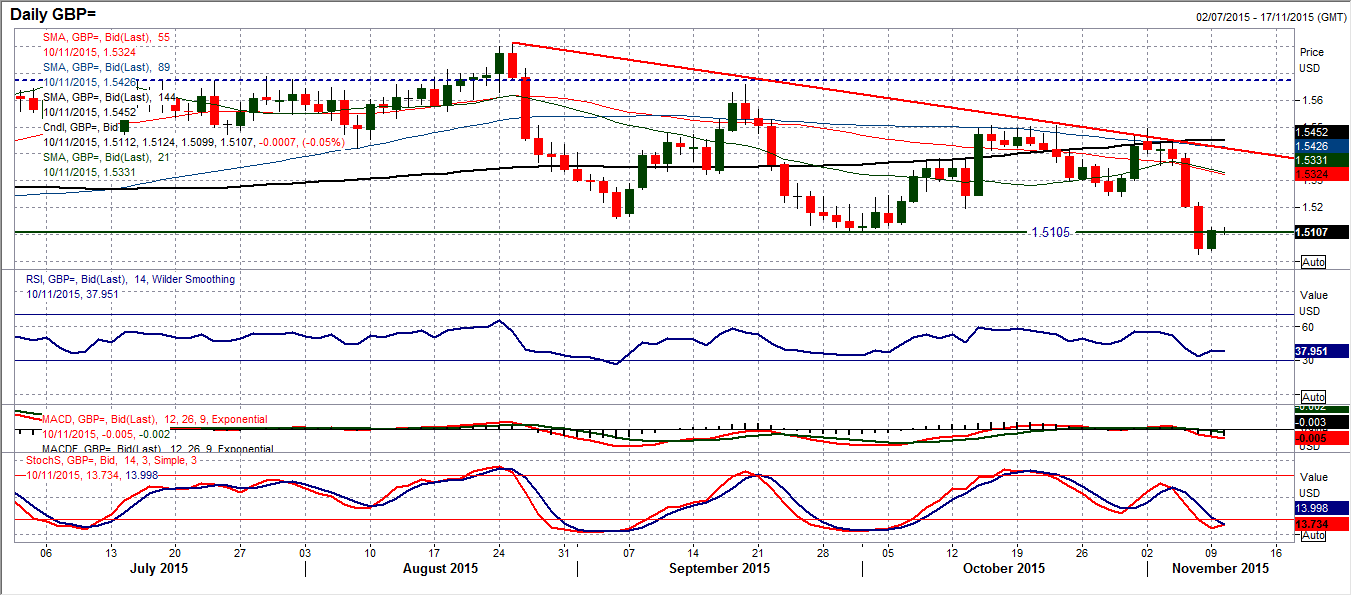
I spoke yesterday about the prospect of a rally being used as a chance to sell. The reaction from the Sterling bulls has been fairly positive (or at least more so than on other major dollar pairs) and this has formed a strong green (bull) candle on the daily chart. It is interesting though that the rebound found the resistance around the old support (which is the new basis of resistance) around $1.5105. As I said previously there is resistance up towards $1.5150 (which was just prior to the announcement of the strong payrolls report) and up towards $1.5200 giving around 100 pips band of resistance in all to work with. I see this as where the bears will use a rally as a chance to sell. The momentum indicators are bearishly configured and reflect this too. The intraday hourly chart shows that the move has already been unwound and that we should now be on the lookout for the next sell signal. Support from Friday’s low at $1.5023 is likely to come under renewed pressure in due course.
USD/JPY
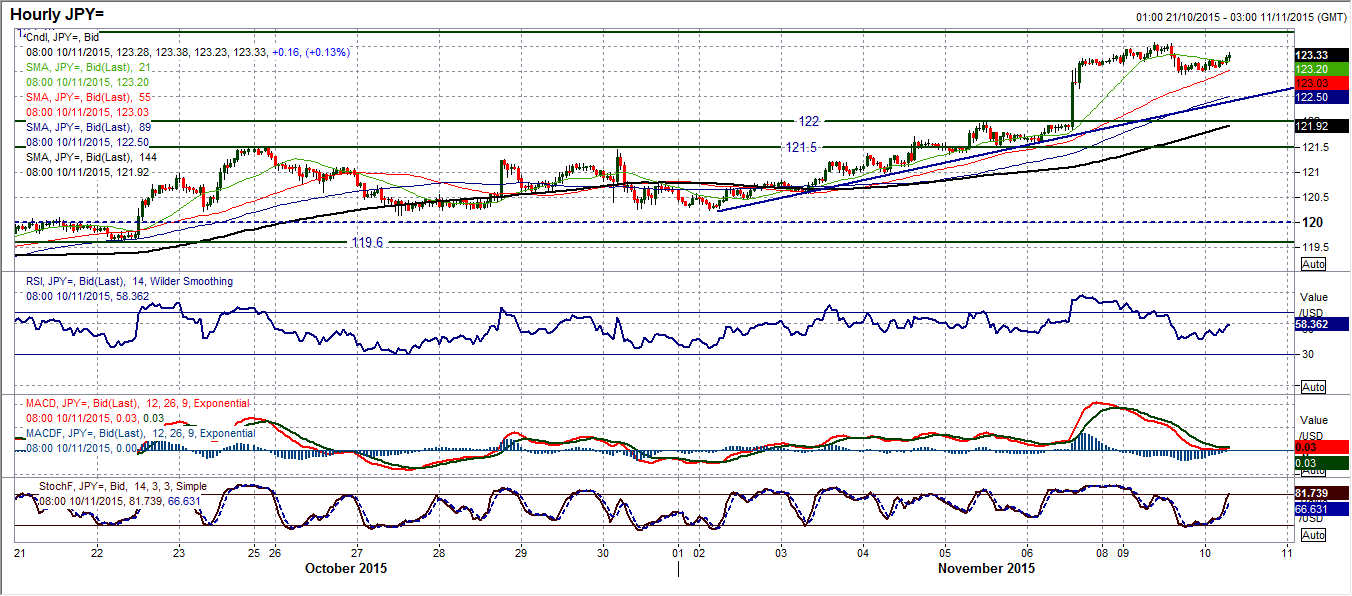
Calling immediate direction on Dollar/Yen could be a touch tricky as the breakout above 121.70 is strong and although it implies a minimum target of 123.85 (maximum implied of 125.20), the momentum is looking a bit stretched now. Yesterday’s candle was a “doji” reflecting uncertainty but there is still support up at these levels. There is an element of consolidation around the 76.4% Fibonacci retracement level of the 125.28/116.46 sell-off at 123.20 but the bulls are not willing to let this go quite yet. The fact that when this pair breaks out, it tends to trend strongly, should be seen as a strong bull argument. The intraday hourly chart shows a 6 day uptrend which currently comes in around 122.40 but with hourly momentum indicators positive and unwound following this consolidation there is room for further upside and a retest of yesterday’s high at 123.60. There is good support 121.50/122.00.
Gold
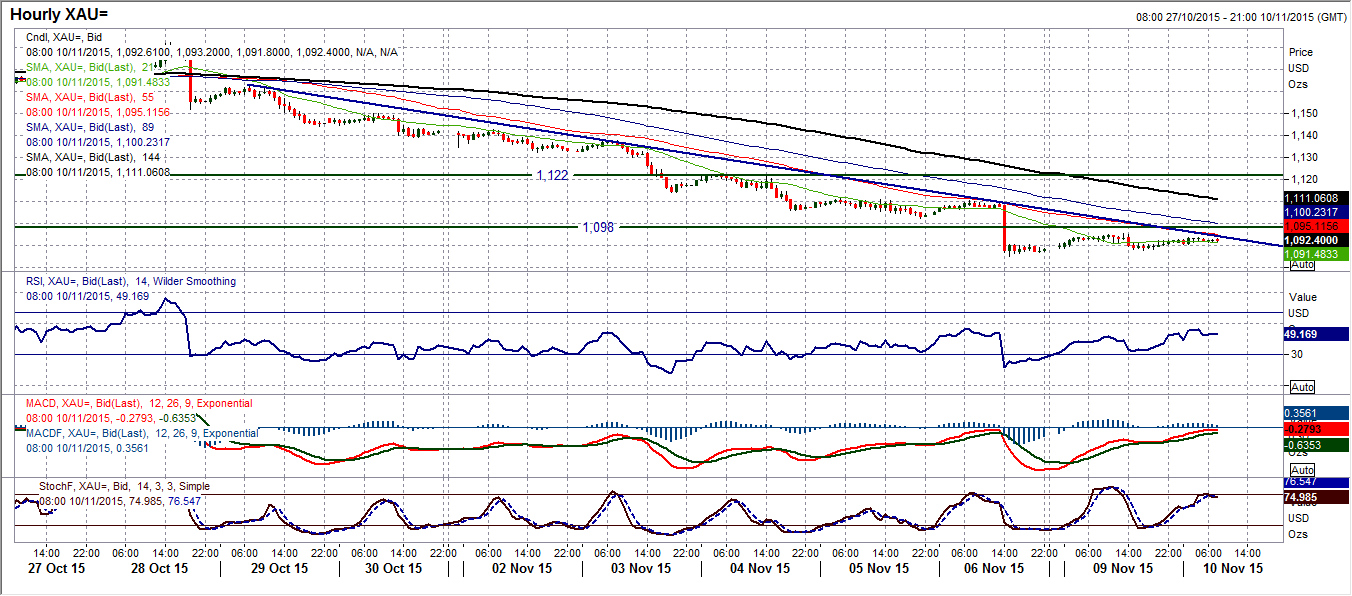
Finally something for the bulls to hang on to, albeit a small amount of hope. After 8 strong bear candles on the daily chart, finally the intraday rebound has held on throughout the session and a green candle has been left. This is a minor victory for the gold bugs but there is a lot more they need to achieve and for now the outlook has to remain one of selling into strength. Momentum indicators remain strongly bearish and it is difficult to see any rebound as anything more than simply counter to the bearish medium term outlook now. The old support band $1098/$1104 is now a basis of resistance and I would still expect further weakness for a test of the $1077 key 2015 lows. The intraday hourly chart shows an 8 day downtrend intact and that hourly momentum indicators remain strong in their bearish configuration and that rallies continue to be seen as a chance to sell. There is further resistance at $1111 and $1122.
WTI Oil
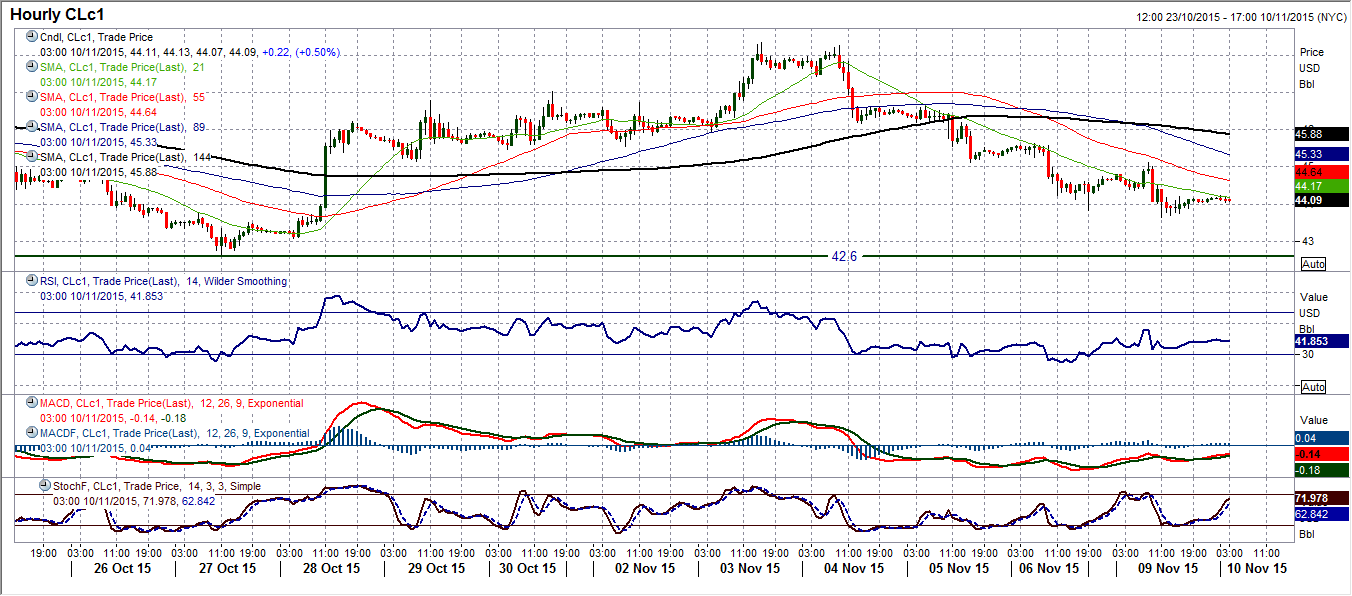
A fourth consecutive bearish candlestick on the daily chart containing a close towards the low of the day is becoming a real concern for the crucial support of the 10 week trading band. The key lows now in at $42.60/$43.20 are now within touching distance for today. However, the momentum indicators are not drastically bearish and do not really suggest an imminent breakdown. Looking at the hourly chart the past few days have shown a series of lower highs and lower lows and this should be monitored now. Yesterday’s low at $43.65 is key today as if the bulls can hang on to this support the prospect of another low within the range can be contemplated. However intraday hourly momentum is rather weak at this stage and there will need to be some strength shown today to prevent this weakness continuing. Key near term resistance is now yesterday’s high at $45.12.
Note: All information on this page is subject to change. The use of this website constitutes acceptance of our user agreement. Please read our privacy policy and legal disclaimer. Opinions expressed at FXstreet.com are those of the individual authors and do not necessarily represent the opinion of FXstreet.com or its management. Risk Disclosure: Trading foreign exchange on margin carries a high level of risk, and may not be suitable for all investors. The high degree of leverage can work against you as well as for you. Before deciding to invest in foreign exchange you should carefully consider your investment objectives, level of experience, and risk appetite. The possibility exists that you could sustain a loss of some or all of your initial investment and therefore you should not invest money that you cannot afford to lose. You should be aware of all the risks associated with foreign exchange trading, and seek advice from an independent financial advisor if you have any doubts.
Recommended Content
Editors’ Picks
EUR/USD holds gains above 1.0700, as key US data loom

EUR/USD holds gains above 1.0700 in the European session on Thursday. Renewed US Dollar weakness offsets the risk-off market environment, supporting the pair ahead of the key US GDP and PCE inflation data.
GBP/USD extends recovery above 1.2500, awaits US GDP data

GBP/USD is catching a fresh bid wave, rising above 1.2500 in European trading on Thursday. The US Dollar resumes its corrective downside, as traders resort to repositioning ahead of the high-impact US advance GDP data for the first quarter.
Gold price edges higher amid weaker USD and softer risk tone, focus remains on US GDP

Gold price (XAU/USD) attracts some dip-buying in the vicinity of the $2,300 mark on Thursday and for now, seems to have snapped a three-day losing streak, though the upside potential seems limited.
XRP extends its decline, crypto experts comment on Ripple stablecoin and benefits for XRP Ledger

Ripple extends decline to $0.52 on Thursday, wipes out weekly gains. Crypto expert asks Ripple CTO how the stablecoin will benefit the XRP Ledger and native token XRP.
US Q1 GDP Preview: Economic growth set to remain firm in, albeit easing from Q4

The United States Gross Domestic Product (GDP) is seen expanding at an annualized rate of 2.5% in Q1. The current resilience of the US economy bolsters the case for a soft landing.
