Market Overview
The reaction on the markets to the significantly disappointing Non-farm Payrolls report has been intriguing. The initial weakness in sentiment and safe haven flows (yen, euro, Treasuries, Bunds) have retraced their spikes and sentiment has improved. The decline on the Baker Hughes rig count in the US helped to pull the oil price higher and this helped market sentiment. Sentiment also seems to have improved amid the dovish implications of the payrolls report and the impact it could have on the Federal Reserve’s monetary policy. The service sector PMIs are due today and amid the improved market sentiment it will be interesting to see if bad news is still good for markets. The selling pressure was countered by the buyers into the close and Wall Street closed strongly higher. So coming into Monday, the Asian markets have followed the lead from Wall Street and are all higher, whilst European markets are also stronger as they play catch up on the US turnaround.
The outlook on Forex markets is decidedly mixed. Payrolls will always tend to have a volatile impact but the seemingly unambiguously bad payrolls report has had traders questioning the direction of the Fed now. Traders are scratching their heads but there has been a slight improvement in risk moving into Monday morning, with the euro and sterling higher, whilst the commodity currencies are also stronger against the dollar. The gold price is also giving back some of its gains from Friday, whilst the oil price has continued to bounce.
Traders will be looking out for the service sector PMIs today as their main driver of direction. The European numbers are out early, with the Eurozone data at 0900BST expected to be 54.0 and the UK data at 0930BST and an expectation of an improvement to 56.0 (from 55.6). The US ISM Non-Manufacturing PMI is due at 1500BST and is expected to drop to 57.7 from 59.0.
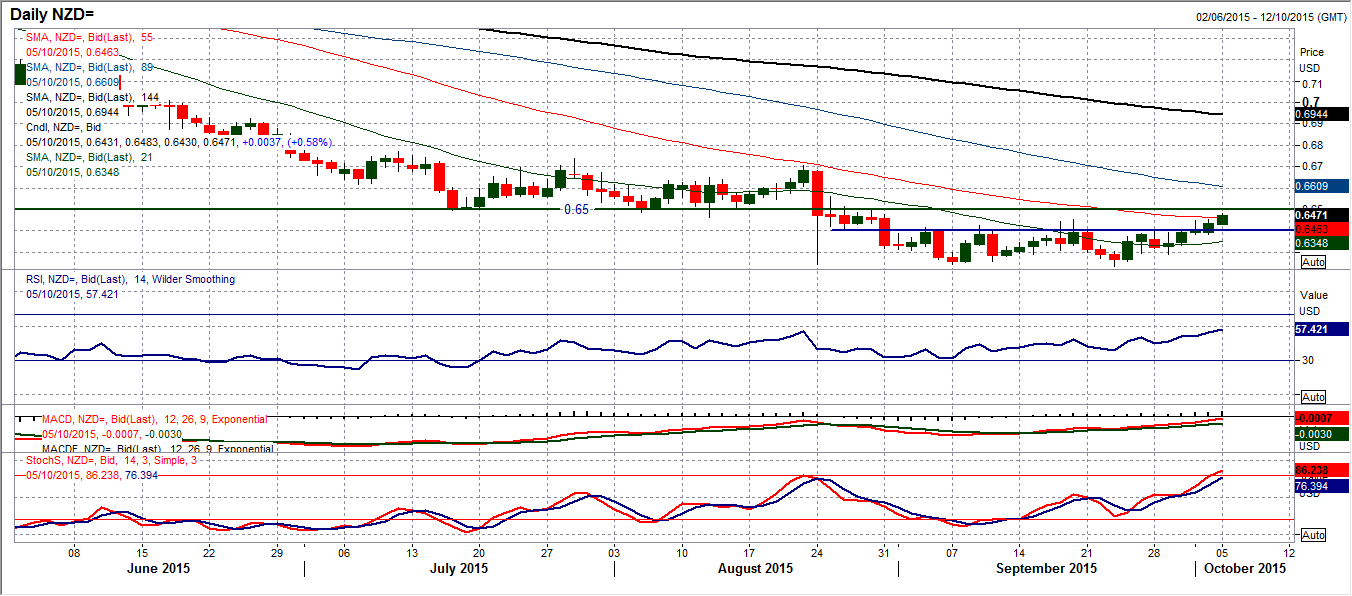
Chart of the Day – NZD/USD
Momentum on the Kiwi has been improving for the past few weeks and now a near term close above $0.6400 which is a 5 week closing high suggests the outlook is improving. However there is still much to be done as it now takes the Kiwi into 100 pips of resistance that will be key to the near term outlook. Interestingly the RSI is now up at a 5 month high as momentum has improved. However, once more there is more to be done, as previously within the long term downtrend the RSI has been failing around the 60 mark, (currently just below) whilst the MACD lines are still medium term negatively configured below the neutral line. This resistance up at $0.6500 will be a crucial test in the coming days and it needs at least a close above it to be a stamp of approval for the bulls ad would open the next resistance comes in at between $0.6705/$0.6740. The hourly chart shows a band of support now $0.6380/$0.6450. There is more to be done, but the Kiwi bulls are looking in their strongest position for months.
EUR/USD
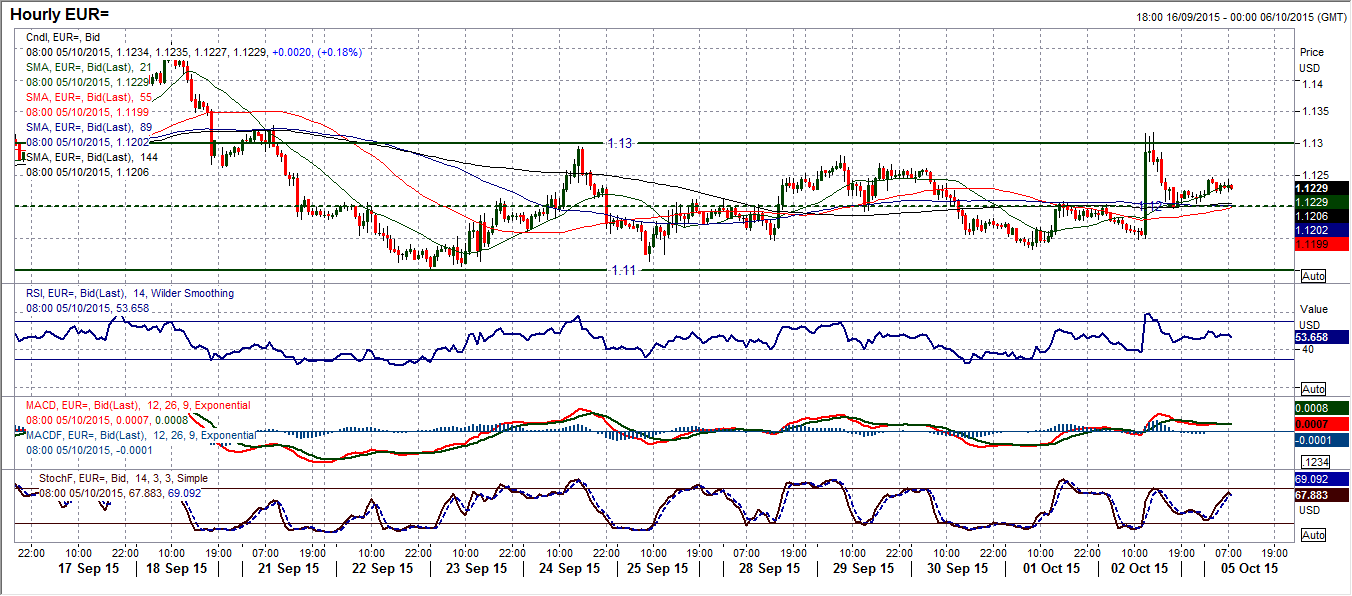
In the wake of the Non-farm Payrolls report the euro picked up significantly. However the bulls could now sustain the move and a very neutral but volatile looking candle has been left, with not a great deal having been achieved. There was a brief spike above the resistance at $1.1295 however the bulls could not hold on to this move and the drift back into the near two week trading band $1.1100/$1.1295 to leave traders again needing more.. The momentum indicators do not show a neutral configuration and on a daily basis there is little real direction indication. A close above $1.1295 would open the upside back towards the medium term range resistance at $1.1465 but until this is seen the only real strategy is to play the 200 pip range. The intraday hourly chart is also reflective of this and there is a pivot level at $1.1200 that can be used as a gauge for sentiment within the range. Oerall we are still waiting for a breakout and decisive direction and until this is seen the time horizon on trades will need to be rather short term.
GBP/USD
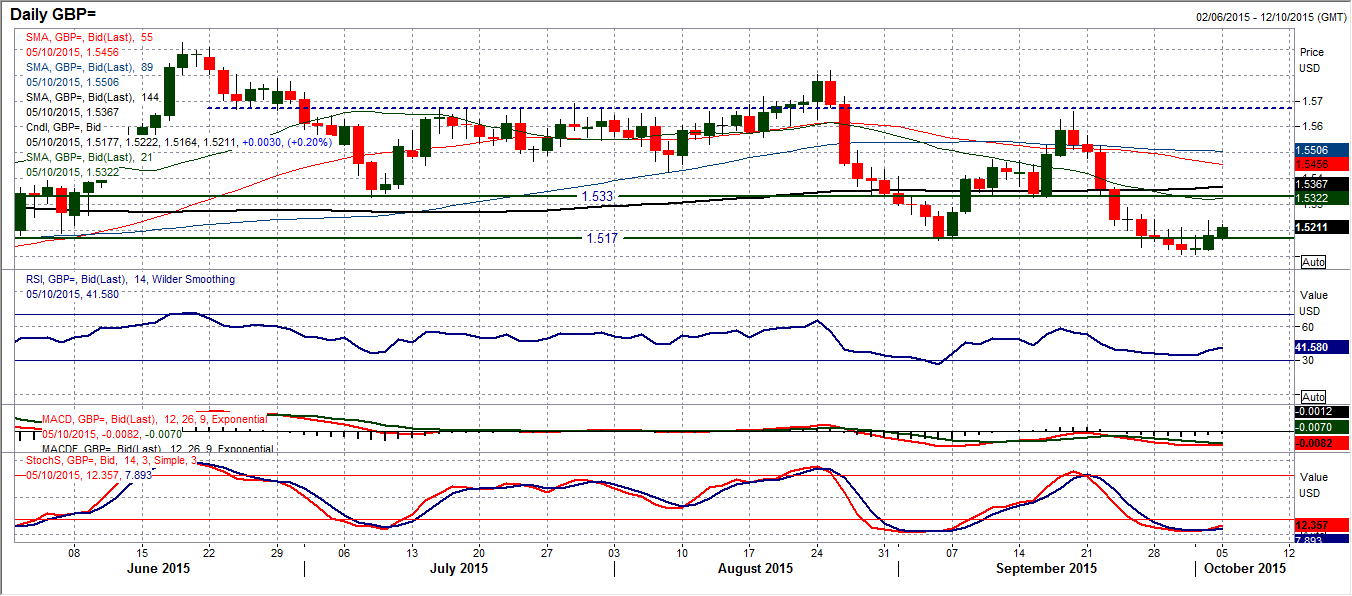
After talking about it throughout last week perhaps now Cable has turned the corner? After 9 consecutive days of decline, a doji candle followed by a positive bull candle shows that the momentum is turning the other way again. The daily momentum is improving with a Stochastics buy signal (not confirmed yet) and the RSI moving higher. We must look at the intraday hourly chart for the confirmation of a turn around, which has not quite been achieved yet. I have spoken much about the near term resistance at $1.5240 and this was the limit of the Non-farm Payrolls jump on Friday (to a high of $1.5237), so this resistance as yet remains intact. I am though encouraged by the improvement in the momentum indicators with the hourly RSI, Stochastics and MACD lines all far more positively configured now. A decisive push above $1.5240 would complete a small bottoming process, implying a move towards $1.5370. The resistance at $1.5290 and then at $1.5330 would come next. The hourly chart also shows the reaction low at $1.5165 from late on Friday is the initial support which will protect a retreat back towards the low at $1.5105. The outlook is though improving again.
USD/JPY
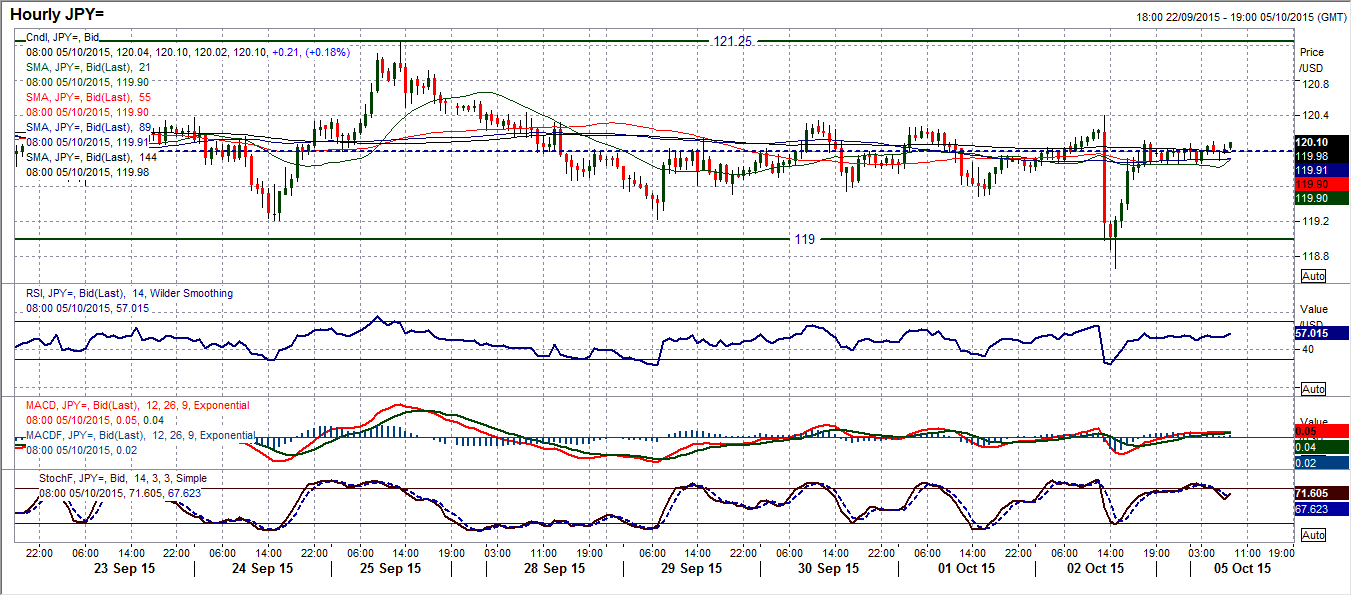
The reaction following the Non-farm Payrolls report was incredible on Friday. Anyone looking on their line charts would be forgiven for wondering what all the fuss was about, but there has been yet another long shadow candle with an incredible small body. This all suggests the market does not know how to be positioned. The spike low at 118.65 means that there is a new support in place but essentially we are back to where we were and the charts are suggesting we are none the wiser. Neither the daily nor hourly charts can give any decisive indication of the next move within the range, let alone the direction of a breakout. The fact that the pair rebounded to trade around the minor pivot level at 120.00 is reflective of the uncertainty. The length of the shadow of Friday’s candle suggests there is a slight bearish bias now, but this is certainly nothing to put your house on. There is minor resistance at 120.30, whilst we are back into the strategy of playing the RSI extremes once again for trade signals as this range continues. The new range is 118.65/121.30.
Gold
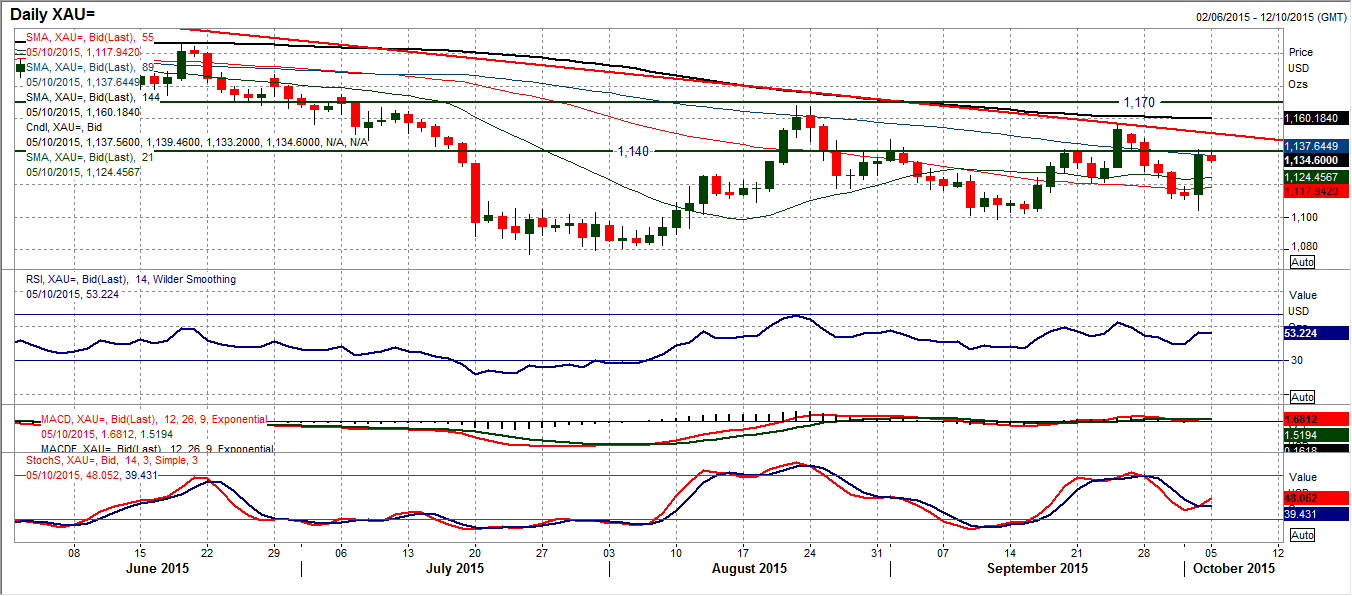
Gold tends to be very reactive to the Payrolls report and Friday’s move was now exception. However I still see near term rallies as corrective within the longer term bear trend and should be viewed as a chance to sell. The long term downtrend (dating back to October 2012) comes in around $1151 today and is still a significant overhead barrier. The huge bullish key one day reversal is clearly a significantly positive candle on the daily chart. However whether it is a game changing candle remains to be seen. The resistance coming in at $1141.50 on Friday has started to see the rally already roll over. The reaction of today’s trading could be key as you would want the buying pressure to continue today but the early slide in the Asian session could reflect a rally that’s gone too far and the profit takers are moving in. if the unwinding phase today can quickly form support then the bulls have got a chance, but the second day following such a strong candle will often be about a retracement, especially when the buyers are not in control. Support comes in around $1126 and more importantly at $1121.
WTI Oil
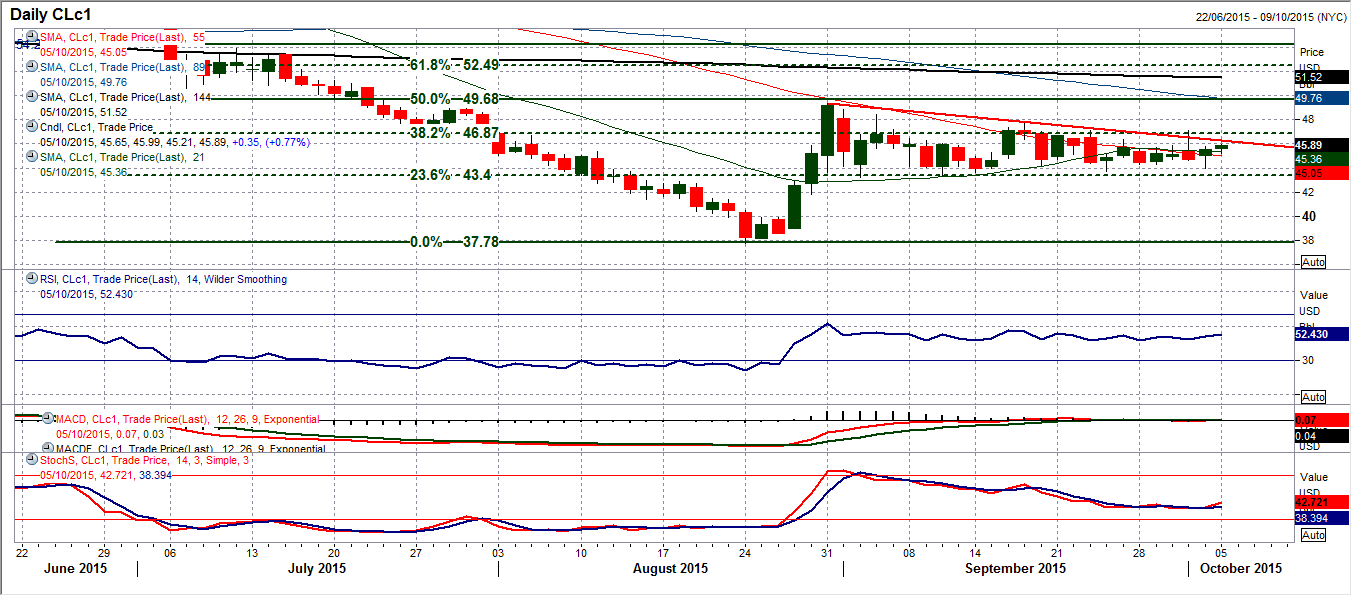
The weak payrolls report was a drag on the oil price however, once more there seems to be a strength to the support band above $43.20 as the intraday recovery into the close on Friday has left a reasonably positive candle. This has been followed up today by further gains which is once more looking to neutralise the outlook. There is an interesting test though closing in as within the 5 week range there is a downtrend which is gradually pulling lower highs, the latest one from Thursday at $45.17. If this again comes in today then there could be a resumption of the pressure back on the key support at $43.20. Perhaps the hourly chart will be able to give an early signal. The momentum has been neutral and rangebound for several weeks as measured on the RSI, with moves towards 30 consistently being seen as a chance to sell. However if the RSI starts to consistently remain below 30 this would be reflective of increasingly bearish momentum.
Note: All information on this page is subject to change. The use of this website constitutes acceptance of our user agreement. Please read our privacy policy and legal disclaimer. Opinions expressed at FXstreet.com are those of the individual authors and do not necessarily represent the opinion of FXstreet.com or its management. Risk Disclosure: Trading foreign exchange on margin carries a high level of risk, and may not be suitable for all investors. The high degree of leverage can work against you as well as for you. Before deciding to invest in foreign exchange you should carefully consider your investment objectives, level of experience, and risk appetite. The possibility exists that you could sustain a loss of some or all of your initial investment and therefore you should not invest money that you cannot afford to lose. You should be aware of all the risks associated with foreign exchange trading, and seek advice from an independent financial advisor if you have any doubts.
Recommended Content
Editors’ Picks
AUD/USD remained bid above 0.6500

AUD/USD extended further its bullish performance, advancing for the fourth session in a row on Thursday, although a sustainable breakout of the key 200-day SMA at 0.6526 still remain elusive.
EUR/USD faces a minor resistance near at 1.0750

EUR/USD quickly left behind Wednesday’s small downtick and resumed its uptrend north of 1.0700 the figure, always on the back of the persistent sell-off in the US Dollar ahead of key PCE data on Friday.
Gold holds around $2,330 after dismal US data

Gold fell below $2,320 in the early American session as US yields shot higher after the data showed a significant increase in the US GDP price deflator in Q1. With safe-haven flows dominating the markets, however, XAU/USD reversed its direction and rose above $2,340.
Bitcoin price continues to get rejected from $65K resistance as SEC delays decision on spot BTC ETF options

Bitcoin (BTC) price has markets in disarray, provoking a broader market crash as it slumped to the $62,000 range on Thursday. Meanwhile, reverberations from spot BTC exchange-traded funds (ETFs) continue to influence the market.
US economy: slower growth with stronger inflation

The dollar strengthened, and stocks fell after statistical data from the US. The focus was on the preliminary estimate of GDP for the first quarter. Annualised quarterly growth came in at just 1.6%, down from the 2.5% and 3.4% previously forecast.
