Market Overview
The bulls lost control yesterday afternoon and a deterioration in market sentiment has ensued as the market volatility continues. Bond markets were a big driver of this as yields on US Treasuries fell away, with equities also closing sharply weaker in the US. Furthermore, the oil price is increasingly under pressure once more, still seemingly acting as a barometer for market sentiment. These moves have been compounded by disappointing data out of both China and Japan which has sent Asian equities sharply weaker overnight. Chinese inflation data showed a higher than expected CPI to 2.0% (1.8% expected) but the concern is that the PPI fell to -5.9% which was much weaker than -5.5% that had been expected. The PPI is a concern as it shows the deflationary forces on the corporate sector and a concern for the continue slowdown in China. Added to this, Japanese machinery orders fell sharply, all of which has left the Nikkei 225 2.5% lower. European markets are also under pressure early on today.
In the forex markets the Kiwi dollar is sharply weaker by over 100 pips after the Reserve Bank of New Zealand cut rates by 25 basis points, even though the move had been widely expected. The Aussie dollar is holding up well though after Australian unemployment showed a slight improvement in the claimant count (although the headline rate was in line with expected at 6.2%. Elsewhere amongst the major pairs trading is largely indecisive although the yen is weaker once more after the disappointing machinery orders.
Traders will be on the lookout for the Bank of England’s monetary policy decision at 1200BST. There is no change expected but the minutes (released also at 1200BST) could contain some interesting clues. An 8:1 split on holding rates is expected with nobody expected to join Ian McCafferty in voting for a 25 basis point rate hike. At 1330BST the US weekly jobless claims are expected to once more show a similar level at 279,000 (282,000 last week).
Chart of the Day – DAX Xetra
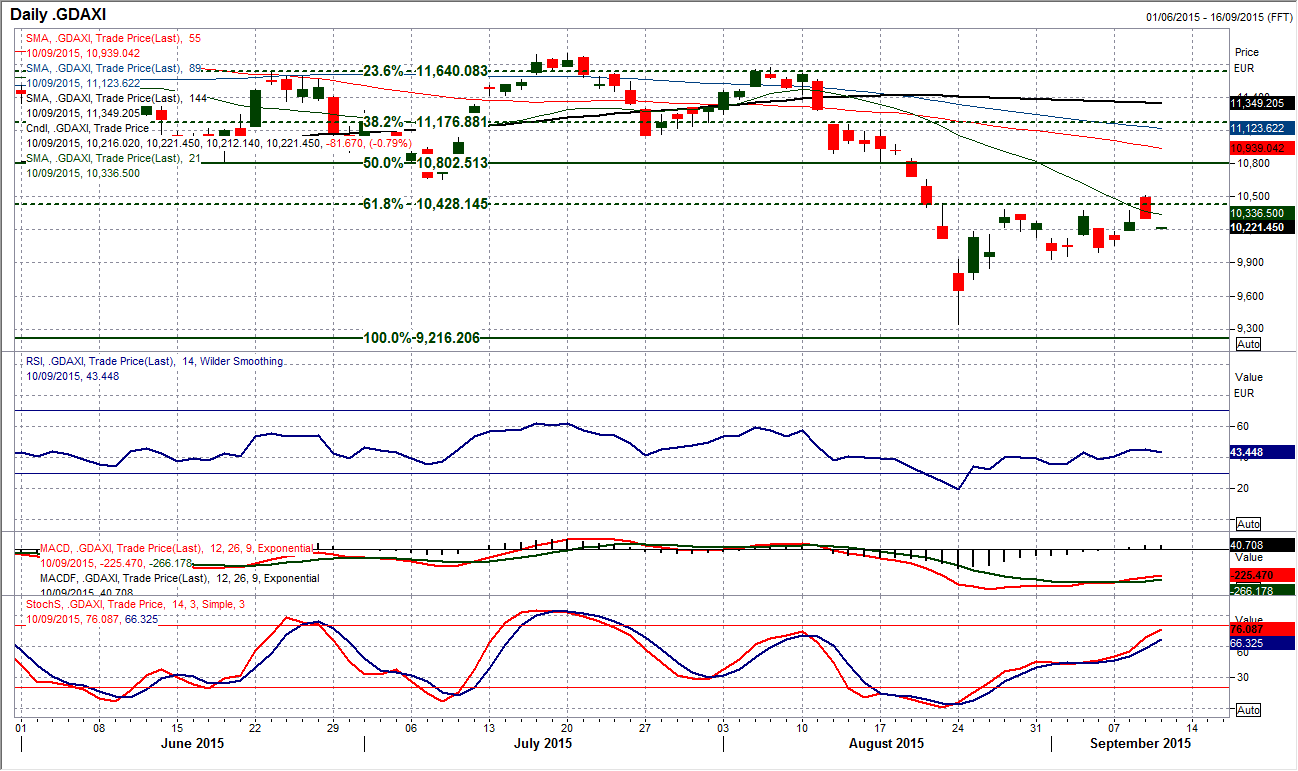
At the midpoint of trading yesterday, the bulls looked set for a near term breakout that would have suggested a continuation of the recovery back towards the 50% Fibonacci retracement of the 9216/12,389 rally. However the breakout above the 50 tick key resistance band 10,380/10,430 could not be sustained, the bears controlled the afternoon’s trading and a bearish candlestick pattern has been left with a close around the low of the day. This is a big confliction to the improvement across all the momentum indicators suggesting increasingly positive momentum and now means that today’s trading is very important for the outlook. Another bearish candle that closes below Tuesday’s low around 10,300 would be a sizeable blow for the bulls and reopen a test of the recent low at 9928 again. The early signs of trading do not look good as the selling pressure is mounting. Support comes in at 10,055 and around 10,000. Despite the improving medium term momentum the hourly chart reflects the near term deterioration. The conflict across the time horizons is fairly indicative of the volatile and uncertainty surrounding current trading. The bulls would consider holding on to 10,000 probably a little victory for now.
EUR/USD
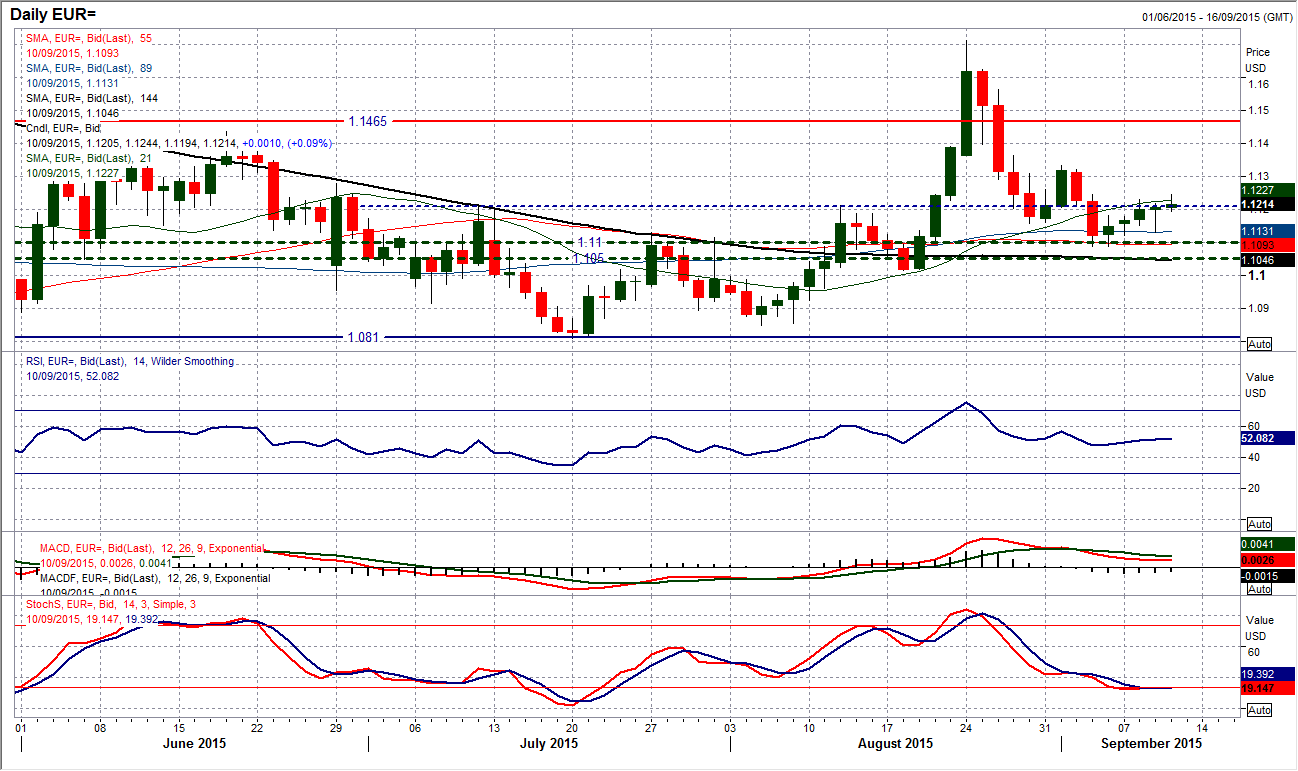
An afternoon rally yesterday has brought the euro back from the brink once again, turning the outlook round and keeping the sellers at bay. Although the price has closed higher, once again within this rebound of the past week, I would still argue that this latest candle is another instance of a weak bullish candle. I do not think a long lower shadow is an especially encouraging one. You can look at these in two ways but it shows that the sellers may not have won the day, but they are present still and are ready to test the bullish resolve. A warning sign. Daily momentum remains indecisive and again this morning the European session takes over from a rather lacklustre Asian one. The intraday hourly chart shows a break above initial resistance at $1.1230 yesterday but failing under $1.1250. The hourly momentum is neutrally configured and does not suggest the formation of a decisive trend so continue to play this near term choppy phase. Initial support comes in at $1.1130 and I would not rule out a drift back in that direction.
GBP/USD
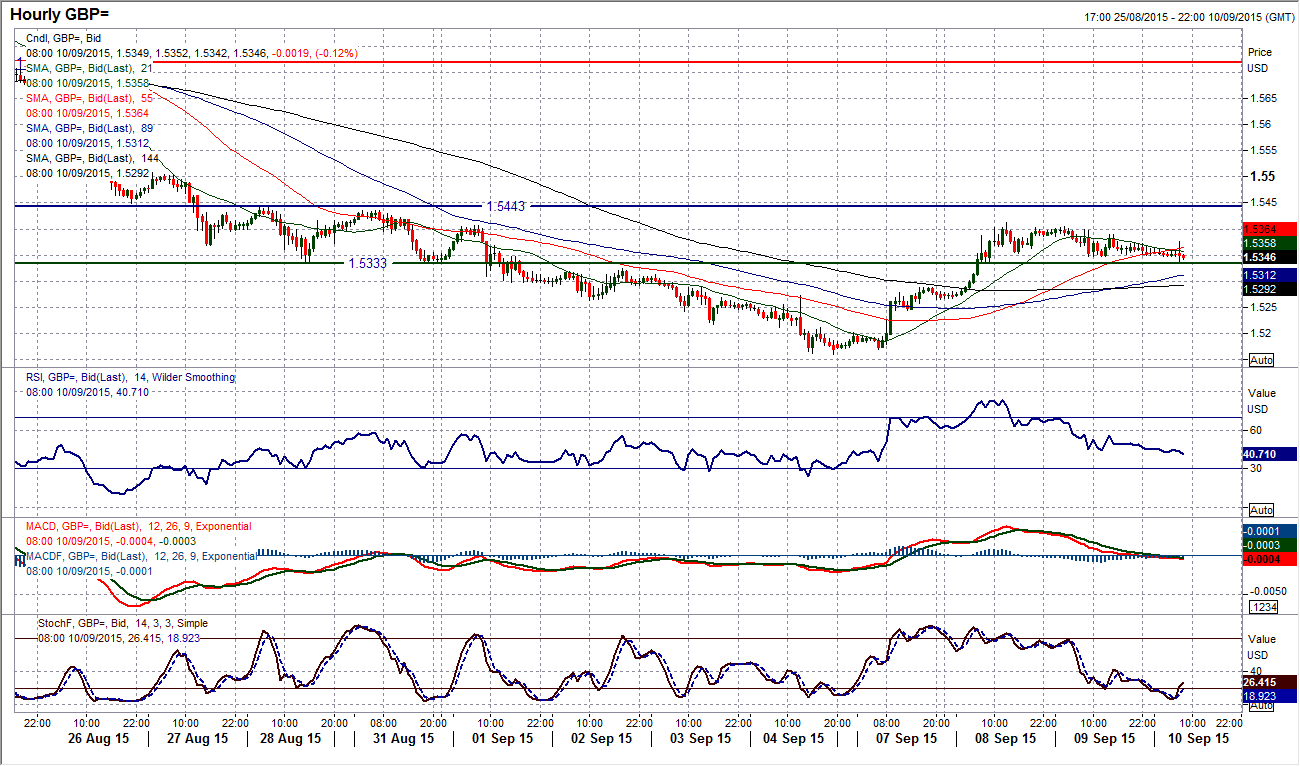
The sharp two day rally has hit the buffers for now and started to correct again. This is beginning to impact on the recovery momentum however, there is still a confirmed buy signal on the Stochastics which is a positive for the near to medium term rally. I spoke yesterday about the support at $1.5330 and the intraday hourly chart shows the move over the past 48 hours is simply one of consolidation. The hourly momentum indicators are being unwound and with the support in place this is something that the bulls will be looking at as a good development. If this support continues to hold I expect that there could be further gains. To retest the recent high at $1.5412 and beyond up towards $1.5440 and $1.5508. The caveat could be that this is a consolidation in front of the Bank of England monetary policy decision. The decision itself is in no doubt, another hold on rates, but with the minutes released concurrently, there could be a dovish lean considering the recent market turmoil and disappointing UK data. This could shape the near term outlook on Cable. Below $1.5330 support is $1.5265 initially.
USD/JPY
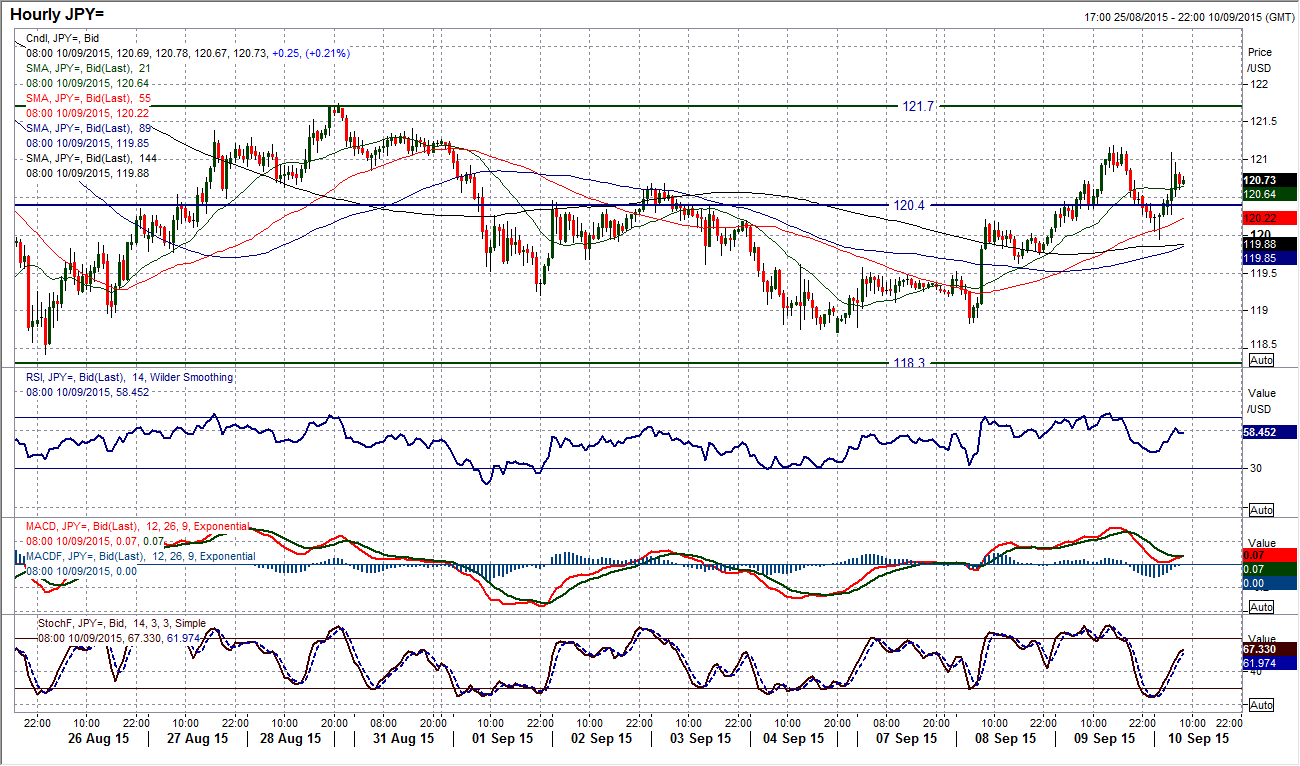
The recovery on Dollar/Yen has moved beyond where I thought it might and is now into a fourth day of gains. This is in keeping with what has become a fairly uniform range on Dollar/Yen. So I must start talking about a test of the range high then at 121.70. The latest rally is now acting as a pull on momentum indicators which have picked up now, however I do not see that they are especially reliable given the size of the range formation which is around 340 pips. I believe that the intraday hourly chart still reflects rangebound hourly momentum indicators and there is resistance in place at 121.20 from yesterday’s high. The overnight Asian trading has put the bulls in control as the Europeans take over but if the resistance at 121.20 cannot be breached then there could be a feeling of taking profits again and a range continuation. Support initially comes in at 119.95 before 119.60.
Gold
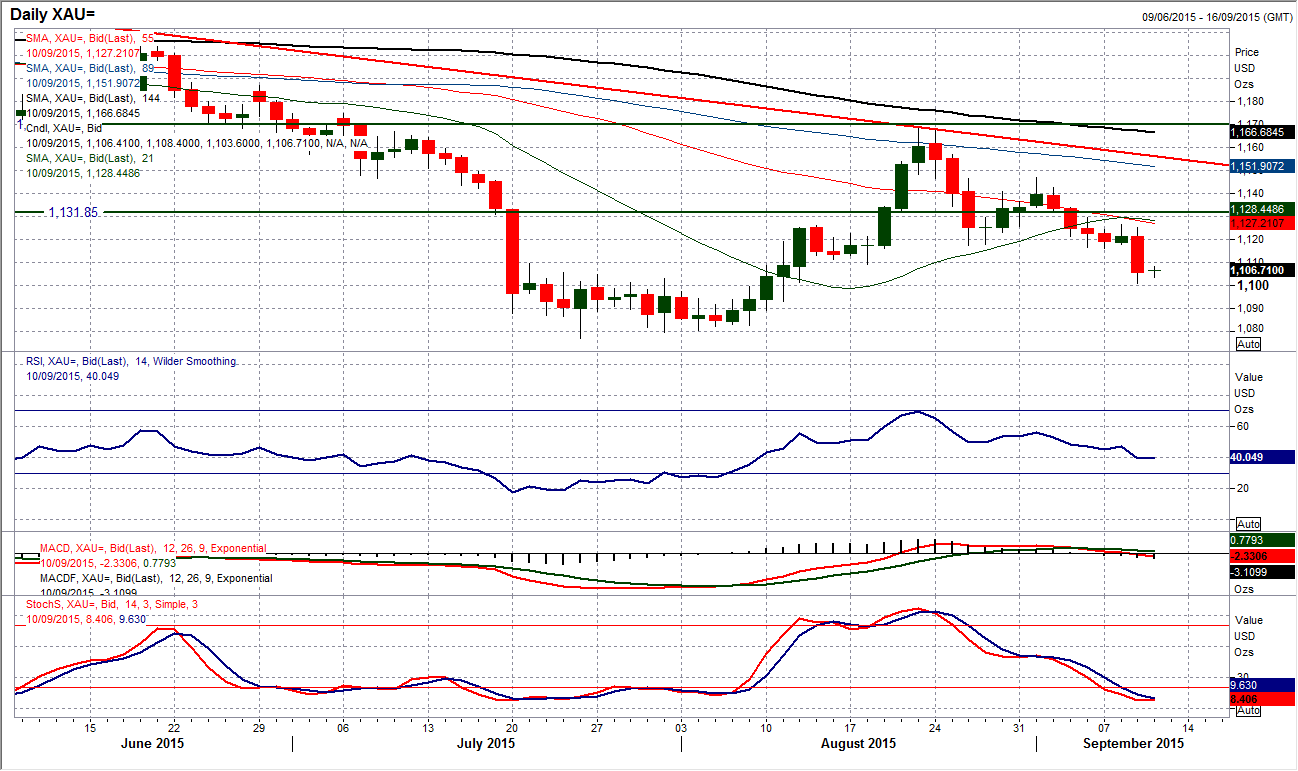
After a few days on consolidation the breakdown duly arrived and very much puts the sellers in control again. The outlook on the daily chart is increasingly concerning now for the gold bugs, with the momentum indicators all in bearish configuration, moving averages all turning lower and the initial support at $1109.10 having been breached. This now opens a full correction back towards the support band around $1080. Selling into any rallies now seems to be the strategy, with the old supports at $1109 and around $1117 now becoming resistance for rallies. The hourly chart shows near term oversold momentum needs to unwind and this could give an opportunity to sell today. It would now need a move above initial resistance at $1125 to improve the chart but also then a move above $1131.85 to suggest the bulls are putting in a sustainable rally.
WTI Oil
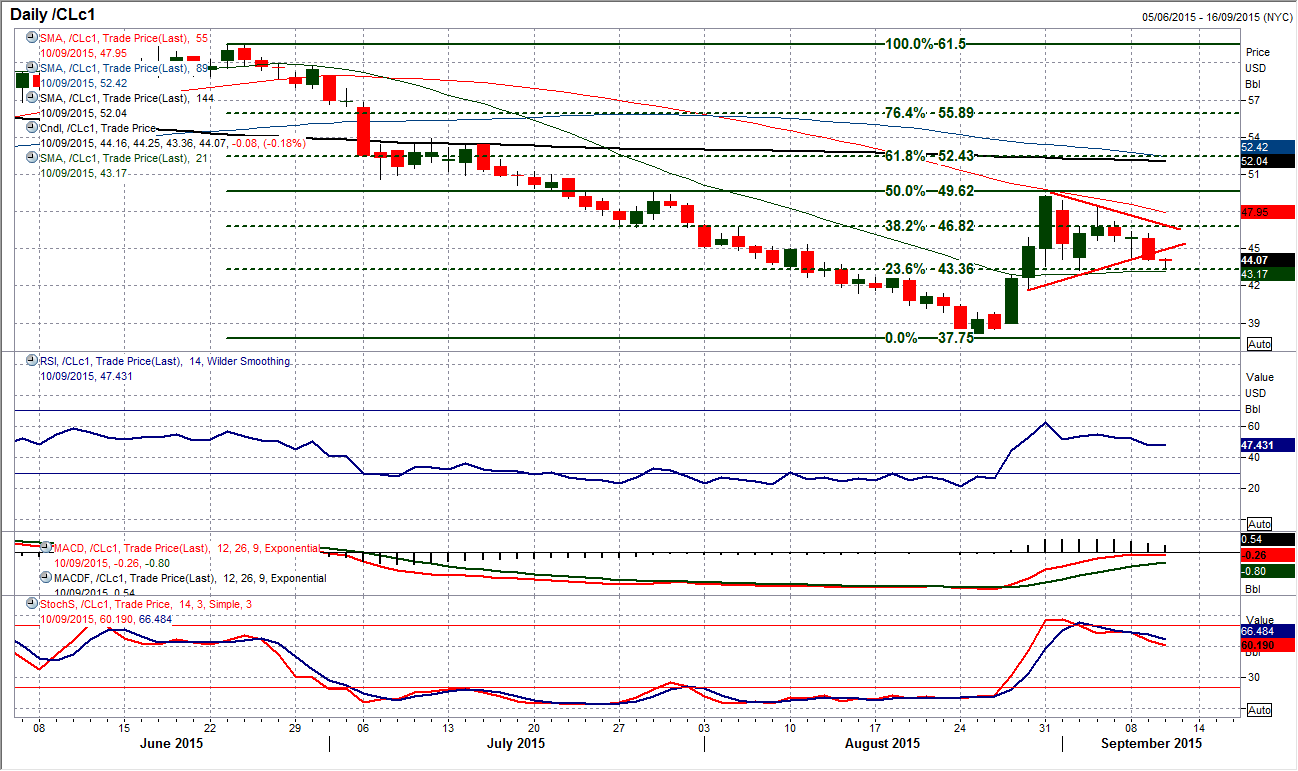
The consolidation seen on WTI formed a symmetrical triangle in the past 8 sessions, but the late session selling pressure has now completed the breakdown. A breach of the support at $44.14 and with the price trending lower over the past three days, the bears will be growing in confidence once more. Having previously looked broadly neutral, the daily momentum indicators are beginning to slide and look increasingly corrective once more. A breach of the 50% Fibonacci retracement of the $37.75/$49.33 rebound at $43.54 and the support of the key reaction low from the 2nd September at $43.20 would now be the key test as it would be the confirmation of a bearish breakdown. This would then open the next support at $41.80. The volatility remains in this chart and it would take a move above $46.40 to improve the outlook.
Note: All information on this page is subject to change. The use of this website constitutes acceptance of our user agreement. Please read our privacy policy and legal disclaimer. Opinions expressed at FXstreet.com are those of the individual authors and do not necessarily represent the opinion of FXstreet.com or its management. Risk Disclosure: Trading foreign exchange on margin carries a high level of risk, and may not be suitable for all investors. The high degree of leverage can work against you as well as for you. Before deciding to invest in foreign exchange you should carefully consider your investment objectives, level of experience, and risk appetite. The possibility exists that you could sustain a loss of some or all of your initial investment and therefore you should not invest money that you cannot afford to lose. You should be aware of all the risks associated with foreign exchange trading, and seek advice from an independent financial advisor if you have any doubts.
Recommended Content
Editors’ Picks
AUD/USD could extend the recovery to 0.6500 and above

The enhanced risk appetite and the weakening of the Greenback enabled AUD/USD to build on the promising start to the week and trade closer to the key barrier at 0.6500 the figure ahead of key inflation figures in Australia.
EUR/USD now refocuses on the 200-day SMA

EUR/USD extended its positive momentum and rose above the 1.0700 yardstick, driven by the intense PMI-led retracement in the US Dollar as well as a prevailing risk-friendly environment in the FX universe.
Gold struggles around $2,325 despite broad US Dollar’s weakness

Gold reversed its direction and rose to the $2,320 area, erasing a large portion of its daily losses in the process. The benchmark 10-year US Treasury bond yield stays in the red below 4.6% following the weak US PMI data and supports XAU/USD.
Bitcoin price makes run for previous cycle highs as Morgan Stanley pushes BTC ETF exposure

Bitcoin (BTC) price strength continues to grow, three days after the fourth halving. Optimism continues to abound in the market as Bitcoiners envision a reclamation of previous cycle highs.
US versus the Eurozone: Inflation divergence causes monetary desynchronization

Historically there is a very close correlation between changes in US Treasury yields and German Bund yields. This is relevant at the current juncture, considering that the recent hawkish twist in the tone of the Federal Reserve might continue to push US long-term interest rates higher and put upward pressure on bond yields in the Eurozone.
