Market Overview
Falling commodity prices are still a concern for global markets. The issue was again brought to the fore yesterday amid a series of disappointing manufacturing PMIs from the world’s leading economies, as China and the US came in worse than expected. The impact is playing out across the oil markets which have now fallen back to multi month lows. Equity markets are feeling the strain, with markets most exposed to basic materials and oil sectors, have been hit the hardest (such as FTSE 100). The Reserve Bank of Australia has held rates steady at 2.0% today but interestingly it has also come out this morning and dropped its easing bias may reduce the pressure on the Aussie near term. The RBA has been trying to talk down the Aussie amid concerns over the commodities prices but this move is an interesting slight change of tack by the RBA.
Equity markets were under a little pressure yesterday with Wall Street closing lower by around a quarter of a percent on S&P 500, which has just held back Asian markets overnight too. The European session has also started off on the back foot today with a small slide. Forex majors have been interestingly settled in recent days and this has tended to continue today. The big move is with the Aussie which is over a percent higher in the wake of the slightly less dovish rhetoric from the RBA.
Traders will be keeping half an eye on the UK Construction PMI data at 0930BST (58.6 expected),prior to the US Factory Orders at 1500BST which are expected to improve by 1.8% for the month. New Zealand unemployment is due at 2345BST and is expected to increase slightly to 5.9%.
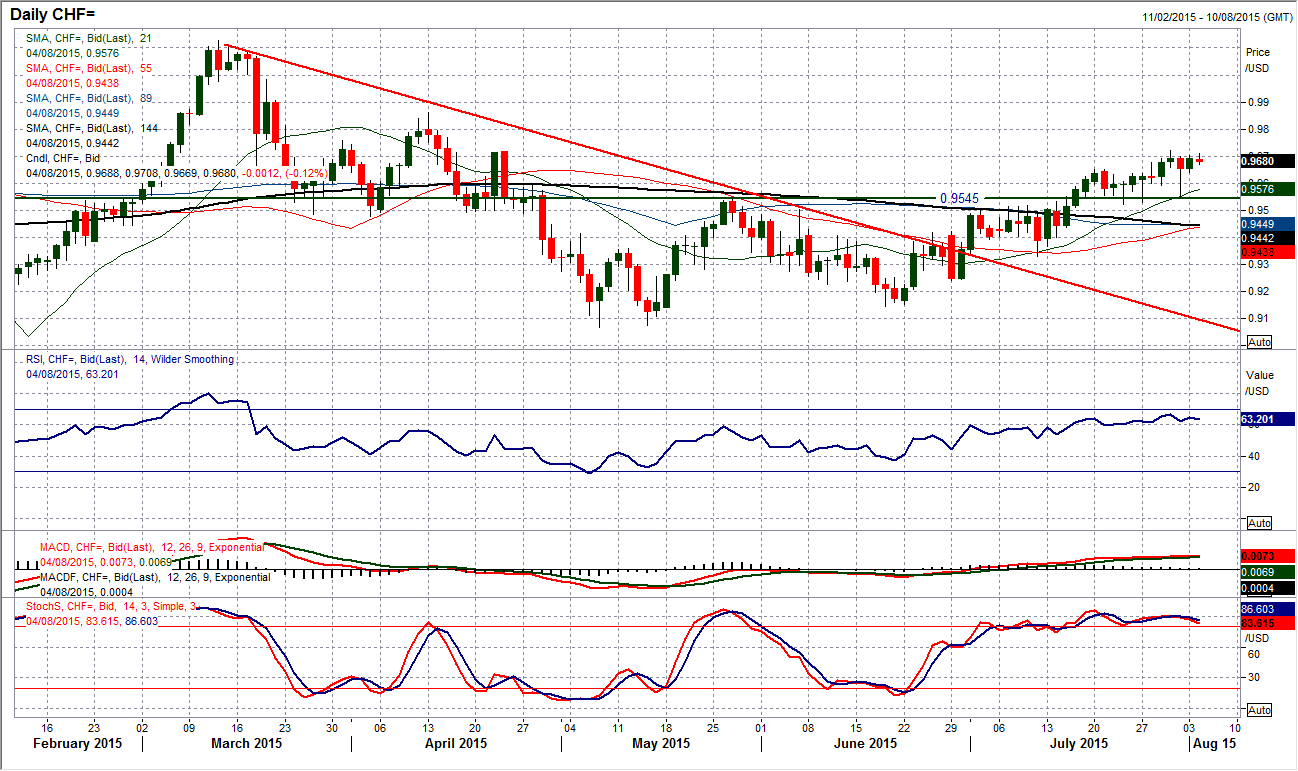
Chart of the Day – USD/CHF
The Swissy remains under pressure against the dollar and having broken out above the resistance at 0.9545 the outlook continues to deteriorate steadily. Interestingly, the spike lower on Friday came to reverse also bang on the breakout level before bouncing once more. The move also came back to find support around the rising 21 day moving average (currently 0.9576). I see the RSI now strongly in positive configuration with it consistently holding above 60 (a level which had previously been a barrier as the pair was looking to break higher) The consistent push for a further rebound is putting pressure on the resistance at 0.9720, with any intraday weakness seen as a chance to buy. There is initial support around 0.9630/40. Perhaps watch the MACD lines which are just beginning to roll over again on the hourly chart and this could give an opportunity for the chance to buy once more. The key near term support remains 0.9545. Above 0.9720 opens 0.9863.
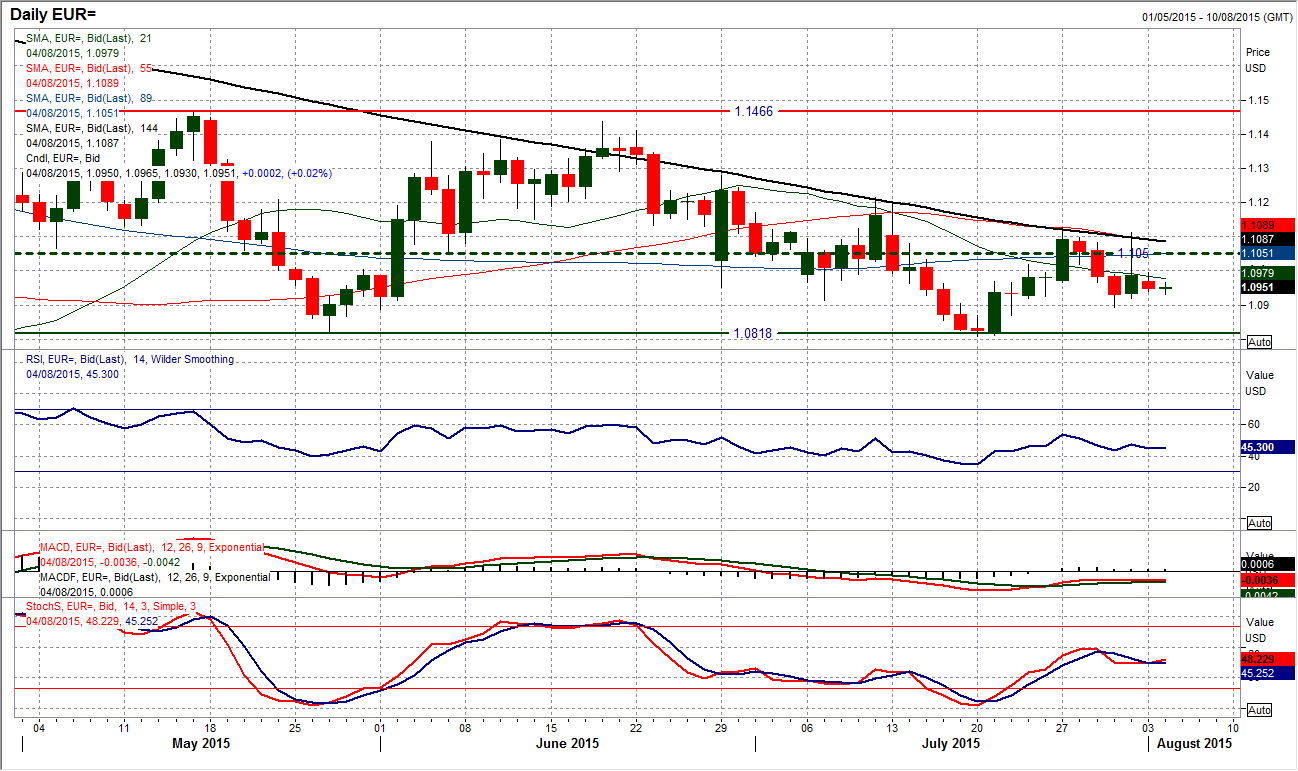
EUR/USD
The euro has settled back into quite a calm drift lower having unwound the whole of Friday’s spike higher. The configuration of the technicals are back into slightly negative drift mode with the RSI sliding for the past week and back below 50, whilst the Stochastics show a similar pattern and the MACD lines consistently below neutral. I have been a seller into strength for a while on the euro and see no reason to change this view. The hourly chart is also reflective of this slight negative shift without the rampant selling pressure. This could all in a way be summed up as summer trading really without any real conviction in place. There are a couple of intraday levels to use as support lines at $1.0890 and $1.0870 which protect a full move back to test the $1.0810/$1.0820 lows again. Resistance initially comes in at $1.0995.
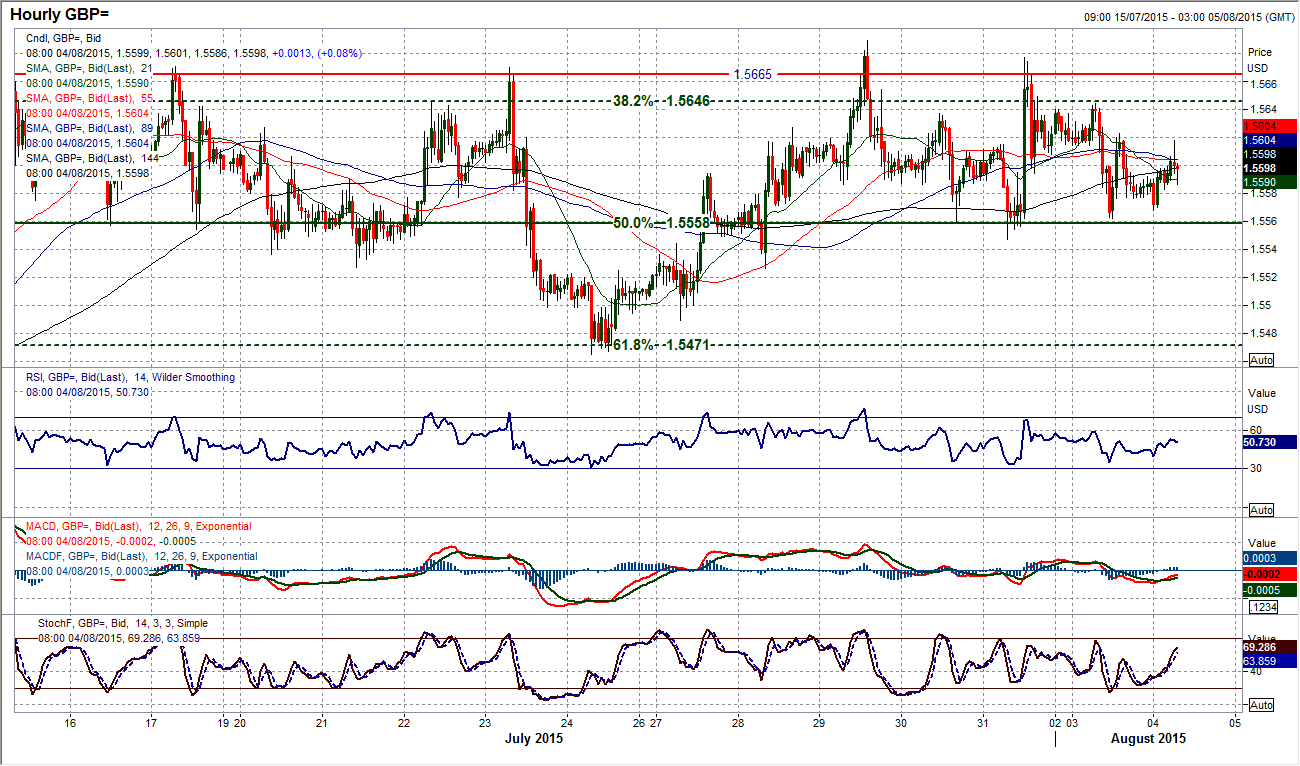
GBP/USD
Despite the odd intraday spike through resistance levels, Cable continues to trade sideways without any direction with the outlook increasingly neutral. The low/high range of the band can now be seen between $1.5450/$1.5690 and with momentum indicators almost entirely neutrally configured it is difficult to pick any real direction near term. It is times like these where there are plenty of false signals to be careful of and waiting for a confirmed move is vital before taking a view. Perhaps though there are opportunities to use the hourly chart for signals though, with the Fibonacci retracements once more acting as interesting near term pivot levels. Especially 50% Fibonacci retracement of $1.5188/$1.5928 at $1.5558 seems to be an important level very near term. Perhaps also watch the hourly RSI which is ranging between 30/70 and can be used to play the range.
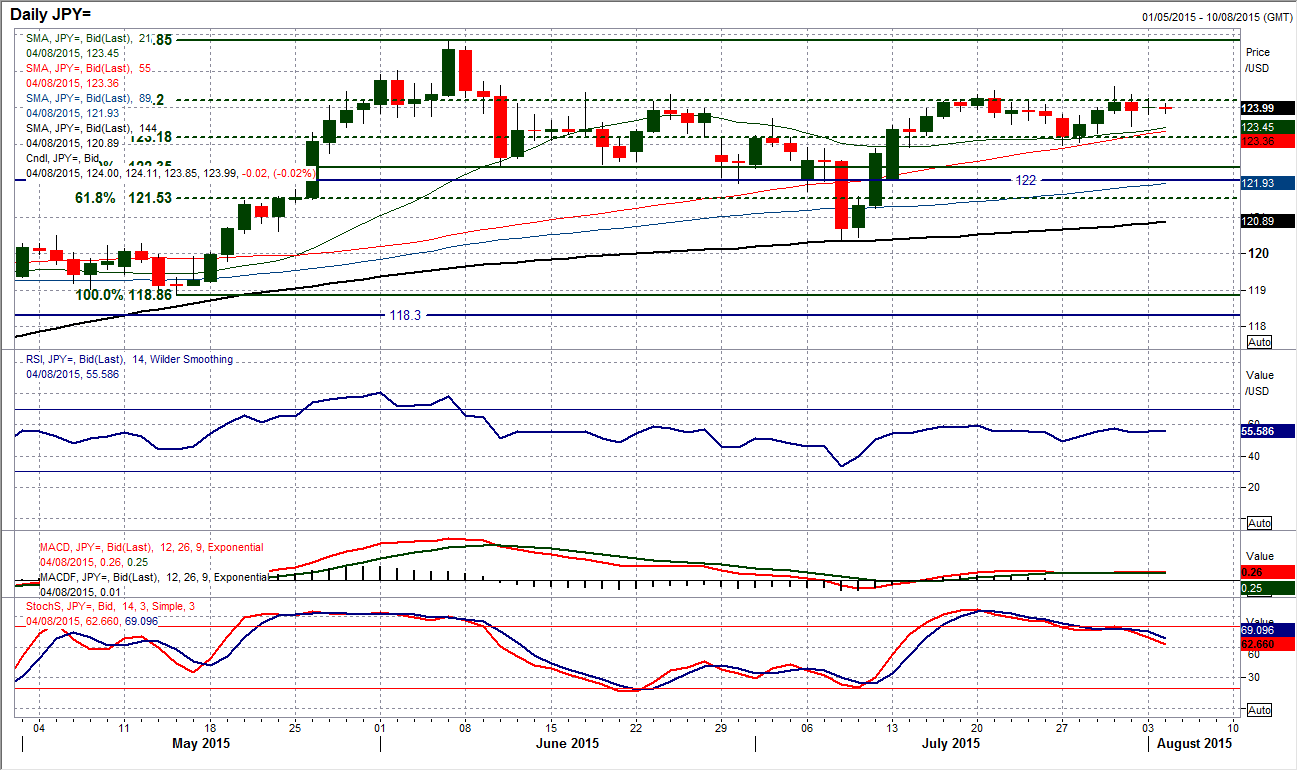
USD/JPY
Although Dollar/Yen is a little less obvious in its range play, the lack of conviction and inability to sustain a breakout is similar to Cable. The upside pressure on what was originally the resistance at 124.43 has been growing over the past few weeks and although a couple of intraday breaches have been seen, there has been no conviction breakout. The resistance remains a barrier. Interestingly there are variances in the momentum indicators, with the RSI remaining stuck under 60 (but still putting pressure on), whilst the Stochastics are quite firmly in decline. The Stochastics are certainly preventing a positive outlook on the pair, whilst yesterday’s “doji” candle reflects the uncertainty as well. Without a decisive close above 124.58 now the bulls will not be able to have the control (which I also see needs the RSI closing consistently above 60). The lower highs at 124.37 and 124.27 are not helping on the hourly chart. This one could need a catalyst to make the break.
Gold
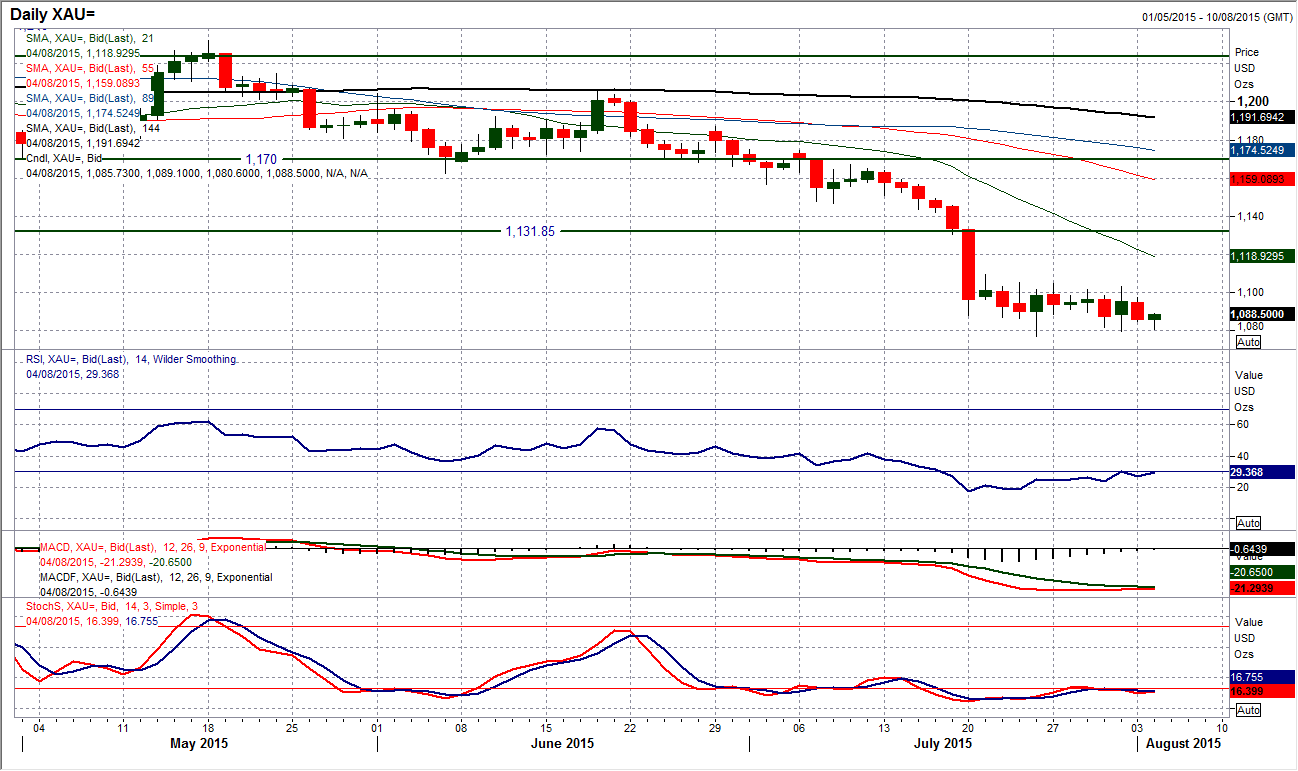
The consolidation on gold continues. Since hitting a low at $1077 just over a week ago the price has settled down. Perhaps this is part of the unwinding process for the oversold momentum but the consolidation is bringing a sense of calm to trading. I do not believe that this is part of a basing process though. The speed of the early to mid-July sell off saw extreme levels reached on the RSI and the fact that the price did not react with a strong instant unwinding bounce is interesting and suggests an acceptance. The hourly chart shows the resistance is in place below $1105.60 and this is holding back the bulls. The hourly RSI has become rangebound between 30/70 and reflects the sideways consolidation. I am still favouring the sellers ultimately for a downside break and below $1077 would open the 2010 low at $1043 again.
WTI Oil
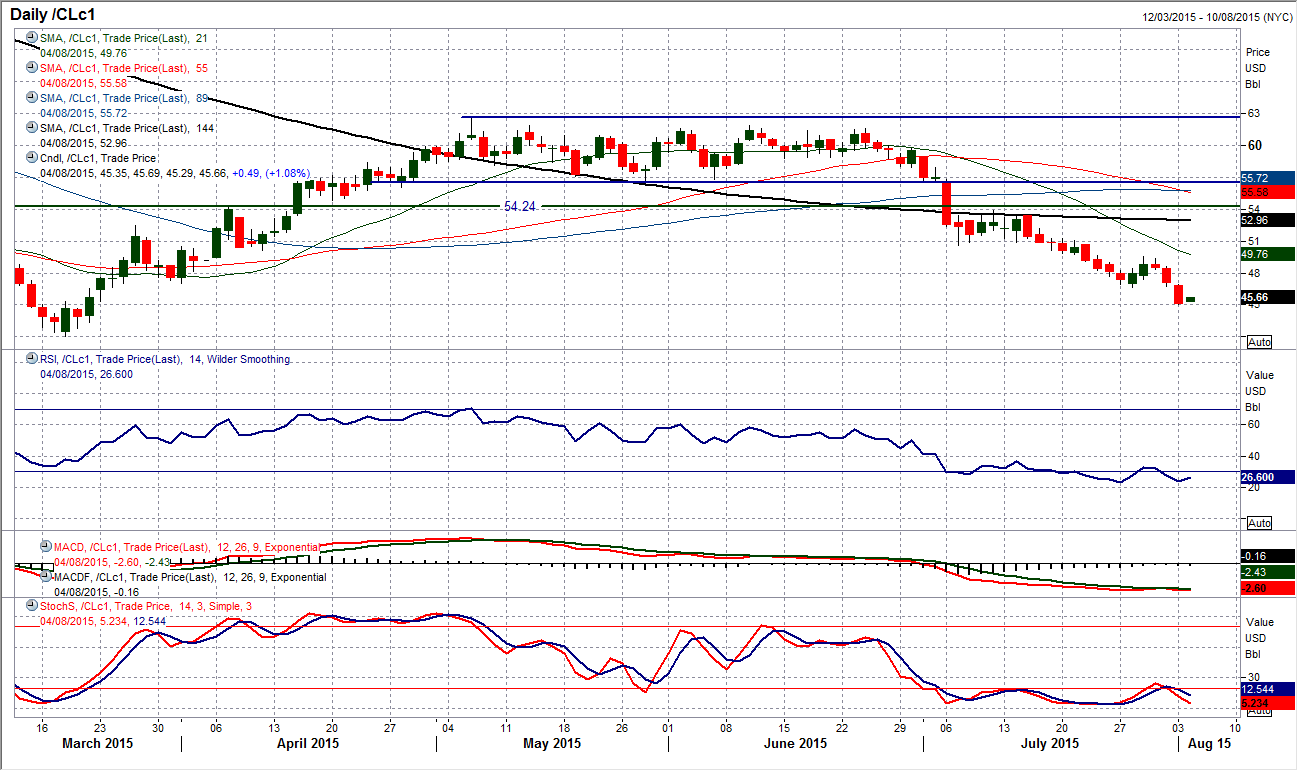
The selling pressure has returned with some gusto in the past few days. The previous reaction low at $46.68 has quickly been taken out and the bears are pushing the price back towards the crucial March low at $42.03. The daily momentum indicators remain in bearish configuration and selling rallies remains a viable strategy. The intraday hourly chart shows there is now a band of initial resistance around $46.70/$47.00 which should be able to contain a rally should an unwinding rally take hold.
Note: All information on this page is subject to change. The use of this website constitutes acceptance of our user agreement. Please read our privacy policy and legal disclaimer. Opinions expressed at FXstreet.com are those of the individual authors and do not necessarily represent the opinion of FXstreet.com or its management. Risk Disclosure: Trading foreign exchange on margin carries a high level of risk, and may not be suitable for all investors. The high degree of leverage can work against you as well as for you. Before deciding to invest in foreign exchange you should carefully consider your investment objectives, level of experience, and risk appetite. The possibility exists that you could sustain a loss of some or all of your initial investment and therefore you should not invest money that you cannot afford to lose. You should be aware of all the risks associated with foreign exchange trading, and seek advice from an independent financial advisor if you have any doubts.
Recommended Content
Editors’ Picks
AUD/USD keeps the red below 0.6400 as Middle East war fears mount

AUD/USD is keeping heavy losses below 0.6400, as risk-aversion persists following the news that Israel retaliated with missile strikes on a site in Iran. Fears of the Israel-Iran strife translating into a wider regional conflict are weighing on the higher-yielding Aussie Dollar.
USD/JPY recovers above 154.00 despite Israel-Iran escalation

USD/JPY is recovering ground above 154.00 after falling hard on confirmation of reports of an Israeli missile strike on Iran, implying that an open conflict is underway and could only spread into a wider Middle East war. Safe-haven Japanese Yen jumped, helped by BoJ Governor Ueda's comments.
Gold price pares gains below $2,400, geopolitical risks lend support

Gold price is paring gains to trade back below $2,400 early Friday, Iran's downplaying of Israel's attack has paused the Gold price rally but the upside remains supported amid mounting fears over a potential wider Middle East regional conflict.
WTI surges to $85.00 amid Israel-Iran tensions

Western Texas Intermediate, the US crude oil benchmark, is trading around $85.00 on Friday. The black gold gains traction on the day amid the escalating tension between Israel and Iran after a US official confirmed that Israeli missiles had hit a site in Iran.
Dogwifhat price pumps 5% ahead of possible Coinbase effect

Dogwifhat price recorded an uptick on Thursday, going as far as to outperform its peers in the meme coins space. Second only to Bonk Inu, WIF token’s show of strength was not just influenced by Bitcoin price reclaiming above $63,000.
