Market Overview
As we move into FOMC day, the markets have become characteristically settled. This will often be seen due to the potential volatility surrounding the aftermath of the decision tonight (at 1900BST). It is interesting that prices of commodities have also started to see the selling pressure easing in the past 24 hours. Perhaps due to the liquidity easing measures from the PBOC, or maybe due to the FOMC tonight, but the price of oil has picked up for the first time in almost two weeks, whilst gold has settled. Furthermore, the incredibly weak US Consumer Confidence data also seems to have taken the shine off the dollar strength too which has had a knock on impact across markets, the under pressure commodity currencies certainly feeling the benefit.
The Federal Reserve gives its monetary policy update tonight in the form of a statement. There will be no press conference and no economic forecasts, just the statement. That means that there is unlikely to be any drastic change on the cards. There may be some minor tweaking to the statement but it would be merely speculation to suggest what. However it is marginally possible that there could be some reference to being mindful of falling commodity prices (which would be dovish) or perhaps if they are feeling really bold a reference towards the timing of a rate rise being nearer (which would be bullish). However the Fed is a cautious committee and it is unlikely to want to have its hands tied with so much important data to come. Furthermore, the chances are that it will use the Jackson Hole symposium for any early hints.
Wall Street closed higher last night with the S&P 500 up 1.2%, whilst Asian markets were fairly settled with reduced volatility, the Nikkei closed down 0.1%. The European markets are higher in early trading. Forex markets are very slightly leaning dollar positive as we move into the European session, with the Kiwi holding out. The gold price continues to find an element of support.
Aside from tonight’s FOMC, traders will be watching the Pending Home Sales at 1500BST (+1.0% exp), whilst the Crude Oil inventories are at 1530BST and are expected to decline by 1.0m (from an increase of 2.5m last week).
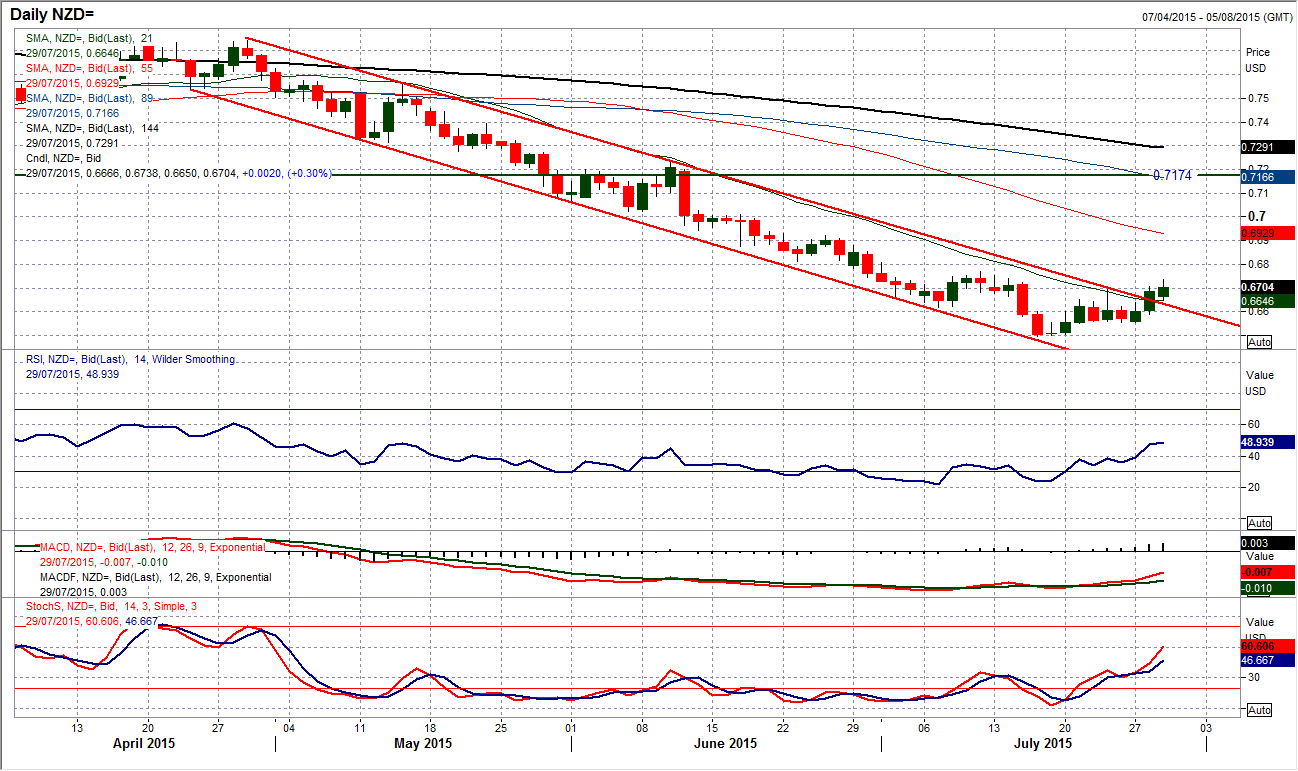
Chart of the Day – NZD/USD
I spoke about the Kiwi gaining ground on the Aussie yesterday, but there are also signs on the major pair that the Kiwi bulls are also fighting back. In front of the FOMC decision the Kiwi has engaged something of a recovery. After weeks of me having to talk about the big downtrend channel and the resistance of the falling 21 day moving average (at $0.6647), there may be a recovery underway. The downtrend channel has been broken, as has the flanking shadow resistance of the falling 21 day ma. The momentum indicators are gathering impetus to the upside once more, with the RSI and Stochastics rising at 10 week highs and the MACD lines also turning higher. The caveat is that the price needs to break above the July resistance high at $0.6770 to really confirm the downtrend breach, whilst the RSI needs to continue to push higher and hold above 50 to suggest this is more than just a bear market rally. The hourly chart also reflects the improvement too, with initial support today coming in at $0.6650 above the key near term support at $0.6555. There will clearly be some volatility in the wake of the FOMC tonight, but unless the Fed raises interest rates, then the technical rebound on the Kiwi could continue.
EUR/USD
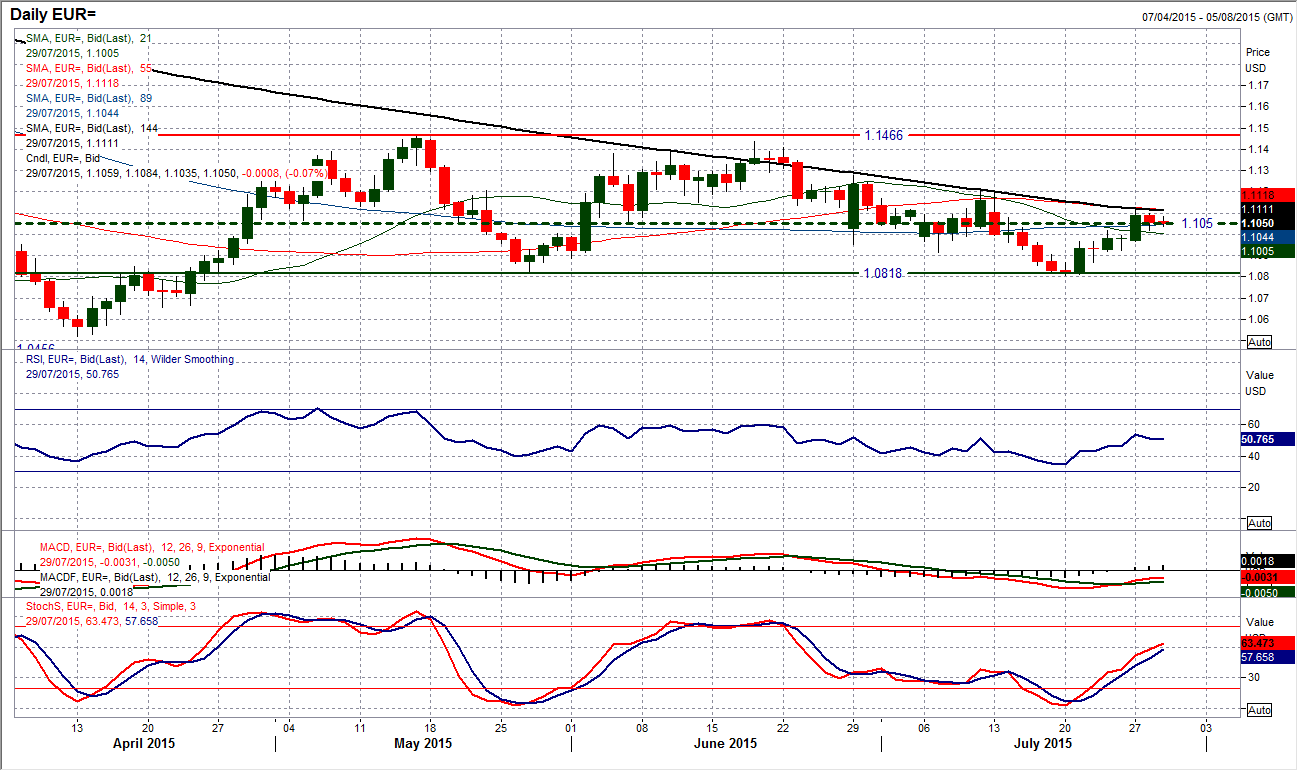
As we come into FOMC day I do not feel that it is necessarily a coincidence that the euro is settling to trade around the $1.1050 pivot that I have been talking about for so many weeks now. The rebound in the last week of so has unwound the euro from the key support around $1.0820 and I see this in the technical sense as a rally that is a chance to sell. However I am also obviously aware that the FOMC decision tonight could have a significant impact on direction. Leaving that aside though, the 144 day ma at $1.1110 remains a barrier to the upside, whilst the lower high resistance comes in at $1.1215. The hourly chart shows an uptrend intact in the past week but is being threatened today, with the support initially coming in at yesterday’s low of $1.1020 (which was also the breakout from the resistance on 23rd July). I would not expect too much movement in front of the FOMC and then volatility in the reaction after. Mixed signals therefore on the euro with positive near term but still seen as being a rally that is a chance to sell. The FOMC is likely to give the direction.
GBP/USD
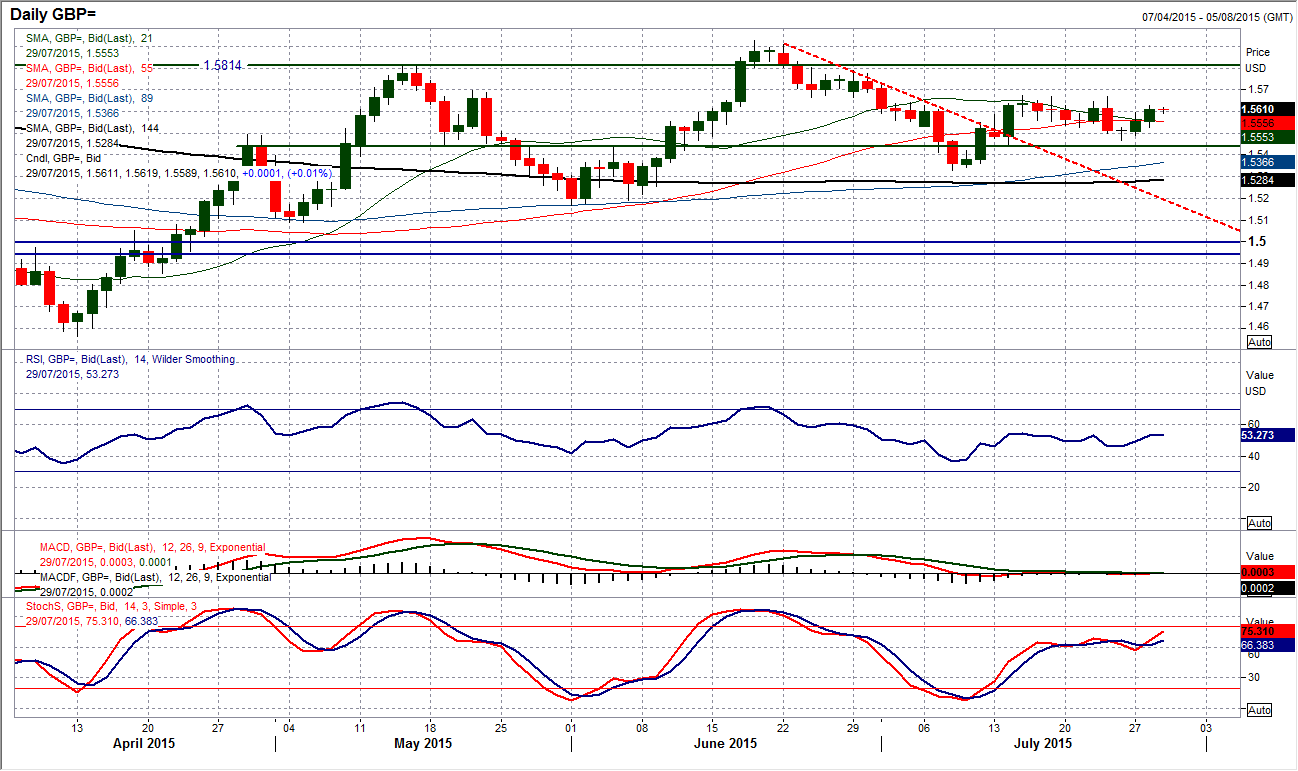
The daily chart continues to show a variety of signals that provide quite a clouded near term outlook. Taken across the past two weeks the chart has gone basically nowhere. This is being reflected in the momentum indicators which are almost entirely neutral (although the Stochastics have a slightly positive skew currently). With two days of consecutive gains perhaps the bulls come into today’s trading feeling the more confident, however that is unlikely to persuade much conviction today in front of the FOMC. The intraday hourly chart shows the range play that continues for sterling without any real sense of breakout, coming with hourly momentum indicators that continue to move around fairly benign levels (RSI remains below 70, whilst Stochastics have rolled over again). Today is a wait and see day with technical signals giving us few clues. Until resistance at $1.5670 is breached or support at $1.5470 is broken it is difficult to take the outlook with any conviction near term.
USD/JPY
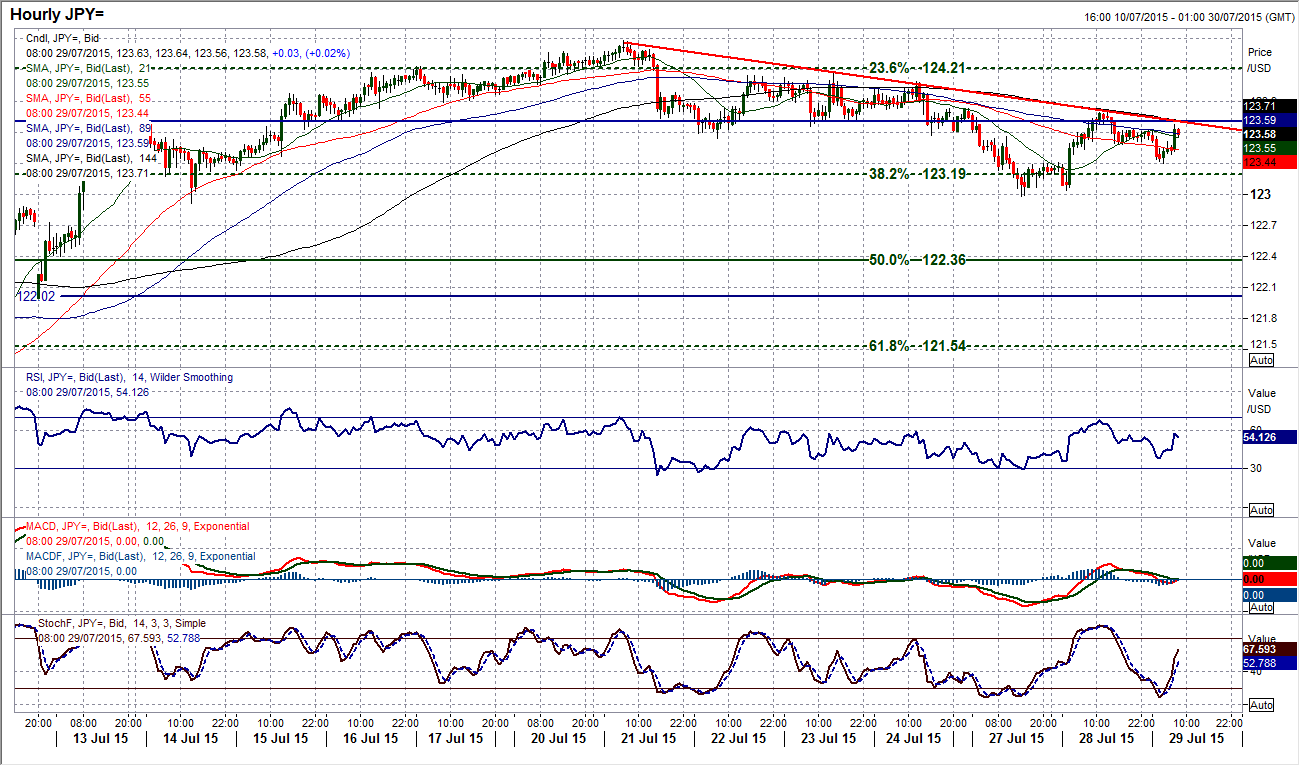
The support came in yesterday to bolster the 38.2% Fibonacci retracement level at 123.20. However for now the bulls continue to sit on their hands, with the rebound finding resistance around 123.80 and failing to ignite. There is a danger that this could develop into a downtrend channel as this is another lower high that has come in underneath the 124.20 peak from 23rd July (this is something that would also be in keeping with the Stochastic sell signal that is now confirming on the daily chart too). I see the likelihood being that this is more of a consolidation phase in front of the FOMC with Dollar/Yen buzzing between the Fib retracements again. On the FOMC meeting tonight, watch for the key levels at 124.48 being resistance, whilst 123.00 is supportive. A confirmed break of either of these will cause direction.
Gold
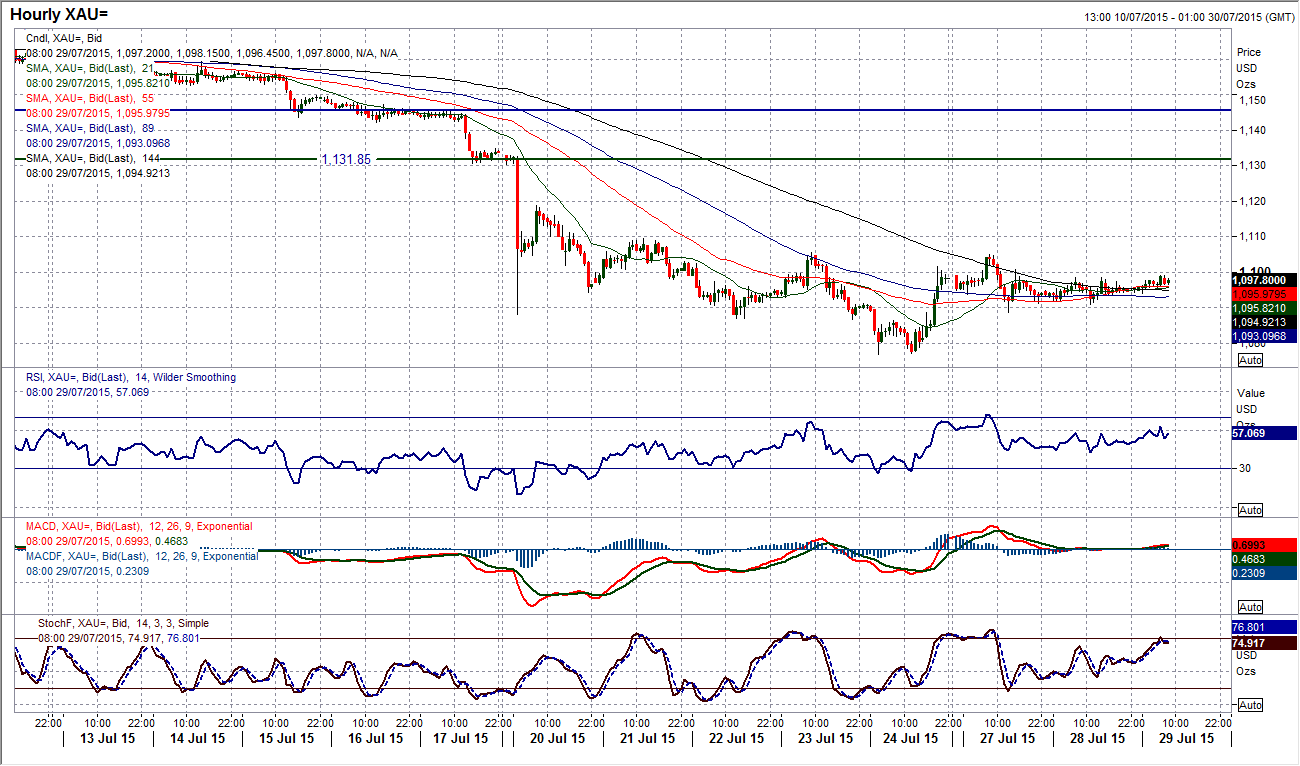
Just from a matter of the experience of analysing charts over a number of years, the trend is your friend for a reason. Reversals occur a lot less frequently that you think. I say this because gold has been consolidating for the past few days after having seemingly been in sharp decline back towards the 2010 low at $1043. The price action is now at an extent that a confirmed break above $1105.60 would complete a small base pattern on the hourly chart (a confirmation would come on a move above $1109.50 resistance. However looking at the daily chart there is little to get excited about. Any improvement in momentum indicators is purely because they are unwinding from an extreme oversold position rather than momentum showing serious signs of a sustainable improvement. The sheer fact is that the gold price is now just not being sold off for the time being. That does not mean that a recovery is imminent. One may be seen, but even then I do not see it as a rally to last for long before the bears get the control back. The chart support levels come in at $1088.80 and then the key low at $1077.
WTI Oil
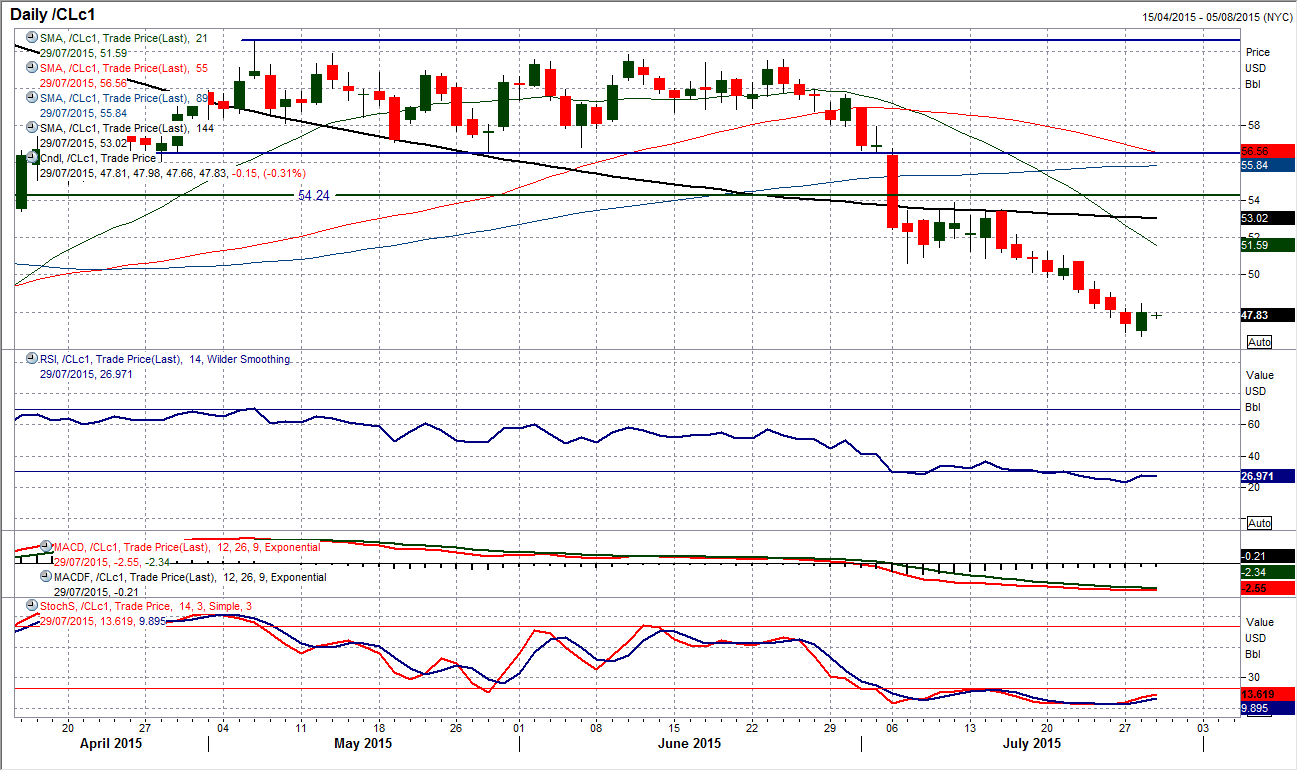
Is this a reversal signal I see? Well, after the WTI price has fallen by well over 20% in just over a month, the first positive candle has been seen for weeks. With the RSI at its lowest level since December, an intraday low of $46.68 was hit yesterday before a complete turnaround and a pick up in the price (interestingly coming around the time of the weaker than expected US Consumer Confidence number). The rebound was just 20 cents away from forming a bullish engulfing candle. Despite this, the result on the daily chart is an uptick in momentum indicators, but there needs to be a follow up today for the move to be taken even remotely seriously. The daily chart barely shows any discernible improvement, but the hourly chart is far more pronounced. Watch for the falling 89 hour moving average being decisively breached (currently $47.95) to help signal a near term improvement. Also the hourly RSI pushing above 70 which it has not done since the bear run began back in mid-June. This is very early days, but signs of light for the bulls, perhaps.
Note: All information on this page is subject to change. The use of this website constitutes acceptance of our user agreement. Please read our privacy policy and legal disclaimer. Opinions expressed at FXstreet.com are those of the individual authors and do not necessarily represent the opinion of FXstreet.com or its management. Risk Disclosure: Trading foreign exchange on margin carries a high level of risk, and may not be suitable for all investors. The high degree of leverage can work against you as well as for you. Before deciding to invest in foreign exchange you should carefully consider your investment objectives, level of experience, and risk appetite. The possibility exists that you could sustain a loss of some or all of your initial investment and therefore you should not invest money that you cannot afford to lose. You should be aware of all the risks associated with foreign exchange trading, and seek advice from an independent financial advisor if you have any doubts.
Recommended Content
Editors’ Picks
EUR/USD clings to daily gains above 1.0650

EUR/USD gained traction and turned positive on the day above 1.0650. The improvement seen in risk mood following the earlier flight to safety weighs on the US Dollar ahead of the weekend and helps the pair push higher.
GBP/USD recovers toward 1.2450 after UK Retail Sales data

GBP/USD reversed its direction and advanced to the 1.2450 area after touching a fresh multi-month low below 1.2400 in the Asian session. The positive shift seen in risk mood on easing fears over a deepening Iran-Israel conflict supports the pair.
Gold holds steady at around $2,380 following earlier spike

Gold stabilized near $2,380 after spiking above $2,400 with the immediate reaction to reports of Israel striking Iran. Meanwhile, the pullback seen in the US Treasury bond yields helps XAU/USD hold its ground.
Bitcoin Weekly Forecast: BTC post-halving rally could be partially priced in Premium

Bitcoin price shows no signs of directional bias while it holds above $60,000. The fourth BTC halving is partially priced in, according to Deutsche Bank’s research.
Week ahead – US GDP and BoJ decision on top of next week’s agenda

US GDP, core PCE and PMIs the next tests for the Dollar. Investors await BoJ for guidance about next rate hike. EU and UK PMIs, as well as Australian CPIs also on tap.
