Market Overview
European markets continue to settle down as the new week has begun in a far calmer sentiment than any of the past few Mondays. Greece will re-open its banks today. The capital controls remain in place but the withdrawal limit has been changed from €60 per day to €420 per week. For the risk of sound quite simple, I do not see this as any different. The only difference is that instead of queuing up every day for a week to get your €60, you can get it all in one go. There is no increase in the overall amount that can be withdrawn. Still this seems to be helping with confidence. Greece will also be repaying the ECB €3.5bn today which will come out of the €7bn bridge financing that it secured last week.
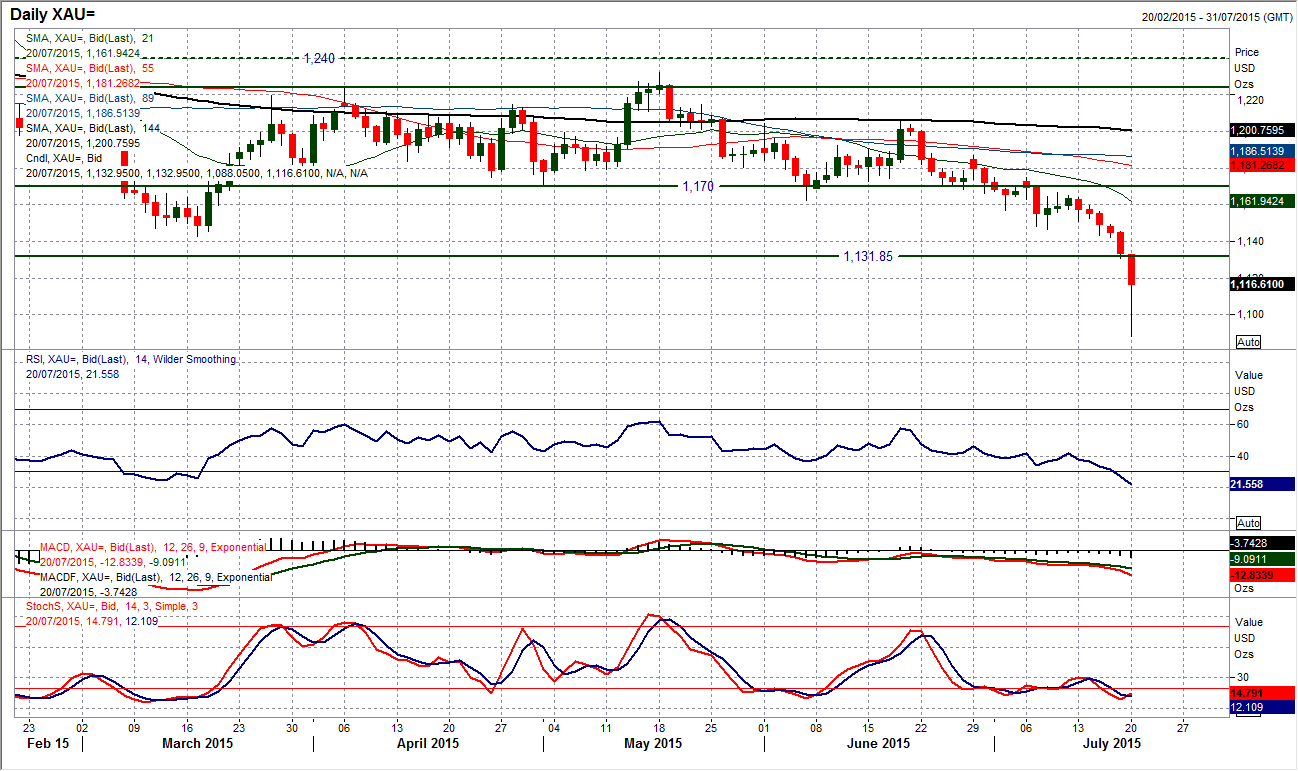
Asian markets were also settled overnight, with little significant moves, the Nikkei 225 rising by 0.3%. European markets are mildly higher in early trading. The big mover overnight has been in the gold price which fell almost $45 in little over one minute. The move has not come amidst any real fundamental news, with a series of major stop losses being tripped as major support levels have been breached. There were reports that Chinese gold reserves have not been increased by as much as some had been expecting. Other precious metals have also come under selling pressure.
In fore markets the dollar is trading slightly weaker today, without a great deal of direction to speak of. The one main exception to this though has been a sharp bound in the Kiwi which is around 1% higher. There has been no fundamental data behind the leap but the Kiwi has been under consistent selling pressure in recent weeks and it could be an unwinding of some of that move.
Chart of the Day – USD/CHF
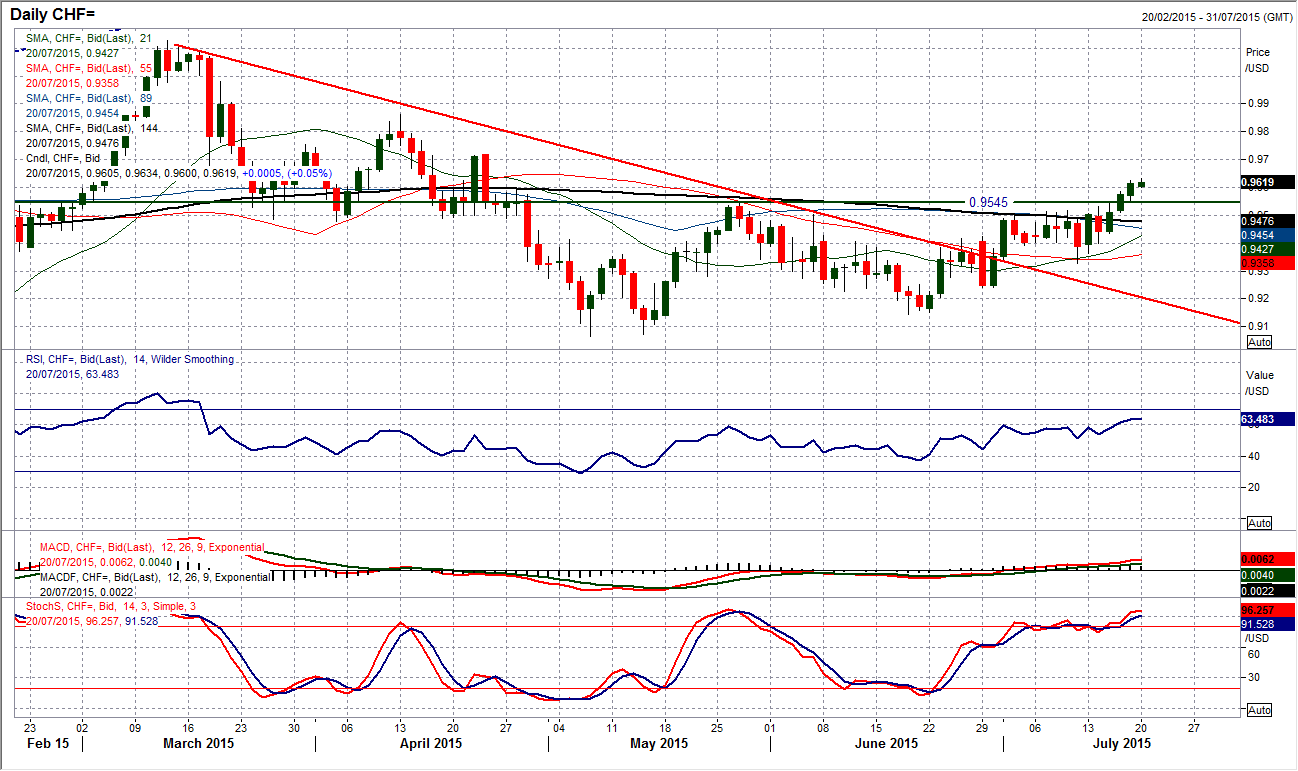
I spoke last week of the potential breakout on Dollar/Swiss that was brewing. This break has now been seen and confirmed by a two day close. The bulls have pushed higher for the past 3 days and moved above the key resistance at 0.9545. This move has taken the pair to a near 3 month high, but also the move is being confirmed on the momentum indicators. The RSI has pushed above 60 to take momentum more positive and to a 4 month high, also the MACD lines are rising above neutral for the first time in 3 months and the Stochastics are positive. This all suggests using any near term corrections as a chance to buy now. I think it is a positive that Friday’s session saw a minor retreat back to find support for around the breakout level at 0.9545, so this level has already come under some consideration and held firm. The intraday hourly chart shows a strong configuration for the dollar and that any dips should be used as a chance to buy.
EUR/USD
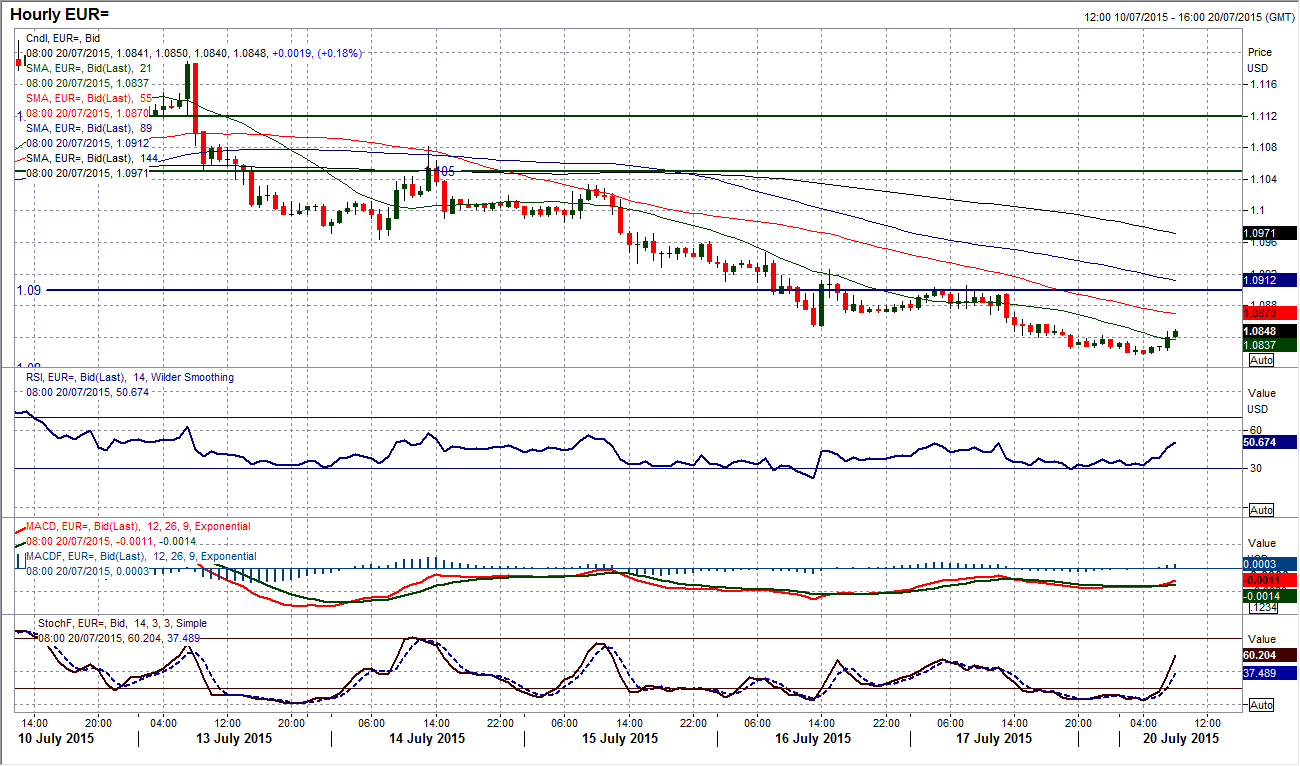
The euro turned lower in the wake of the bailout agreement for Greece last Monday and has barely stopped since. The decline is now directly testing the key May low at $1.0818 and the configuration of the momentum indicators would suggest that further downside pressure will be seen in due course. The RSI and MACD lines are at a 3 month low and the Stochastics are also negative. I continue to say that any rallies should be seen as a chance to sell and certainly for now that includes intraday declines. A closing breach of $1.0818 brings into play the next support at $1.0658 but there is very little reason not to expect a full retracement back to the April low at $1.0519 or the crucial March low at $1.0456. The intraday hourly chart shows the occasional intraday bounce of maybe 80 to 100 pips but these continue to be pounced upon by the sellers. There is minor resistance around $1.0850 with resistance in the band $1.0900/$1.0925 more considered. As the hourly momentum unwinds (hourly RSI is falling over around 50/60 in the past couple of sessions, this could be the chance.
GBP/USD
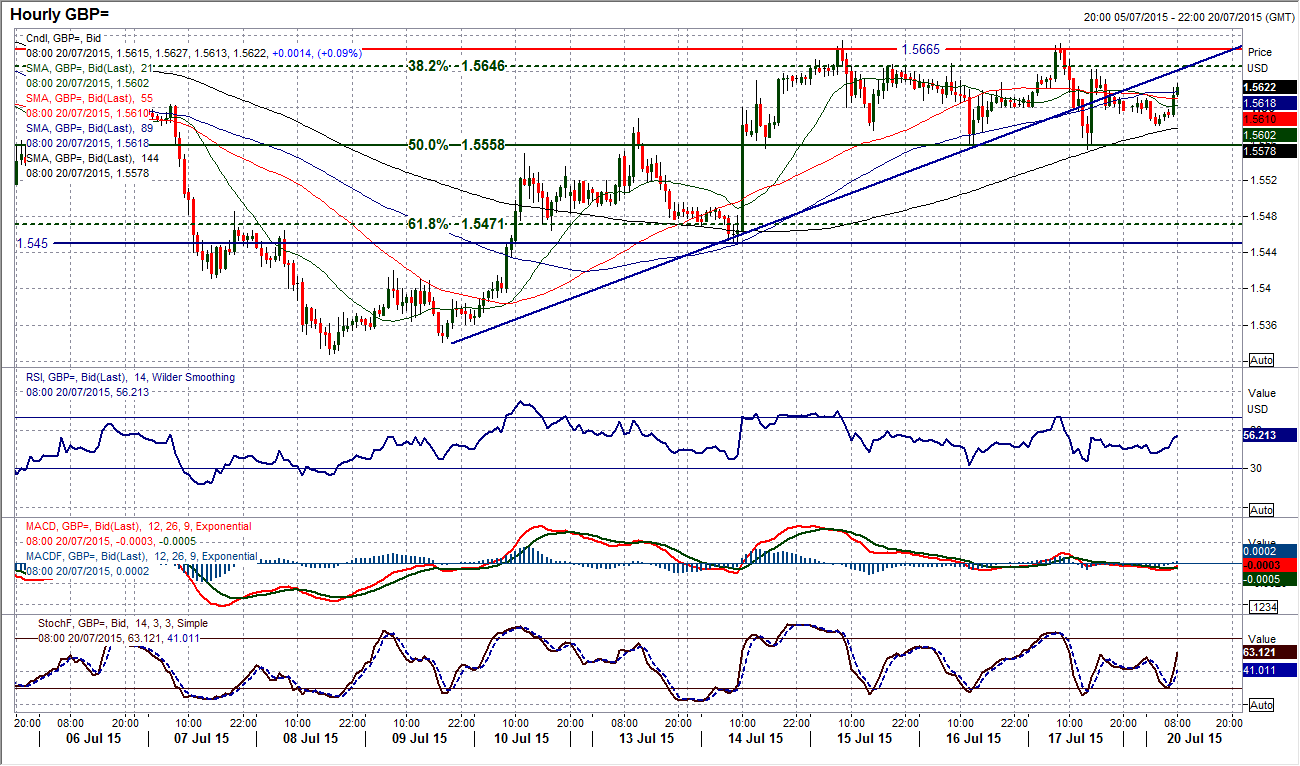
Cable is going through a bit of an uncertain phase at the moment. After the rally pulled sharply higher from the $1.5328 low there have since been three candles of consolidation, two of which have been “dojis” (signalling uncertainty with the underlying rebound). The momentum indicators have subsequently tailed off and there is an increasing battle for control near term over the bulls and bears. Looking at the intraday hourly chart shows a fascinating period of trading. The support continues to be formed almost to the pip at the 50% Fibonacci retracement of the $1.5188/$1.5928 rally at $1.5471. However there is also resistance at the old support of $1.5665 which is just above the 38.2% Fib level at $1.5646. Momentum is just on the bearish side of neutral which is not massively surprising given a slight negative bias on the recent daily candles, whilst there has been a tendency for the support to come under more of the pressure. If I were to be pushed it looks like the technicals are setting up for a downside break of support, whilst the importance of the 50% Fib level support is growing. However, beware the false downside break, confirmation should be sought first.
USD/JPY
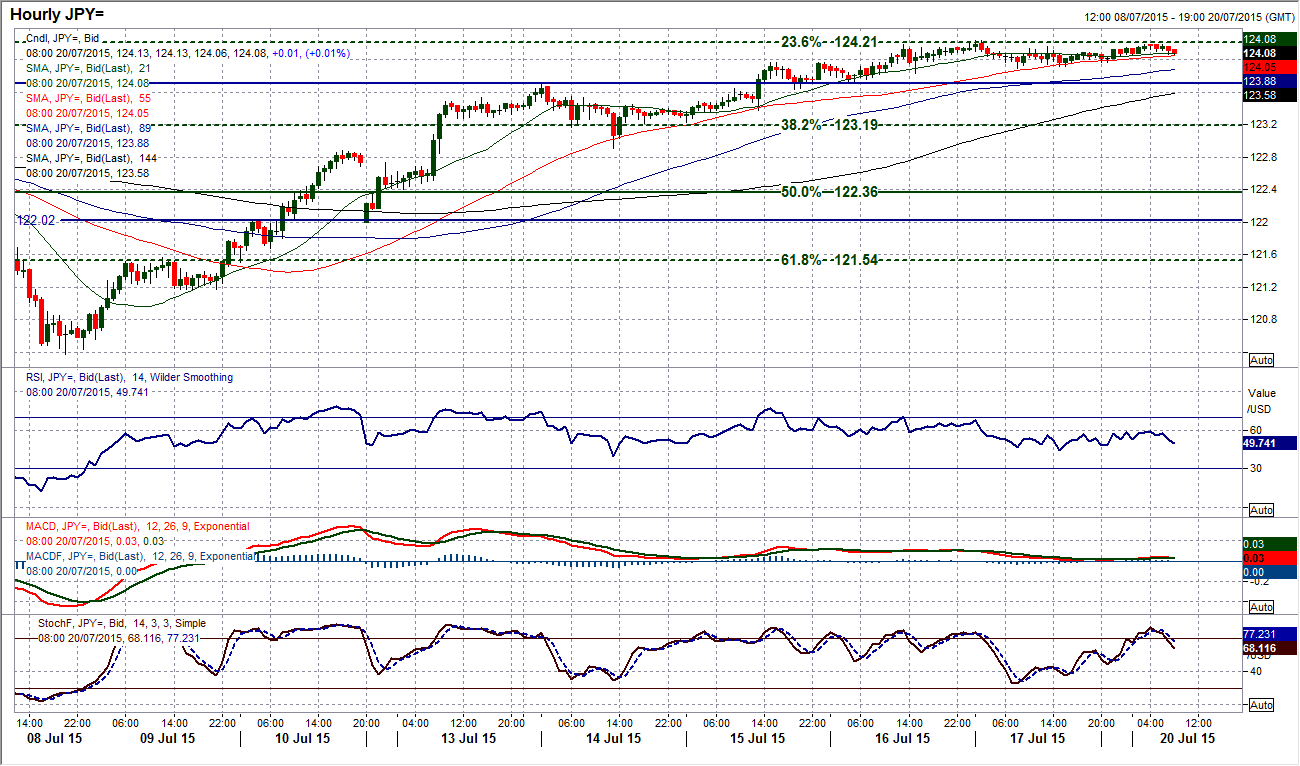
Dollar/Yen continues to bash up against the key overhead resistance band but as yet to no avail. The 23.6% Fibonacci retracement of 118.86/125.85 comes in at 124.20 and this has been capping the upside now into its third session. There is also the overhead resistance of the key mid to late June highs at 124.43. The bulls may begin to get a touch anxious about proceedings if the momentum indicators begin to turn lower though. The daily RSI is still unable to break above 60, which I see as being a watershed point in this rally. Also the Stochastics are beginning to lose impetus. However, the intraday hourly chart continues to show a mildly positive move higher, which is being supported still by the rising 55 hour moving average (c. 124.04) but this is rapidly moving to a stage at which something is going to have to give. This could therefore be an important day in the health of this bull move. Initial support levels need to hold around 123.70.
Gold
The gold price has just accelerated lower in the past few days and is now under huge selling pressure. I spoke repeatedly about the support at $1142.85 but once that key level was breached the floodgates have opened. There was barley a flinch as $1131.85 was tested on Friday afternoon. Despite a close slightly above the support, the Asian session today has seen it wiped out by $45 of downside and the gold price is now trading at levels not seen since March 2010. The momentum is clearly enormously bearish and the RSI is also back around record lows, although MACD and Stochastics have further downside in them. The hourly chart interestingly shows that all the selling pressure has come in just one hourly candle today (in fact the sell-off lasted around just one minute!), and since then the price has rebounded from $1088 and settled down. A closing price well below $1131.85 would be deemed to be bearish and a confirmation of the sell-off. Trading on a day like today can be dangerous as it will be interesting to see if the European session continues to add to the downside pressure. The next support is the $1185.00 March 2010 low, with $1143.75 from February 2010 seen as key low.
WTI Oil
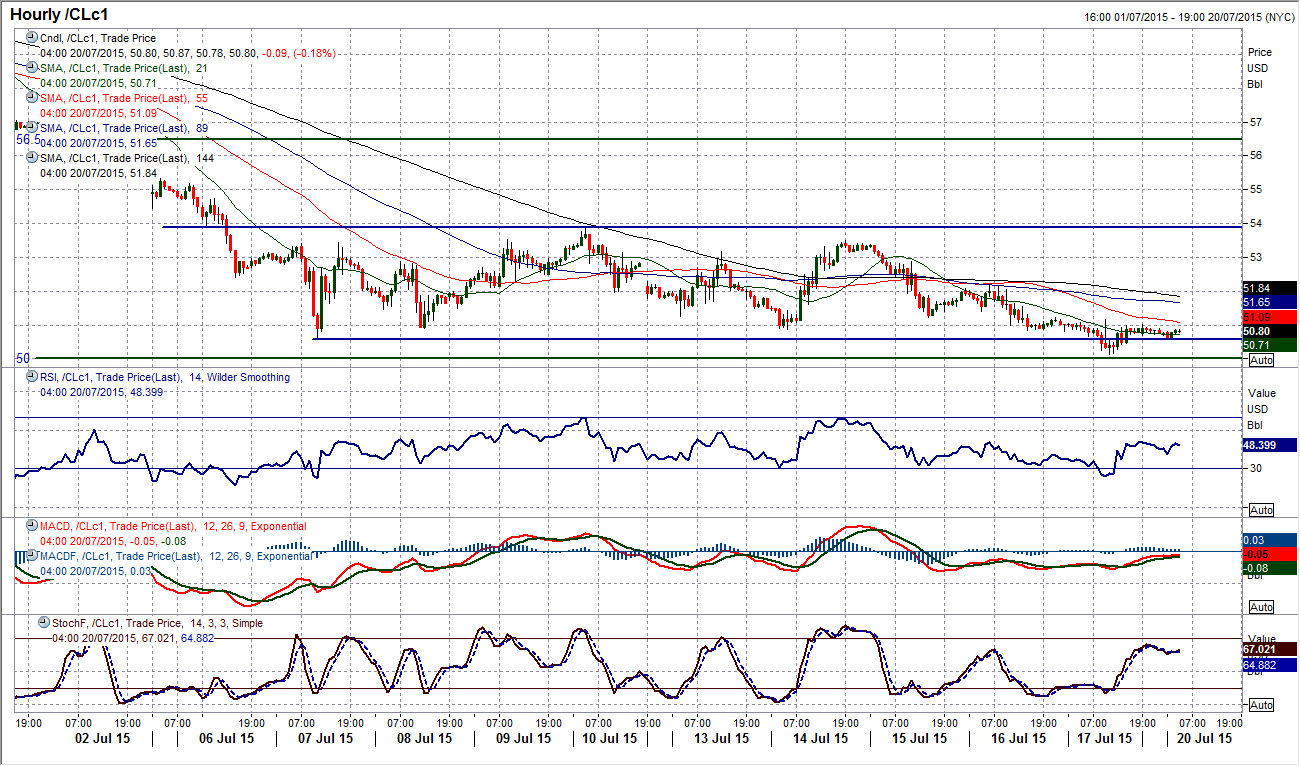
The consolidation which lasted for almost two weeks has been broken. A move below the support around $50.60 has completed the downside break. The cautious traders might be looking for a closing breakdown (still yet to be confirmed) but the deterioration in the momentum indicators suggests that the bears are really in control now. The RSI and Stochastics are looking especially bearish, whilst the MACD lines are also negative and all are showing further downside potential. The immediate target is $49.00 from the 3 month range breakdown, however there is another downside target from the near term range break below $50.60, which gives an implied move to $47.30 which is just above the next real basis of support at $47.00. Rallies will be seen as a chance to sell with resistance now $51.25/$52.20.
Note: All information on this page is subject to change. The use of this website constitutes acceptance of our user agreement. Please read our privacy policy and legal disclaimer. Opinions expressed at FXstreet.com are those of the individual authors and do not necessarily represent the opinion of FXstreet.com or its management. Risk Disclosure: Trading foreign exchange on margin carries a high level of risk, and may not be suitable for all investors. The high degree of leverage can work against you as well as for you. Before deciding to invest in foreign exchange you should carefully consider your investment objectives, level of experience, and risk appetite. The possibility exists that you could sustain a loss of some or all of your initial investment and therefore you should not invest money that you cannot afford to lose. You should be aware of all the risks associated with foreign exchange trading, and seek advice from an independent financial advisor if you have any doubts.
Recommended Content
Editors’ Picks
EUR/USD clings to daily gains above 1.0650

EUR/USD gained traction and turned positive on the day above 1.0650. The improvement seen in risk mood following the earlier flight to safety weighs on the US Dollar ahead of the weekend and helps the pair push higher.
GBP/USD recovers toward 1.2450 after UK Retail Sales data

GBP/USD reversed its direction and advanced to the 1.2450 area after touching a fresh multi-month low below 1.2400 in the Asian session. The positive shift seen in risk mood on easing fears over a deepening Iran-Israel conflict supports the pair.
Gold holds steady at around $2,380 following earlier spike

Gold stabilized near $2,380 after spiking above $2,400 with the immediate reaction to reports of Israel striking Iran. Meanwhile, the pullback seen in the US Treasury bond yields helps XAU/USD hold its ground.
Bitcoin Weekly Forecast: BTC post-halving rally could be partially priced in Premium

Bitcoin price shows no signs of directional bias while it holds above $60,000. The fourth BTC halving is partially priced in, according to Deutsche Bank’s research.
Week ahead – US GDP and BoJ decision on top of next week’s agenda

US GDP, core PCE and PMIs the next tests for the Dollar. Investors await BoJ for guidance about next rate hike. EU and UK PMIs, as well as Australian CPIs also on tap.
