Market Overview
Today is almost certainly the day that Greece will default on its IMF repayment of €1.6bn. The IMF may not necessarily treat it as an outright default yet as it will still want to get its money back, however this is the reality of dealing with the leftist Syriza government that is advising the Greek public to vote “No” in Sunday’s referendum on whether to acquiesce to the terms laid out by the negotiators. With the current bailout programme also expiring today it is difficult to see how Greece can remain part of the Eurozone if it votes “No”. Markets have been extremely volatile in the past day or so, and it is likely to continue today (although not to such a great extent). The incredible swings on the euro, equity markets such as the DAX and CAC, and the yields on Eurozone sovereign debt reflect this volatility.
Wall Street closed sharply lower last night, with the S&P 500 down 2%. Asian markets have shown an element of stability with the Nikkei 225 actually higher by 0.6%, however this has not prevented further weakness at the open on European indices, although the downside has so far been fairly constrained. I always say that the day after a huge move is just as important as if traders are still selling in the cold light of the new day then there is something to be concerned about.
In forex markets the volatility on the euro continues, whilst the yen is being favoured again. There is a mix of performance on the commodity currencies, with the Kiwi notably underperforming again. The desire for safe haven plays is still not benefitting gold too much with a further dip back this morning.
Aside from positioning over Greece, traders will be looking out for the final reading of UK GDP for Q1 at 0930BST, which is expected to be confirmed at +0.4%. Also the flash reading for Eurozone CPI will be interesting at 1000BST, after the German reading was a slight disappointment, this may put pressure on the Eurozone flash estimate of +0.2%. US consumer confidence is also at 1500BST and is expected to pick up to 97.3 (from 95.4).
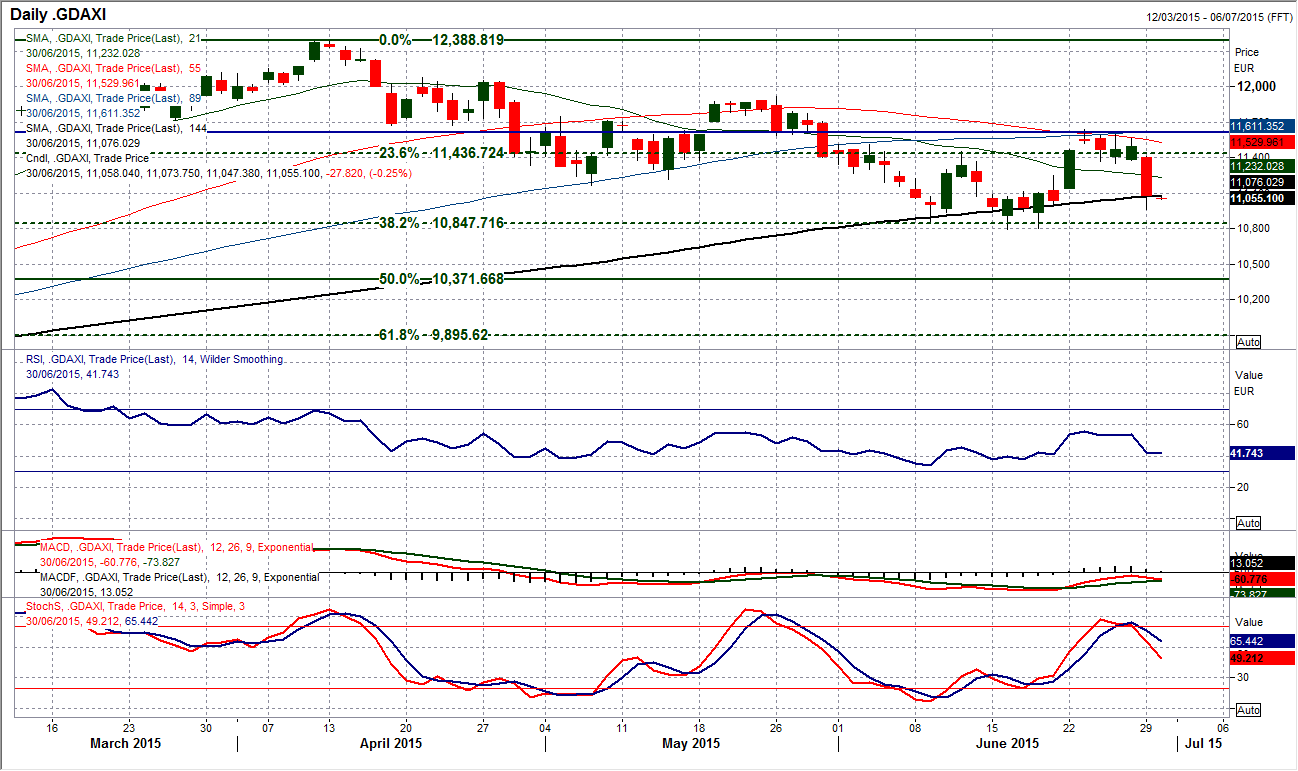
Chart of the Day – DAX Xetra
Whilst yesterday’s move was not technically driven, clearly it has had a significant impact on the chart. Volatility on the DAX was high even before yesterday’s sharp move but the bearish candle formed the biggest selling day since late April. With the market again under early selling pressure again today, the support around 11,800 is the big focus. The day following a huge sell-off is very important as with the cold light of day, if the selling pressure continues (to form another bearish candle) then the bulls are in trouble. The daily momentum indicators turning corrective (especially the Stochastics) will not help whilst the hourly momentum indicators are corrective but are also showing further downside potential. The intraday rebound high yesterday has left resistance at 11,288, which is a reflection of the volatility still playing out on the DAX (that is almost 200 ticks above the closing price). While the DAX remains volatile it is difficult to call direction, however another bearish candle today would be a significant concern for the major support around 10,800.
EUR/USD
In the context of the daily chart, yesterday’s rebound was staggering. The early morning sell-off which saw the euro down 200 pips subsequently then saw a rally that lasted almost to the close. Not only was the initial opening gap down closed (which is a bullish signal anyway) but the euro also completed a massive bullish engulfing candle (bullish key one day reversal). The big question is whether to trust this as a bullish signal. I always say that the day after a huge candle is just as important, as it is a confirmation candle. Currently the euro is back lower again and the confirmation is not coming through. We must be cautious then. The daily chart shows a mix of neutral momentum indicators. The intraday hourly chart shows that the pull higher from yesterday needs to now find support in the $1.1130/$1.1150 band today to at least give the bulls a good grounding for this rebound, otherwise it will just drift off again. We are still seeing the euro settle down after incredible volatility yesterday, where the technicals have been thrown all over the place.
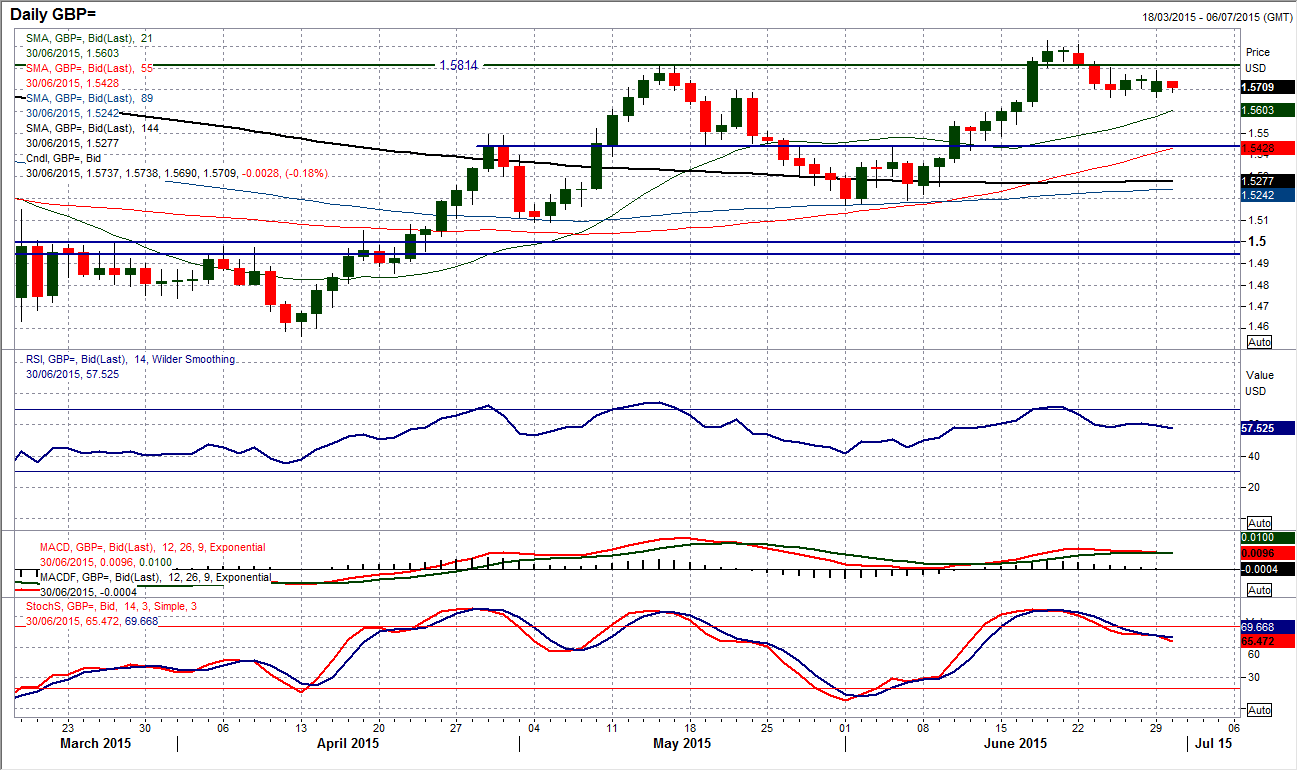
GBP/USD
In comparison to the euro, Cable has been in consolidation mode now for the past five days. A range of around 130 pips has contained trading in the past week and there is little real direction being obtained from the daily chart. The momentum indicators are fairly stable although there is a slight negative drift on the Stochastics. I see this as playing out a near term correction which is unwinding some of the bull run of early June. For now though the intraday hourly chart is showing a similar outlook to the daily, with rangebound consolidation and little real sign of direction. Support comes in at $1.5665, although with resistance still forming below the $1.5800 neckline I still see this as likely to be a consolidation within a near term corrective move. A close below $1.5665 would continue the move, and I am anticipating the next key low to come in above the key support at $1.5450.
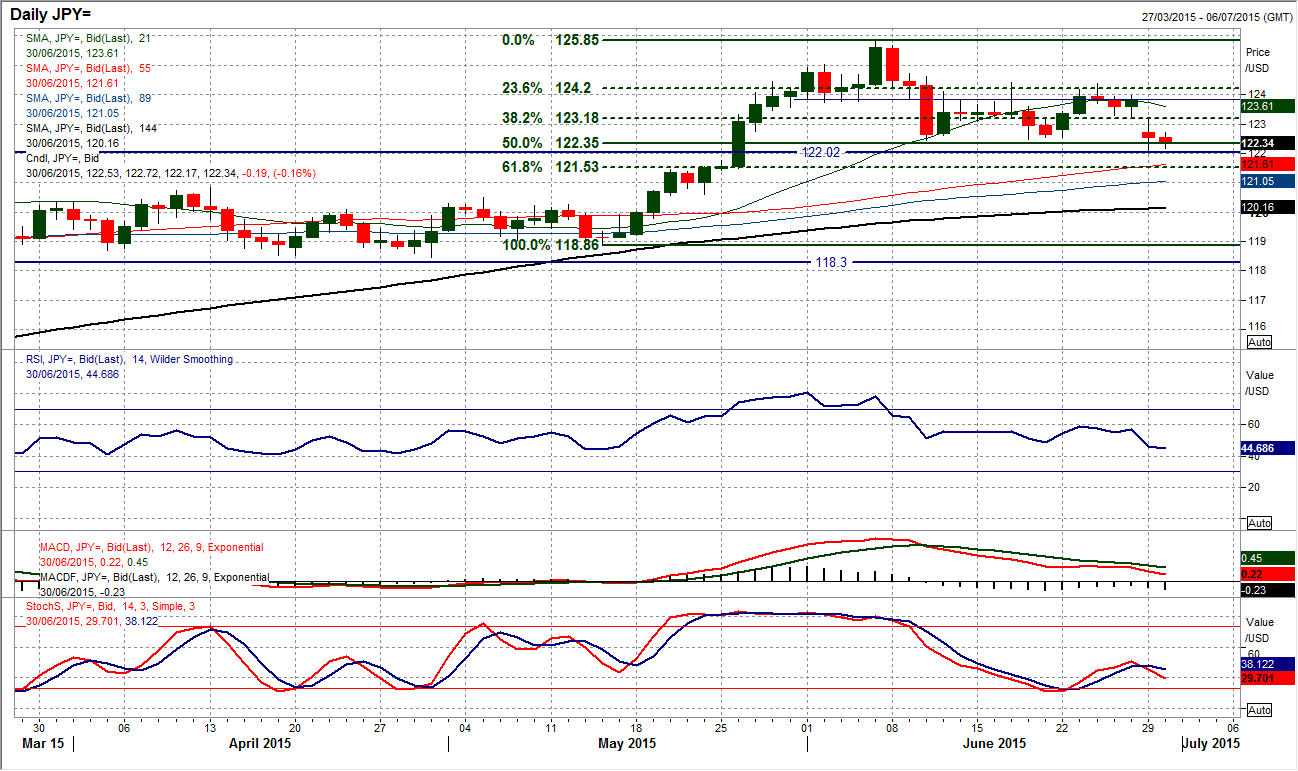
USD/JPY
The safe haven flows from the Greek “crisis” have sustained demand for the yen and this has continued overnight. The gap down yesterday was filled at 123.20 and the candle that was left reflects the volatility of the day yesterday. However I still see this as part of the move that is going to result in the posting of the next key low around 122.00 which is the old key breakout above the March high. Despite yesterday’s selling pressure on Dollar/Yen the 122.00 breakout support is intact and whilst this remains on a closing basis I will remain rather upbeat about this chart. The momentum indicators are corrective without being overly negative. The intraday hourly chart is interesting as to the continued use of the Fibonacci retracement levels of the 118.86/125.85 bull run. These are still used as turning points intraday with 50% at 122.35 and 38.2% at 123.20 acting as key levels to watch.
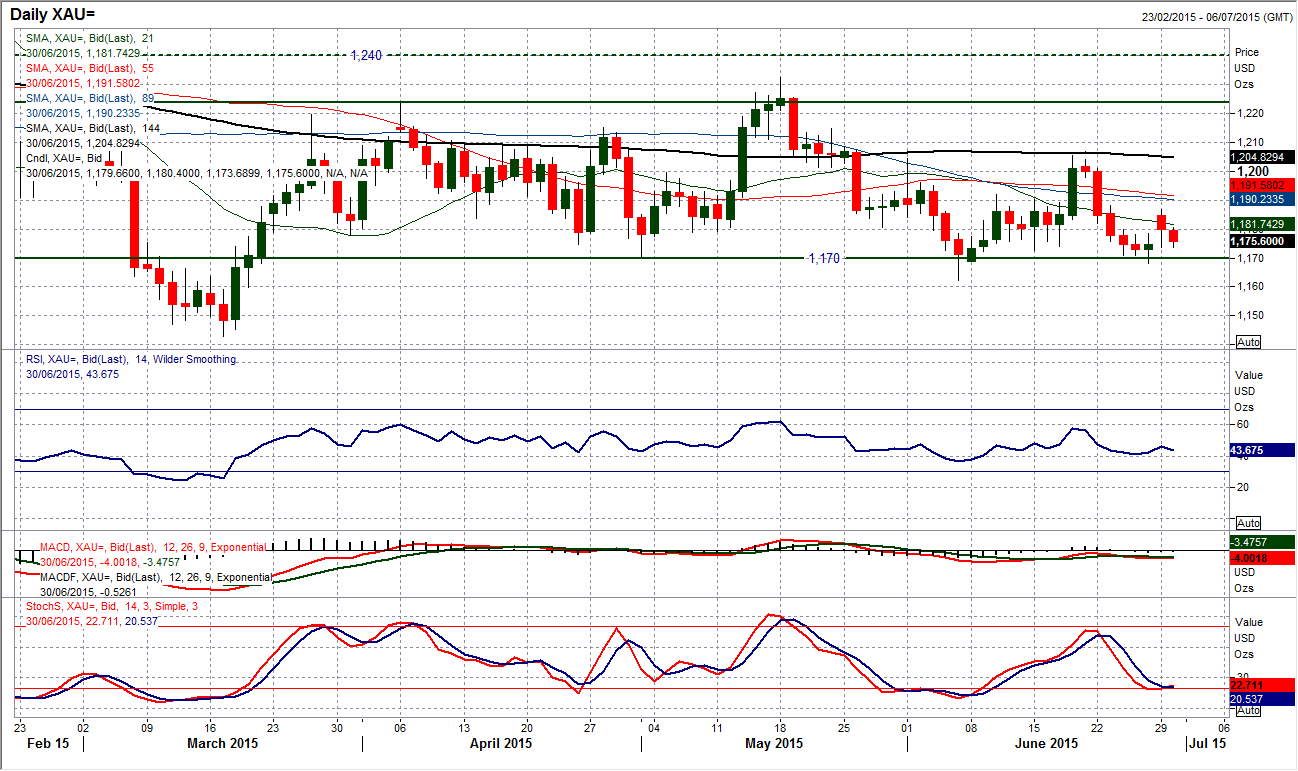
Gold
There were a lot of gaps that were filled yesterday (normally a sign of a continuation of the move) and gold was another where this was the case. However the move on gold certainly does not have a bullish look to it, especially as the follow up candle today is weaker as well. Analysis of yesterday’s trading would suggest that the bulls never really had a grasp on trading, and I see the drift back lower today as part of this. The fact that gold has pulled higher from the support bad around $1170 (a level that has been gradually drifted lower over the past few weeks) within this trading band should be a positive, but there is still a corrective look to the chart. Six of the past seven candles have all had a negative outlook and suggest that the bears are in charge even if they are unable to pull the gold price sharply lower. This would suggest using rallies as a chance for short term selling positions. Yesterday’s rebound high at $1186.90 is now the resistance. The intraday hourly chart is not quite as negative as the daily chart but is still showing the downside pressure. A move back below $1175 support would suggest a retest the range support around $1170 and below that would test the June low at $1162.35 again.
WTI Oil
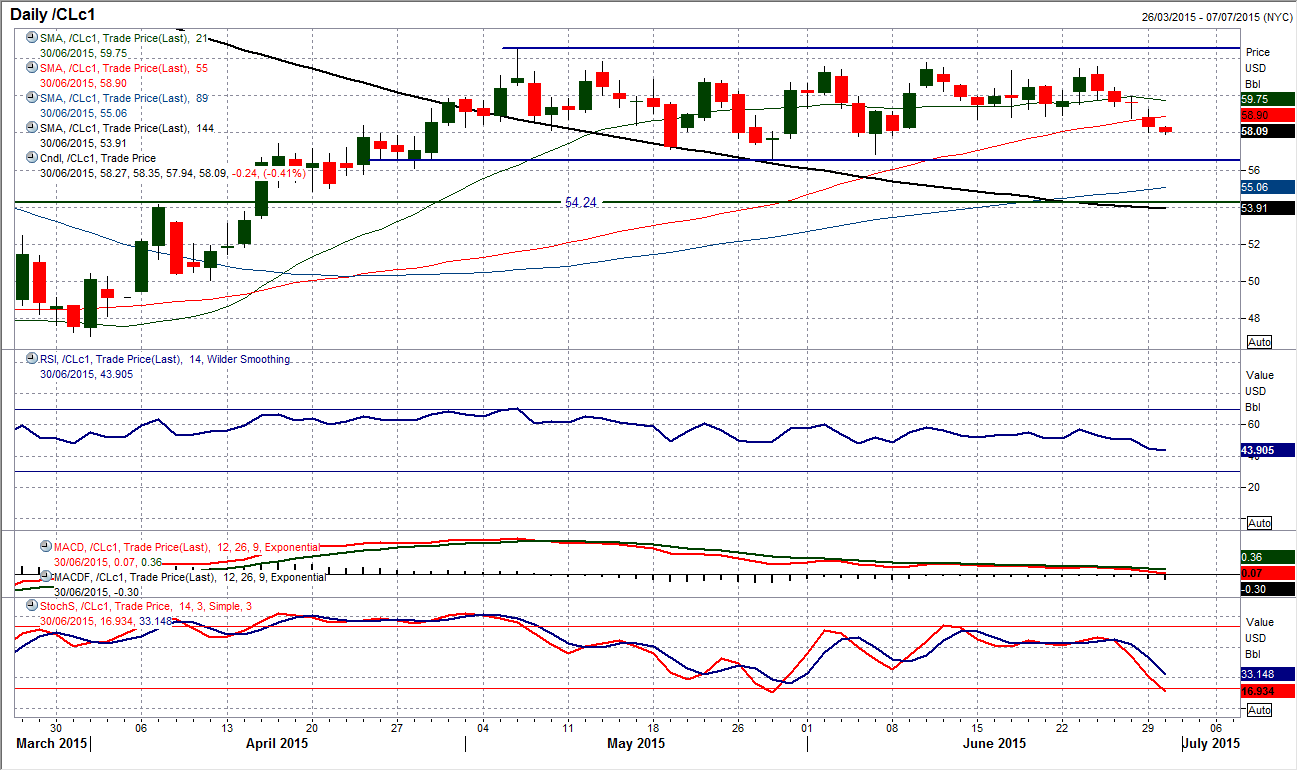
With the decisive breach of the 61.8% Fibonacci retracement at $58.74 the outlook has taken a turn for the worse. This has now taken the WTI price to a three week low and is adding pressure to the corrective outlook. With hourly momentum indicators bearishly configured (hourly RSI consistently at or below 30, MACD lines consistently under zero and Stochastics also weak), the suggestion is that the bears have finally started to grab control. Intraday rallies have been sold into and a full retracement back towards $56.83 is seen. The resistance band between the 61.8% and 50% Fibonacci levels at $58.74/$59.33 is now a sell-zone for near term shorting opportunities. It would need a move above $60 to confirm the change to a more positive outlook within the range once more.
Note: All information on this page is subject to change. The use of this website constitutes acceptance of our user agreement. Please read our privacy policy and legal disclaimer. Opinions expressed at FXstreet.com are those of the individual authors and do not necessarily represent the opinion of FXstreet.com or its management. Risk Disclosure: Trading foreign exchange on margin carries a high level of risk, and may not be suitable for all investors. The high degree of leverage can work against you as well as for you. Before deciding to invest in foreign exchange you should carefully consider your investment objectives, level of experience, and risk appetite. The possibility exists that you could sustain a loss of some or all of your initial investment and therefore you should not invest money that you cannot afford to lose. You should be aware of all the risks associated with foreign exchange trading, and seek advice from an independent financial advisor if you have any doubts.
Recommended Content
Editors’ Picks
AUD/USD posts gain, yet dive below 0.6500 amid Aussie CPI, ahead of US GDP

The Aussie Dollar finished Wednesday’s session with decent gains of 0.15% against the US Dollar, yet it retreated from weekly highs of 0.6529, which it hit after a hotter-than-expected inflation report. As the Asian session begins, the AUD/USD trades around 0.6495.
USD/JPY finds its highest bids since 1990, approaches 156.00

USD/JPY broke into its highest chart territory since June of 1990 on Wednesday, peaking near 155.40 for the first time in 34 years as the Japanese Yen continues to tumble across the broad FX market.
Gold stays firm amid higher US yields as traders await US GDP data

Gold recovers from recent losses, buoyed by market interest despite a stronger US Dollar and higher US Treasury yields. De-escalation of Middle East tensions contributed to increased market stability, denting the appetite for Gold buying.
Ethereum suffers slight pullback, Hong Kong spot ETH ETFs to begin trading on April 30

Ethereum suffered a brief decline on Wednesday afternoon despite increased accumulation from whales. This follows Ethereum restaking protocol Renzo restaked ETH crashing from its 1:1 peg with ETH and increased activities surrounding spot Ethereum ETFs.
Dow Jones Industrial Average hesitates on Wednesday as markets wait for key US data

The DJIA stumbled on Wednesday, falling from recent highs near 38,550.00 as investors ease off of Tuesday’s risk appetite. The index recovered as US data continues to vex financial markets that remain overwhelmingly focused on rate cuts from the US Fed.
