Market Overview
The remarkable on/off saga over the possible deal that seems to be close (or not) between Greece and its creditors has had a significant impact on the markets. The improvement in sentiment on equities and also the euro, whilst also pulling the yields on Greek debt lower, would suggest that the market is increasingly confident that a deal will e struck. Also it would suggest that the reaction will be a strong positive one. The fact that there was no retracement in the move, despite the denial of the European Commission that a deal was imminent was also interesting and may well now be supportive for the euro which has come under significant strain in recent days.
Wall Street closed strongly yesterday up 0.9% and back close to the all-time highs once more. Asian markets were mixed to slightly lower with the Japanese Nikkei 225 one of the few markets to muster gains as it rallied 0.3% despite the huge weakness in the yen over the past few days. The European session has begun in slightly negative mode. although as some of the gains from yesterday are just being given back.
In forex trading there is an element of consolidation on the dollar, although the rebound on the euro has continued overnight, albeit not as prominently as yesterday. The Aussie dollar is the worst performer today of the majors, after Australian private capital expenditure missed expectations overnight. Precious metals prices are mixed.
Traders have a mix of politics and economics on their plate today. The second reading of UK Q1 GDP is expected to be revised slightly higher to+ 0.4% (from +0.3%) at 0930BST. US weekly jobless claims are at 1330BST and are expected to improve slightly to 272,000 (from 274,00 last week) and pending home sales at 1500BST which are expected to improve by 0.8% on the month. Today is also the second day of the G7 meeting.
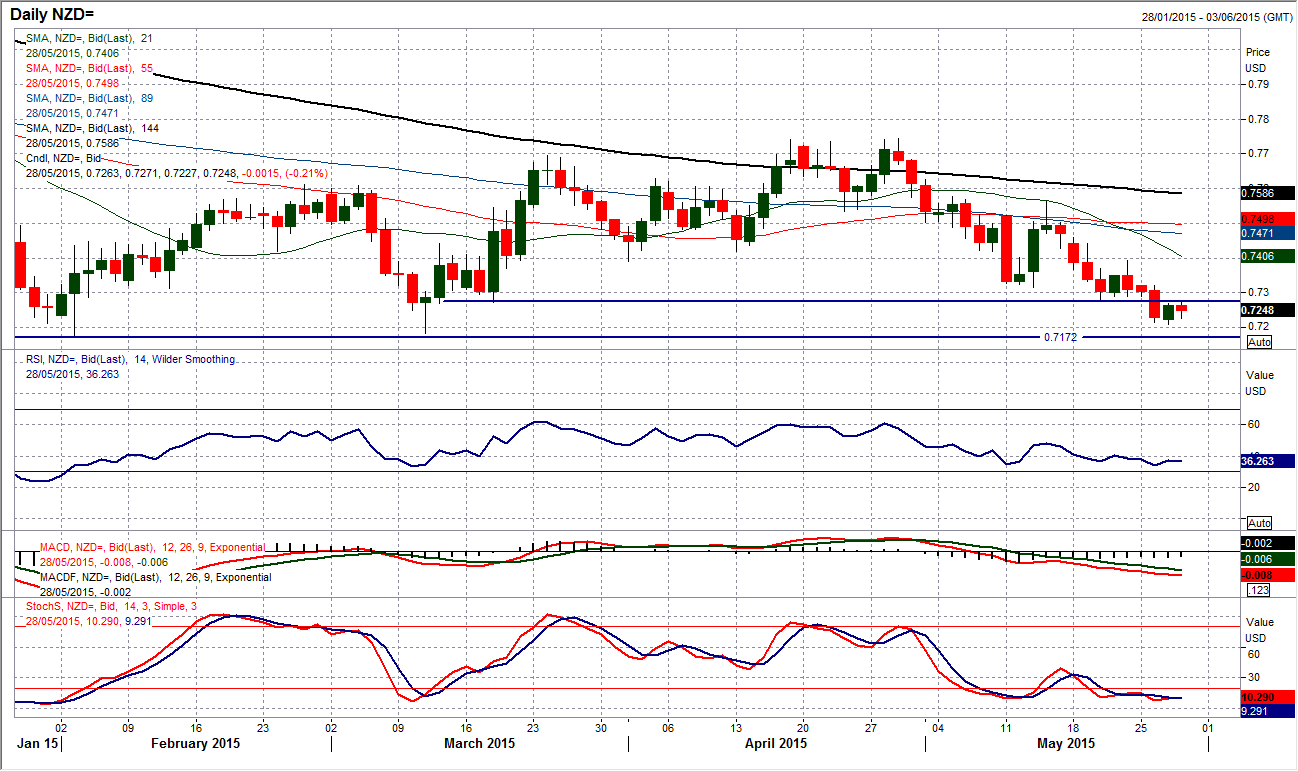
Chart of the Day – NZD/USD
In the past few months the Kiwi has dropped towards $0.7200 on two separate occasions, and both times there was a reversal signal that started off a rally. In February there was a bullish key one day reversal from $0.7174 and in March was a bull hammer from $0.7182. Yesterday we have seen a low at $0.7208, but so far there has been a lack of any significant reversal signal. The daily momentum indicators all remain in bearish configuration and as yet there is nothing to really suggest that the bulls are ready to spring back into life. The hourly chart shows a consolidation between $0.7208/$0.7268 with slight positive divergences on the momentum. However, there is significant overhead resistance between $0.7290/$0.7320 which is holding back a recovery. With the bearish trend still in force over the past few weeks, it seems as though there is likely to be further pressure on the old support around $0.7200 in due course (the Feb low at $0.7172).
EUR/USD
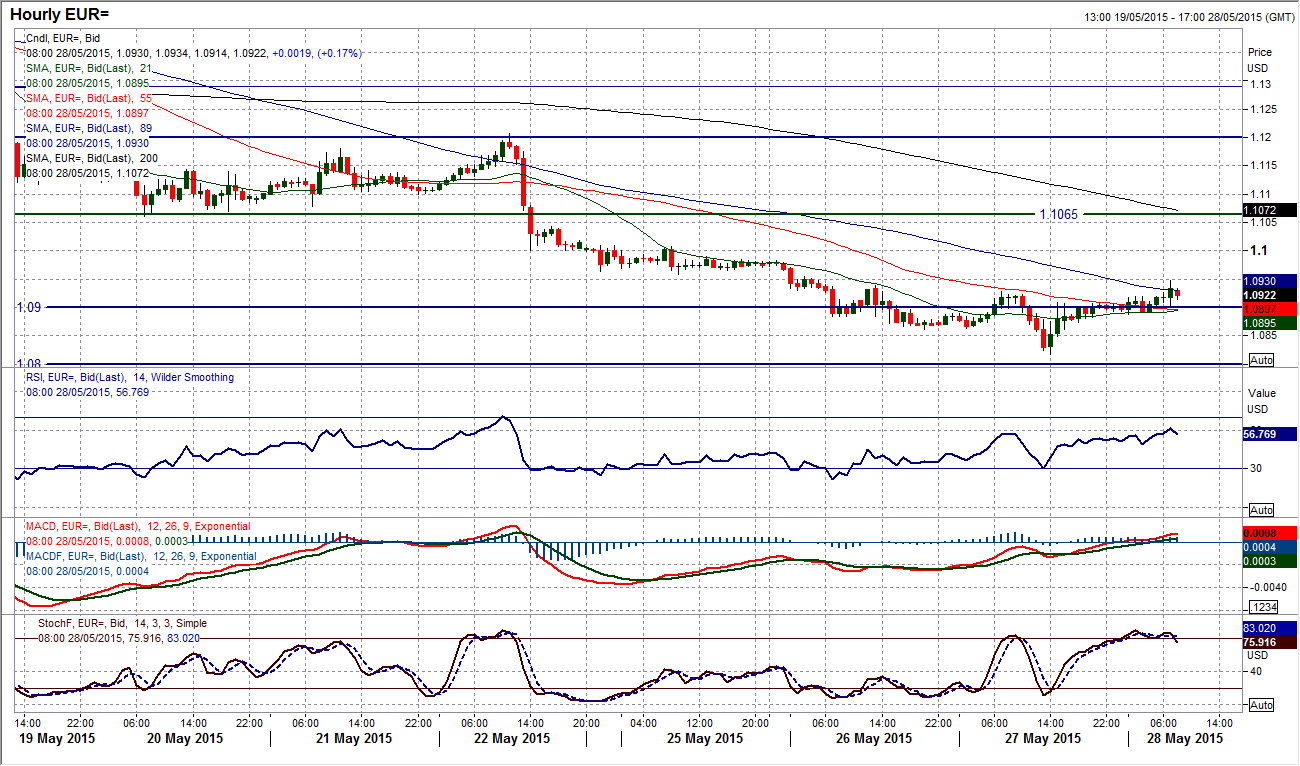
Could this be the start of a near term turnaround in sentiment on the euro? The first really positive candlestick was formed for the first time in almost two weeks yesterday. This has resulted in a bullish crossover in the Stochastics (a buy signal would now come on a move back above 20 on the momentum indicator). So, there is certainly the beginning of something, now there needs to be a positive day today to back up the improvement of yesterday. The hourly chart shows there has been a consolidation around the old $1.0900 pivot level overnight and the early European session is seeing the euro catch a bid and is now pushing higher on a move towards the $1.0960/$1.1000 band of resistance. As yet there is no real suggestion that the hourly momentum is showing anything more than another technical rally from the $1.0818 low, whilst the real test would be to negotiate the $1.1065 key resistance as any rally would merely be seen as counter to the bigger sell-off until that key level was tested. However, for now the euro is looking to rebound.
GBP/USD
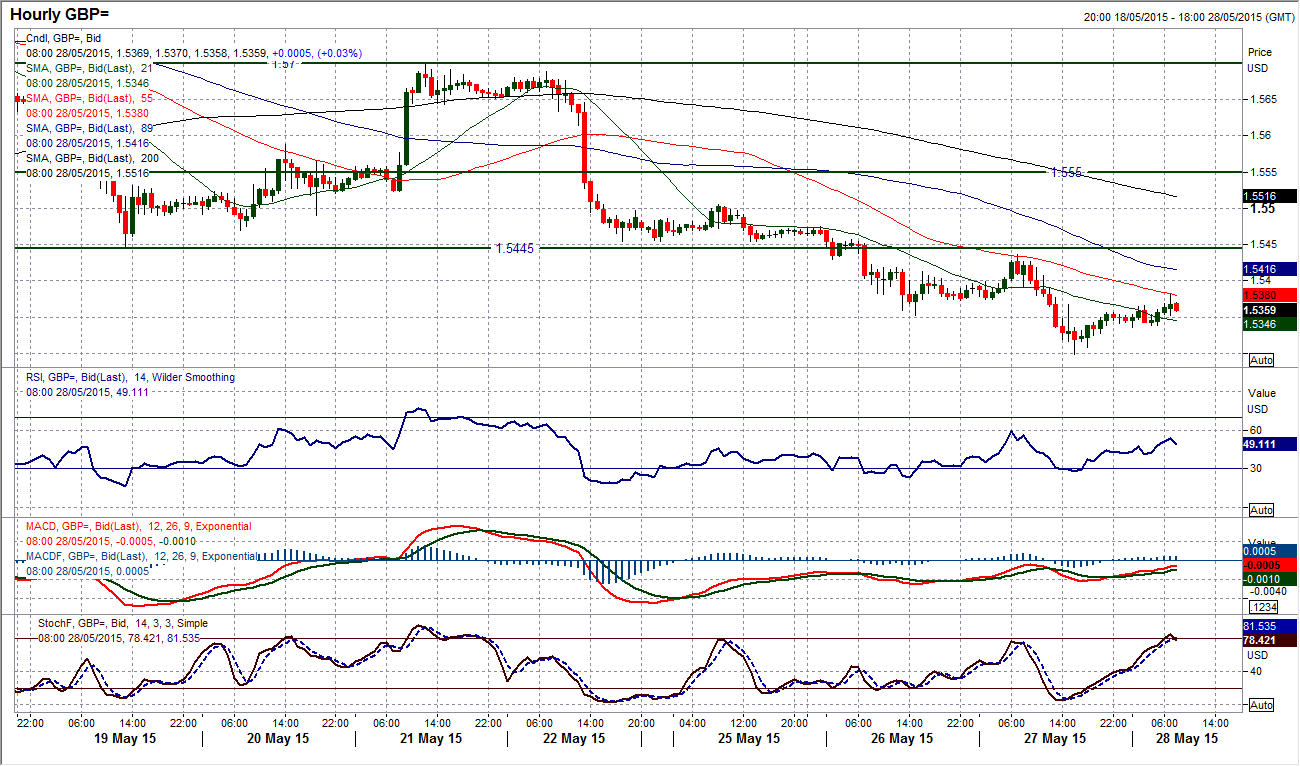
With a selling sequence that has left a lower key high at $1.5700 and a breakdown of the low at $1.5445, the downside momentum on Cable continues to progress. The technical studies are backing this too, with the RSI, MACD lines and Stochastics all in corrective configuration. However there are signs perhaps of a near term technical rally within the decline. A bounce from yesterday’s low at $1.5300 has continued into today. However, looking at the intraday hourly chart, the rebound has yet to do anything to suggest that the sellers are not still in control. The overhead resistance at $1.5437 (interestingly just below the latest key breakdown of $1.5445) is the initial level that needs to be breached for there to be any realistic prospect of a near term recovery. The hourly momentum indicators remain bearishly configured and suggest that rallies are still a chance to sell for a retest of the $1.5300 low. There is further support around $1.5160 and $1.5088.
USD/JPY
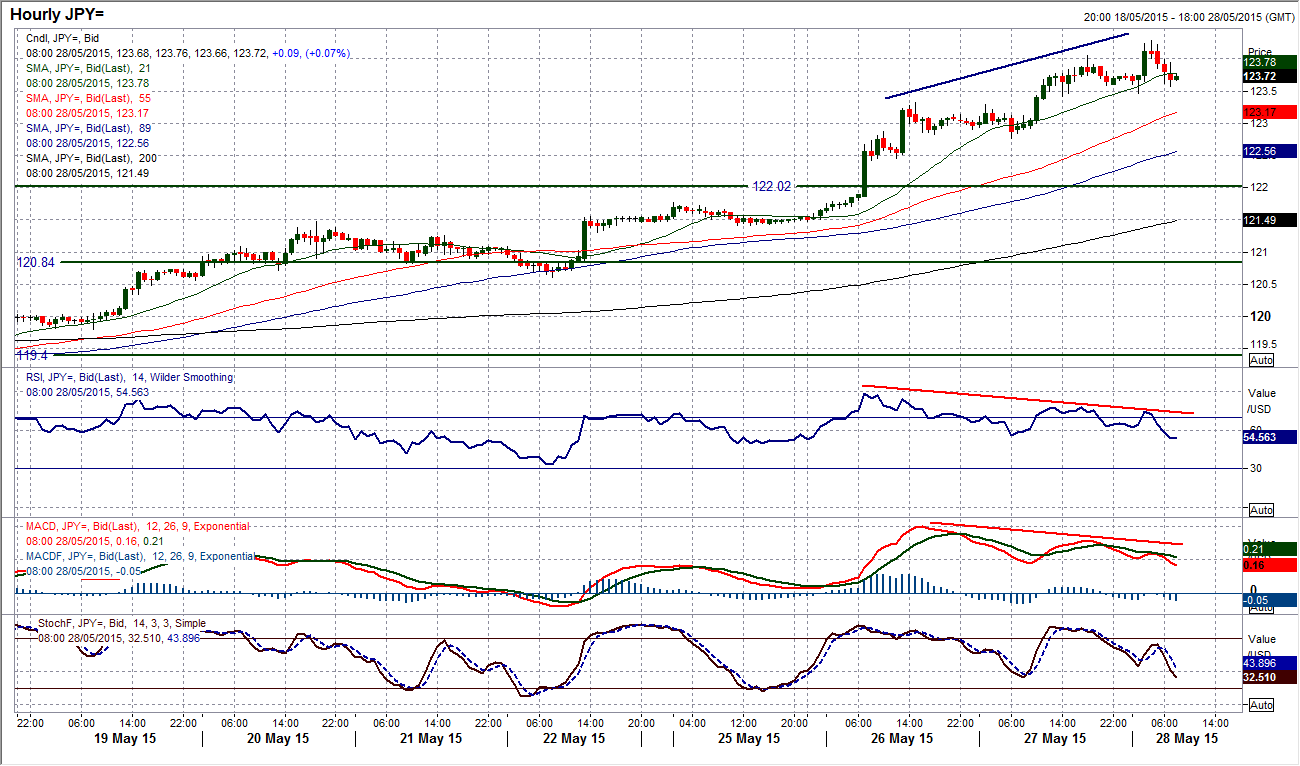
The huge breakout on Dollar/Yen has the impetus behind it. The move has now resulted in a break above the key 2007 high at 124.15 (albeit briefly overnight). The daily momentum indicators remain strong and are backing the move. There is a slight caveat coming into the European session with a correction off the high overnight. I am also aware that the hourly chart is now showing a series of bearish divergences with the highs in recent days, especially on the RSI and MACD lines. This would suggest that perhaps the impetus in the move higher is beginning to slow down. If the hourly RSI begins to drop below 50 and the MACD lines fall to a new 3 day low this could be a signal of a change in sentiment now. A drop below the support band at 123.30/123.50 would also be a sign. Near term support below there comes at 122.75 and 122.50 before the big breakout level at 122.00. Essentially above the overnight high at 124.28 there is no real resistance until the 125.70 upside breakout implied target.
Gold
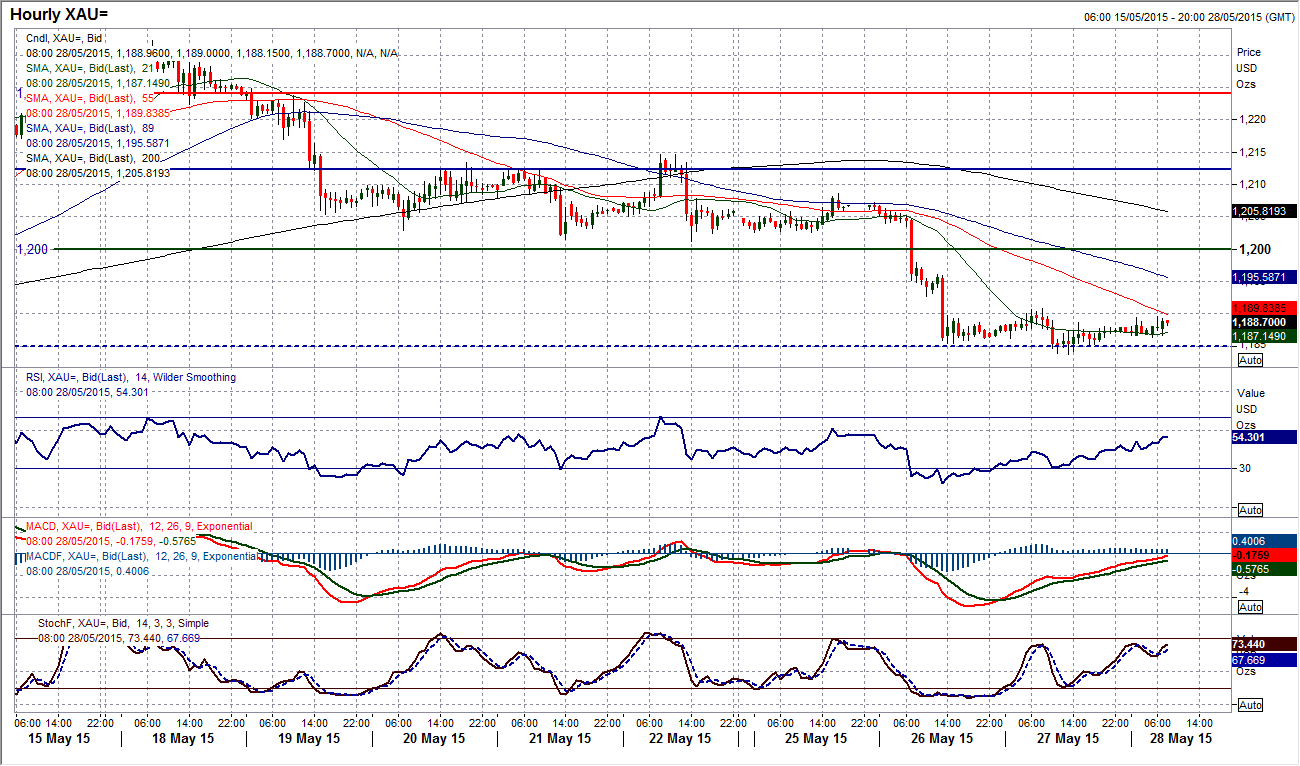
Considering the moves on other markets such as forex, equities and bonds yesterday, there was a remarkable lack of movement on gold yesterday. Coming after such a strong bearish candle, a small ranged “doji” candle reflects uncertainty with the recent move. This uncertainty is coming around the $1185 pivot level and is just holding back some of the bearish intra-range momentum. This consolidation is though helping to unwind some of the oversold momentum built up on the intraday hourly chart, but without any sign of a pick up in the price this is not necessarily a positive. There is still downside pressure on gold and with overhead resistance at $1192.60 and $1196 the move towards a test of the range supports that come in at $1179 is still likely. However I also believe that gold looks unlikely still to break the range lows. For now I am happy to continue to play the range.
WTI Oil
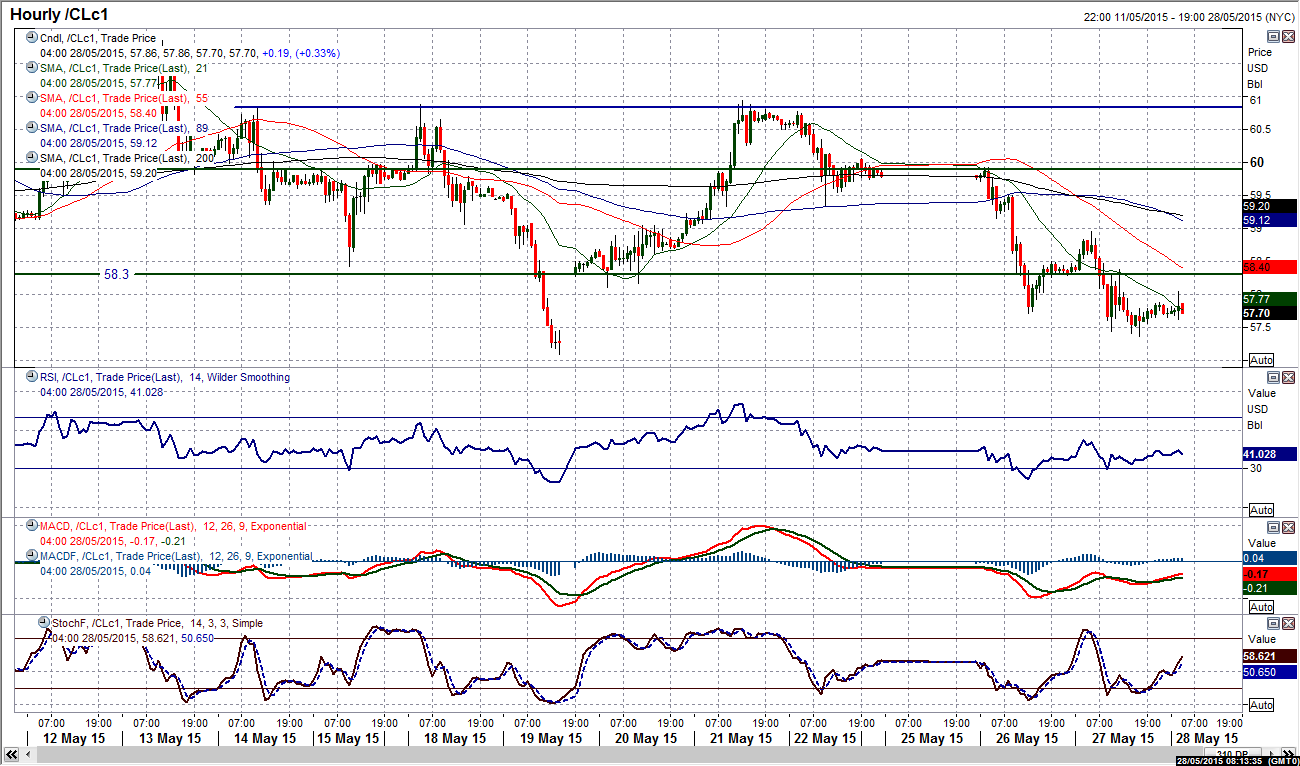
The outlook remains corrective on a near to medium term basis after the posting of another negative daily candle. The drift lower suggests that the support of the May low of $57.09 will again be tested. All momentum indicators continue to fall away and suggest that any intraday rallies will be seen as opportunities to sell. The hourly chart also backs this assertion with hourly RSI and MACD lines bearishly configured. I wrote yesterday about the resistance band $59.00/$59.90 now being in place as the initial sell-zone and with yesterday’s peak at $58.95 this has added weight to this resistance. A breach of the $57.09 opens the $56.06 low as WTI moves ever closer to a full retracement back towards the key old neckline support at $54.25.
Note: All information on this page is subject to change. The use of this website constitutes acceptance of our user agreement. Please read our privacy policy and legal disclaimer. Opinions expressed at FXstreet.com are those of the individual authors and do not necessarily represent the opinion of FXstreet.com or its management. Risk Disclosure: Trading foreign exchange on margin carries a high level of risk, and may not be suitable for all investors. The high degree of leverage can work against you as well as for you. Before deciding to invest in foreign exchange you should carefully consider your investment objectives, level of experience, and risk appetite. The possibility exists that you could sustain a loss of some or all of your initial investment and therefore you should not invest money that you cannot afford to lose. You should be aware of all the risks associated with foreign exchange trading, and seek advice from an independent financial advisor if you have any doubts.
Recommended Content
Editors’ Picks
EUR/USD regains traction, recovers above 1.0700

EUR/USD regained its traction and turned positive on the day above 1.0700 in the American session. The US Dollar struggles to preserve its strength after the data from the US showed that the economy grew at a softer pace than expected in Q1.
GBP/USD returns to 1.2500 area in volatile session

GBP/USD reversed its direction and recovered to 1.2500 after falling to the 1.2450 area earlier in the day. Although markets remain risk-averse, the US Dollar struggles to find demand following the disappointing GDP data.
Gold holds around $2,330 after dismal US data

Gold fell below $2,320 in the early American session as US yields shot higher after the data showed a significant increase in the US GDP price deflator in Q1. With safe-haven flows dominating the markets, however, XAU/USD reversed its direction and rose above $2,340.
XRP extends its decline, crypto experts comment on Ripple stablecoin and benefits for XRP Ledger

Ripple extends decline to $0.52 on Thursday, wipes out weekly gains. Crypto expert asks Ripple CTO how the stablecoin will benefit the XRP Ledger and native token XRP.
After the US close, it’s the Tokyo CPI

After the US close, it’s the Tokyo CPI, a reliable indicator of the national number and then the BoJ policy announcement. Tokyo CPI ex food and energy in Japan was a rise to 2.90% in March from 2.50%.
