Market Overview
With Janet Yellen suggesting that the Fed remains on a fairly steady path towards tightening, the US dollar has just regained the ascendency and is looking to gather momentum again today. With public holidays in many major markets yesterday (especially US, UK and Germany) traders have had some time to digest the Yellen speech and should make a decisive move today. So far this is in the direction of being dollar positive. Equity markets have been in cautious mode amidst light trading yesterday, but there is more of a mixed tone to European trading today. Traders are becoming aware that the next date for Greek repayments is fast approaching (c. €300m to the IMF on 5th June) and as things stand there is still no substantial improvement on a potential agreement between Greece and its creditors over reform proposals.
In forex trading again there is broad US dollar strength across the majors, with the euro under further pressure. Of special note also is that Dollar/Yen has just broken out to new highs dating back to 2007.Interestingly, the commodity currencies (Aussie, Kiwi and Canadian Loonie are performing relatively much better than euro, yen and sterling.
Traders will be focusing on some key US consumer data today (which is an area that has disappointed in recent weeks). The US durable goods orders at 1330BST is expected to come in at +0.4% month on month for ex transport. Then there is the Conference Board’s Consumer Confidence at 1500BST which is expected to just deteriorate slightly to 95 (from 95.2). Also at 1500BST is the New Home Sales data which is expected to improve to 0.51m from 0.48m.
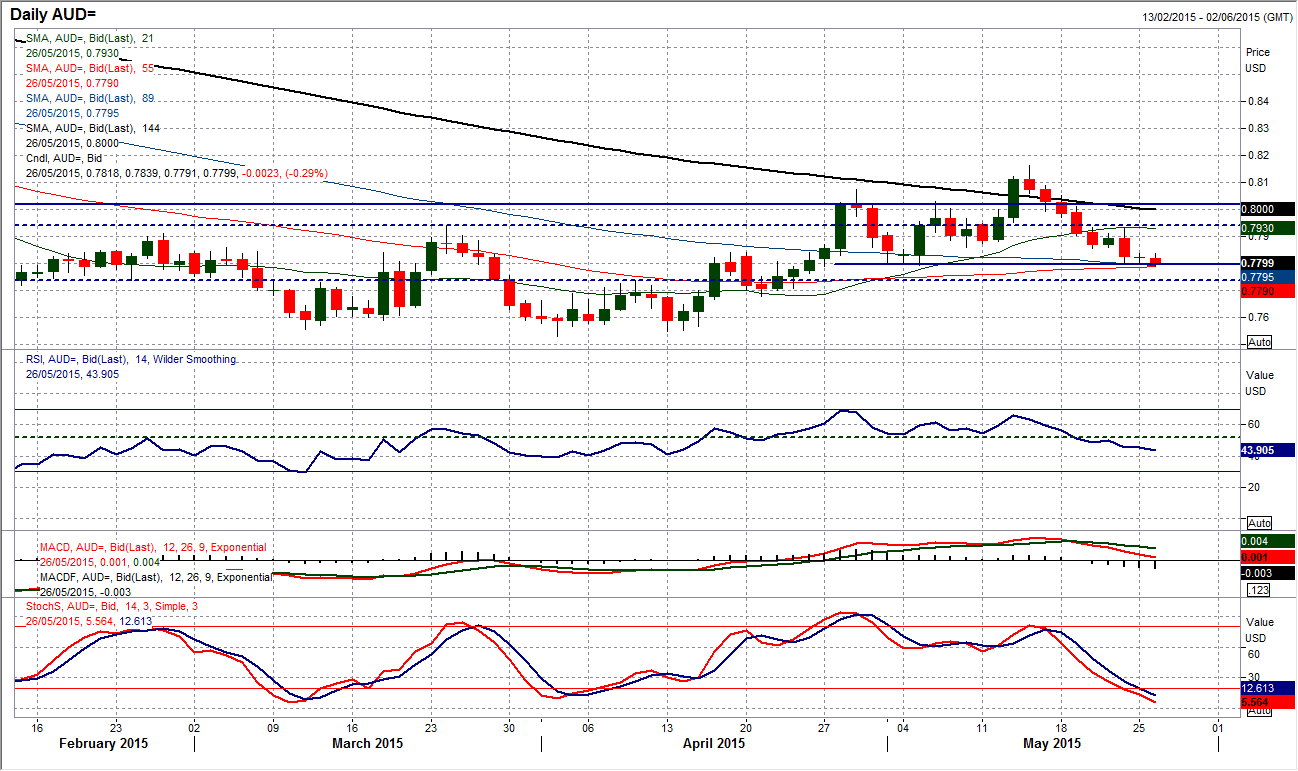
Chart of the Day – AUD/USD
The correction may be into its 9th day with little real sign of any buying pressure, however, there is clearly an important band of support once again forming around the $0.7800 level. As with a sequence of 3 days in early May, there is a testing of the support at $0.7800 that is again yet to be broken. Back then there was arguably a “Morning Doji Star” candlestick set up (although not perfect), and with yesterday’s “doji” following a strong bearish day this is again a possibility today. However, as yet there is no real suggestion on the intraday chart that the buying pressure is mounting, furthermore the impact of the doji yesterday is reduced by the thin trading amid public holidays. Also the pressure on $0.7800 is mounting early in the European session. A breach of $0.7800 would reopen the old support band at $0.7740 once more.
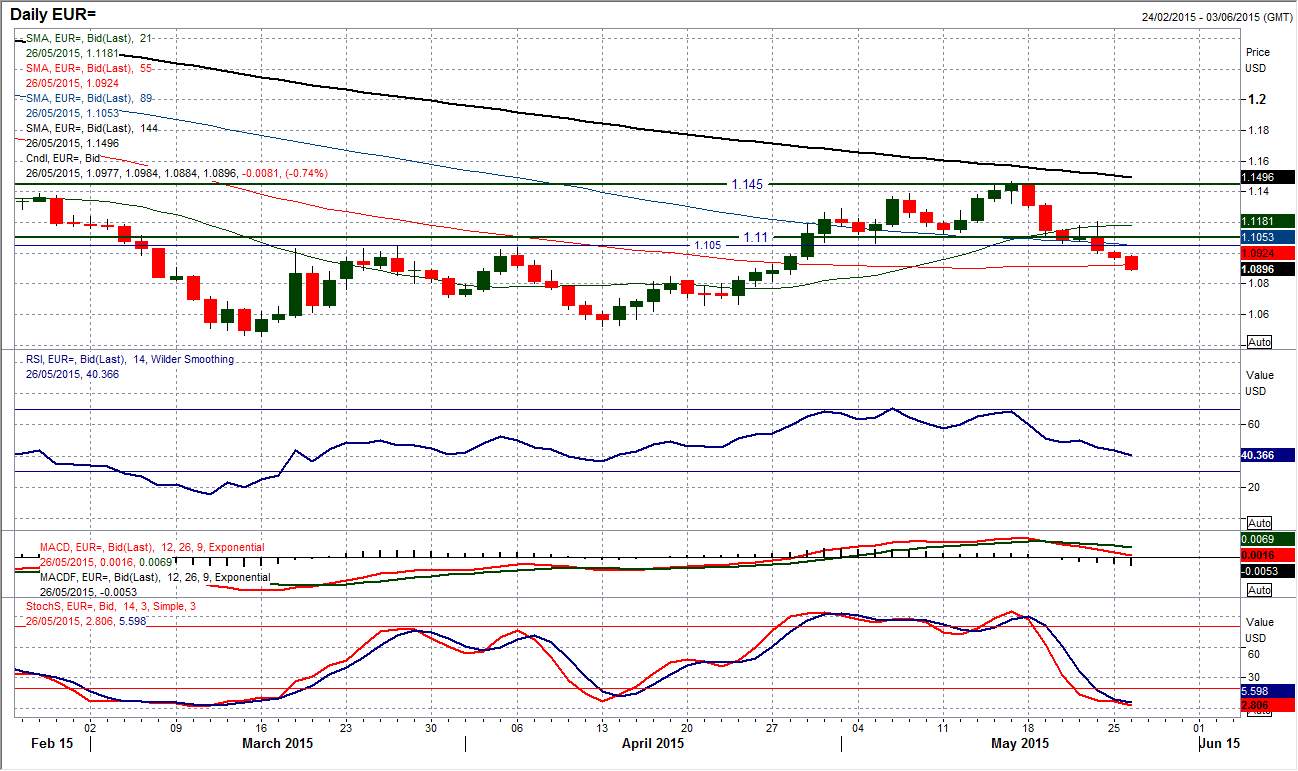
EUR/USD
There has been a definite turnaround in sentiment in the past few days which has resulted in the dollar bulls regaining confidence and is dragging the pair lower. The breakdown on Friday below the key support band $1.1035/$1.1065 was a key development and confirmation of the directional change. Daily momentum indicators are conducive to a correctional play with RSI and MACD now consistently falling, whilst the Stochastics have given a “bear kiss” and also look strongly negative. I now expect the euro retreat to continue now to test key support levels. The intraday hourly chart shows the old key pivot level of $1.0900 is under direct threat, with the next pivot at $1.0800 also next in range. Near term momentum is negative, but any intraday rallies should be seen as a chance to sell now. The initial resistance is at $1.1000 from yesterday (and also around Friday’s low), however already the Europeans are coming in to sell early in the session.
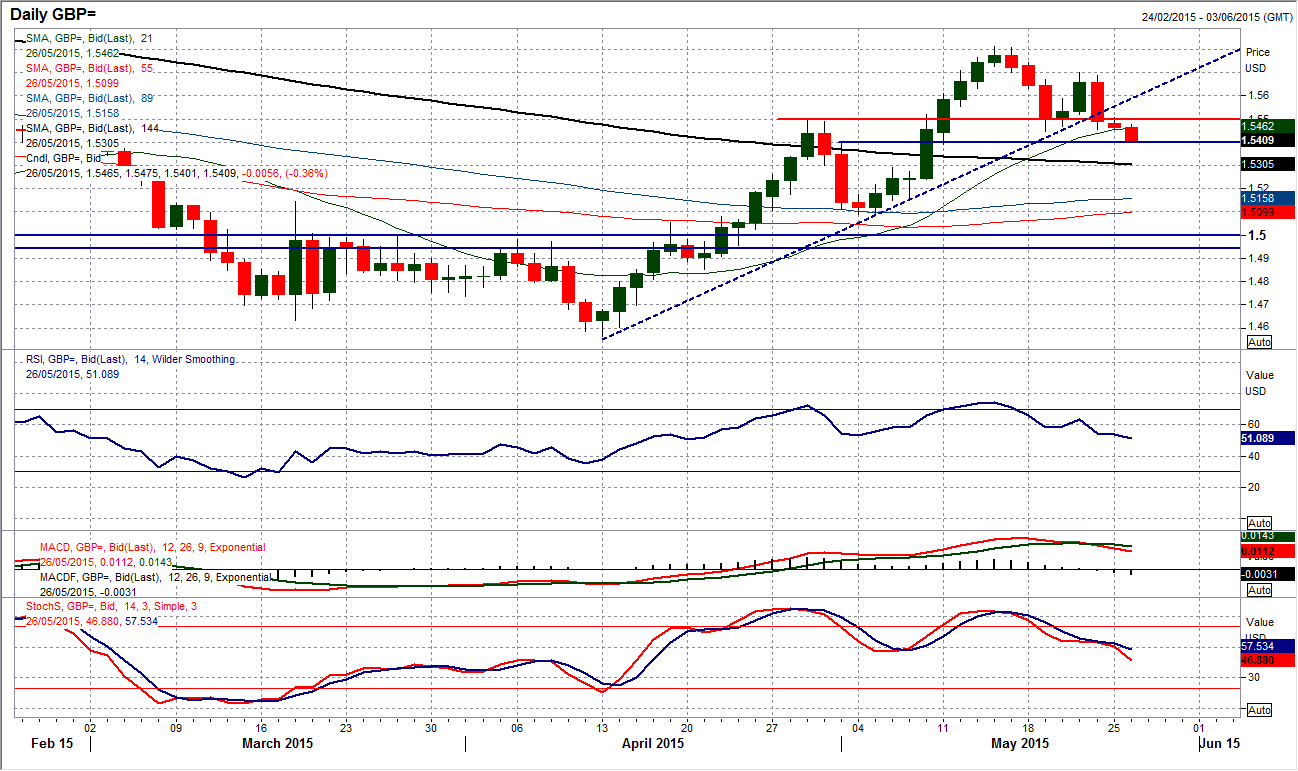
GBP/USD
It would seem as though the dollar pressure is now a greater force than the any positivity for sterling. The sharp bearish reversal on Friday has again flipped the outlook to more corrective once more and the pressure is dragging Cable lower again. The overnight breach of the key reaction low at $1.5445 looks to be confirming that the dollar bulls are becoming the dominant force. The uptrend in place since the mid-April low has now been broken and a close below $1.5445 today would now confirm that a new sequence of lower highs is being formed (at Thursday’s $1.5700). Momentum indicators on the daily chart are also now all looking corrective, with the MACD lines having crossed, whilst the Stochastics and RSI are also in consistent decline. Watch for a test of the reaction low at $1.5390 which was the 11th May low and then the support at $1.5353. The intraday hourly chart shows all moving averages in bearish decline now, whilst the old support around $1.5500 is now being used as resistance. Any rally now into the band $1.5500/$1.5550 looks to be a selling opportunity.
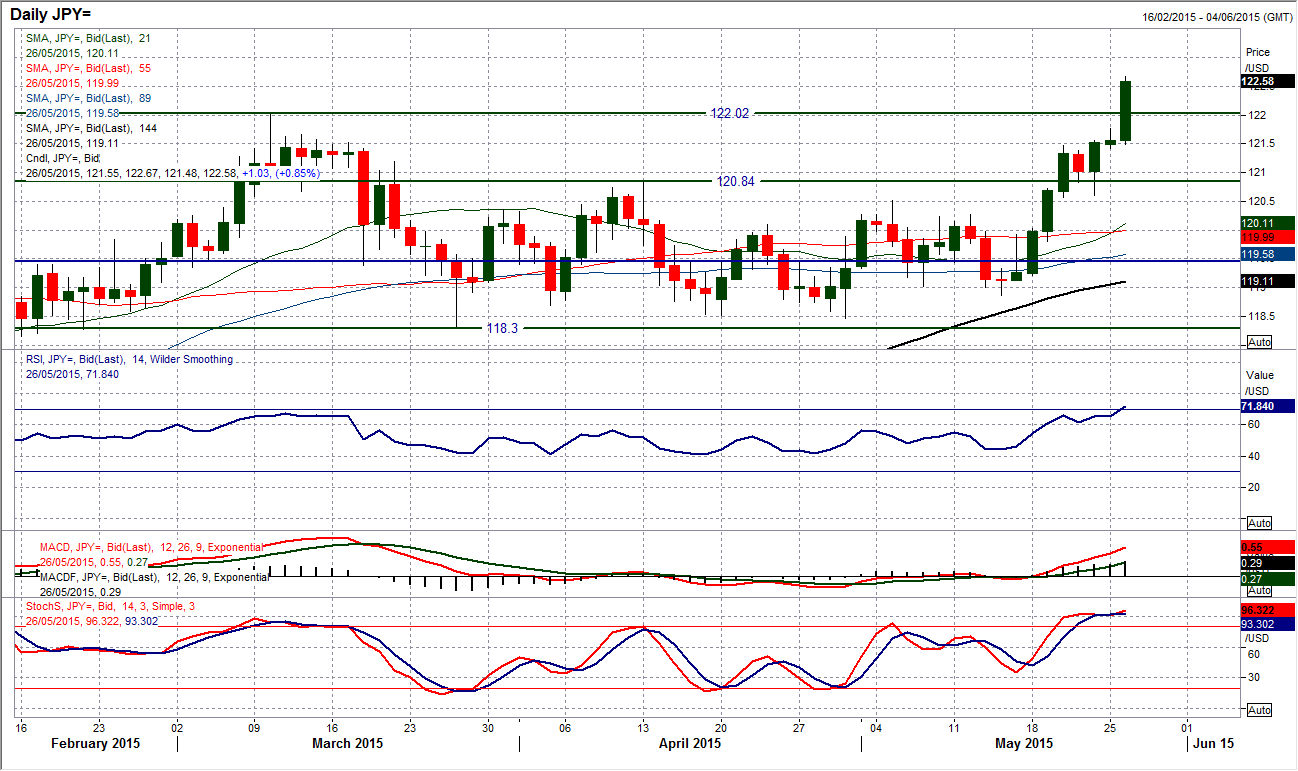
USD/JPY
The outlook for the dollar bulls continues to improve, to an extent at which the huge 8 year high at 122.02 has now been posted today. The set-up on the chart is increasingly strong, posting six positive sessions in the past seven (I would play down the impact of an arguable “doji” candle yesterday on the grounds of thin trading amidst the public holiday). Momentum indicators remain strong and there is little reason to suspect now that there will not be serious pressure to the upside if there is a closing confirmation above 122.02 today. The intraday hourly chart shows a strong set up with corrections being bought into and old breakout levels being used as the basis of support for the next run higher. This means that initial support comes in at 121.40 whilst hourly momentum is also very strong. There is no real sign on either the hourly or daily timeframe of any corrective indication so there is no real reason to not keep buying. The upside is now open towards the 2007 peaks of 123.65 and 124.15.
Gold
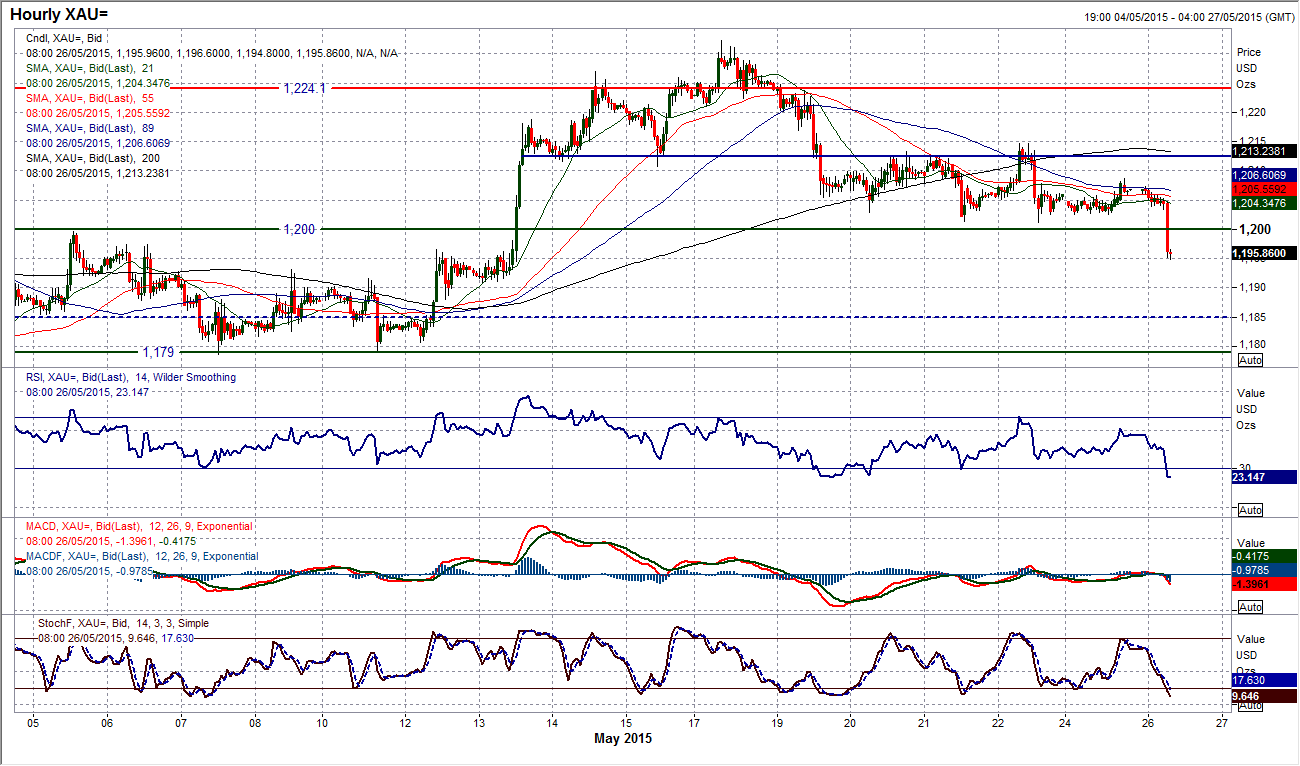
Gold has been consolidating which in itself is an interesting development considering the dollar strength across the forex majors, but early today the sellers are gaining the upper ground. The breakdown below $1200 changes the near term outlook within the range to a more negative slant within the trading band $1278/$1224. The broken support at $1200 now means that there is resistance between $1200/$1208.60 that should be seen as a chance for near term short positions on a rally. This now means that momentum indicators on the hourly chart are deteriorating. The next pivot level within the support band is around $1190. A closing break would add to the conviction.
WTI Oil
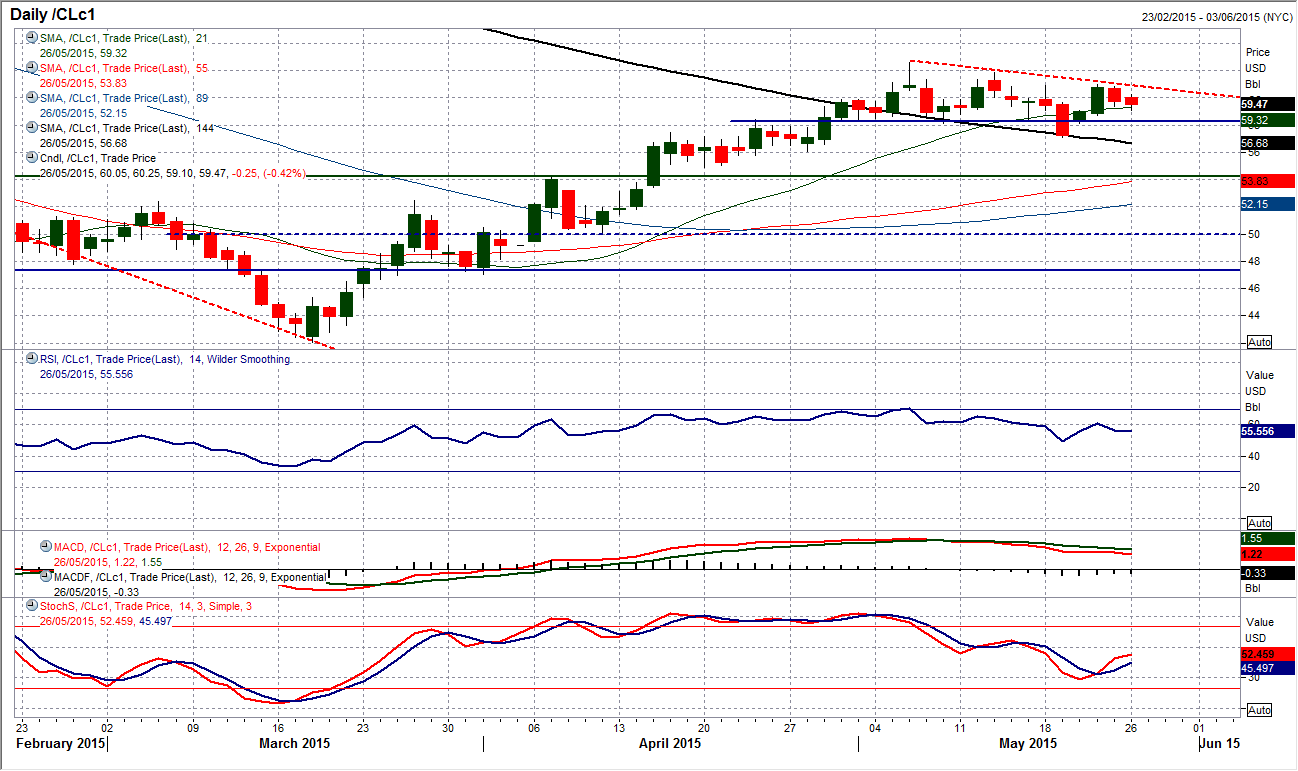
The recent signals have suggested that the outlook on WTI is increasingly choppy within a ranging medium term outlook. This is resulting in a general neutralising of the momentum indicators on both daily and intraday charts. However, there is an argument now that there is a trend of lower highs forming with Friday’s high at $60.95 being posted below a previous reaction high at $61.85. This comes with a slight bearish drift on the MACD lines. Perhaps this could begin to put pressure on the support levels, which the intraday hourly chart shows to be initially at $59.10 before the old key near term floor at $58.30.
Note: All information on this page is subject to change. The use of this website constitutes acceptance of our user agreement. Please read our privacy policy and legal disclaimer. Opinions expressed at FXstreet.com are those of the individual authors and do not necessarily represent the opinion of FXstreet.com or its management. Risk Disclosure: Trading foreign exchange on margin carries a high level of risk, and may not be suitable for all investors. The high degree of leverage can work against you as well as for you. Before deciding to invest in foreign exchange you should carefully consider your investment objectives, level of experience, and risk appetite. The possibility exists that you could sustain a loss of some or all of your initial investment and therefore you should not invest money that you cannot afford to lose. You should be aware of all the risks associated with foreign exchange trading, and seek advice from an independent financial advisor if you have any doubts.
Recommended Content
Editors’ Picks
AUD/USD failed just ahead of the 200-day SMA

Finally, AUD/USD managed to break above the 0.6500 barrier on Wednesday, extending the weekly recovery, although its advance faltered just ahead of the 0.6530 region, where the key 200-day SMA sits.
EUR/USD met some decent resistance above 1.0700

EUR/USD remained unable to gather extra upside traction and surpass the 1.0700 hurdle in a convincing fashion on Wednesday, instead giving away part of the weekly gains against the backdrop of a decent bounce in the Dollar.
Gold keeps consolidating ahead of US first-tier figures

Gold finds it difficult to stage a rebound midweek following Monday's sharp decline but manages to hold above $2,300. The benchmark 10-year US Treasury bond yield stays in the green above 4.6% after US data, not allowing the pair to turn north.
Bitcoin price could be primed for correction as bearish activity grows near $66K area

Bitcoin (BTC) price managed to maintain a northbound trajectory after the April 20 halving, despite bold assertions by analysts that the event would be a “sell the news” situation. However, after four days of strength, the tables could be turning as a dark cloud now hovers above BTC price.
Bank of Japan's predicament: The BOJ is trapped

In this special edition of TradeGATEHub Live Trading, we're joined by guest speaker Tavi @TaviCosta, who shares his insights on the Bank of Japan's current predicament, stating, 'The BOJ is Trapped.'
