Market Overview
The dollar has started to make a comeback in the past few days which is helping to repair some of the damage made to the bull run on the Dollar Index (DXY). An interesting feature this time around though is that where Treasury yields were not really responsive previously, this time the strengthening of the dollar is being accompanied by a rise in yields which should be supportive of the dollar. This is all coming on a week of crucial data with the latest Non-farm Payrolls data set to be the dominant factor. Last night’s session on Wall Street was mildly positive with the S&P 500 closing up 0.3% but still under its all-time high resistance levels. Asian markets were mixed overnight although Japan and South Korea were closed for public holidays. European markets have also opened mixed, although the FTSE 100 is higher as it plays catch up on some European gains from yesterday.
In forex trading the consolidation from yesterday had largely been continuing with little steer from either sterling or the yen, however the euro has started to weaken again. The major mover of the day has been the Aussie dollar which has reacted with a fair amount of volatility to the news of another rate cut from the Reserve Bank of Australia. Despite the cut to 2.0% being expected, there has been a mixed response to the cut, with the Aussie now actually trading higher on the day.
The economic calendar is mostly US focused today with the US Trade Balance at 1330BST with a deterioration to -$41.7bn expected. Then at 1500BST there is the ISM Non-Manufacturing data which is expected to drop slightly to 56.2. Late this evening there is also the New Zealand unemployment rate which is expected to drop to 5.5% at 2345BST.
Chart of the Day – Silver
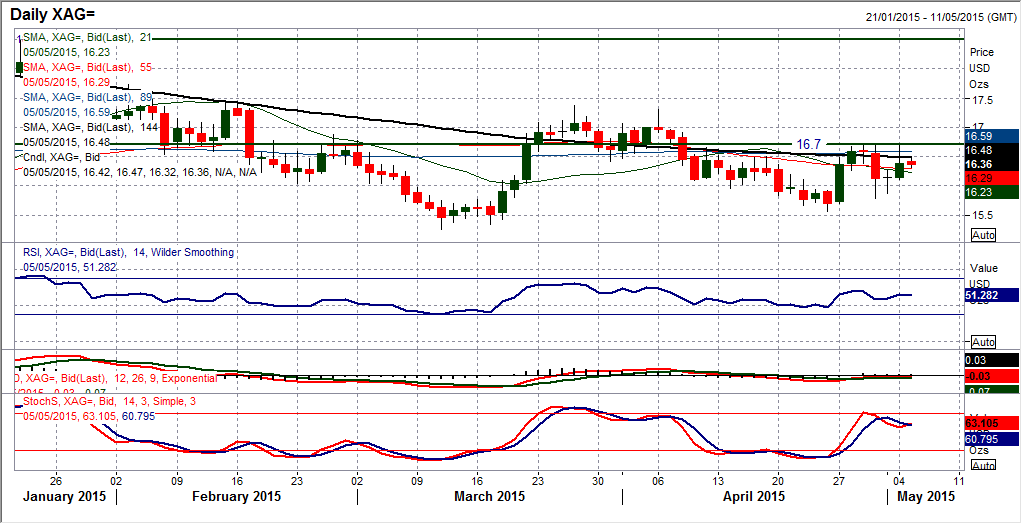
Despite still showing much of the consolidation that gold has been in, the silver chart is very interesting nonetheless. Whilst gold has been exhibiting a slightly bearish tilt to its recent trading, silver has actually been pressurizing the resistance levels around $16.70 for the past week. The daily chart remains very much in the medium term neutral mode, but the more pressure that is seen on the resistance the more likely it is to break. The daily chart is not showing any imminent signs of breakout on the momentum indicators, and whilst the hourly chart shows moving averages beginning to pick-up, once more the momentum is not especially supportive of a bullish break. A close above $16.73 would re-open the resistance band $17.30/$17.40. The hourly chart shows a near term pivot around $16.25 that the bulls would be looking to hold above to keep the pressure on.
EUR/USD
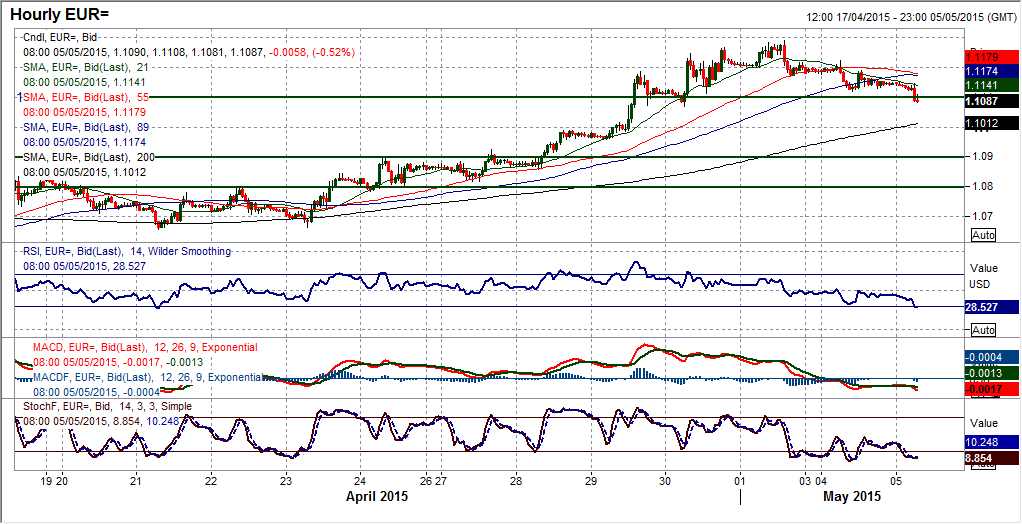
The euro has just begun to gradually fall back now after seeing such a strong run in the past week and a half. With markets not firing on all cylinders due to the May Day public holidays there has been a subdued look to the trading, however there will now be a test of the breakout. The move above the key resistance band between $1.1035/$1.1100 means that this is now needs to be tested as support. The price action of the last few days which has seen the loss of upside impetus is meaning that the momentum indicators have just begun to turn lower, with studies such as the Stochastics now threatening a sell signal. I think that would be seen if the old resistance which is now supportive at $1.1035/50 were to be breached. Interestingly the hourly chart shows a bearish key one day reversal on Friday which marked the peak in the price at $1.1290, since which there has been a lower high at $1.1225. A breach of $1.1070 would put the key support band $1.1035/50 under direct pressure now.
GBP/USD
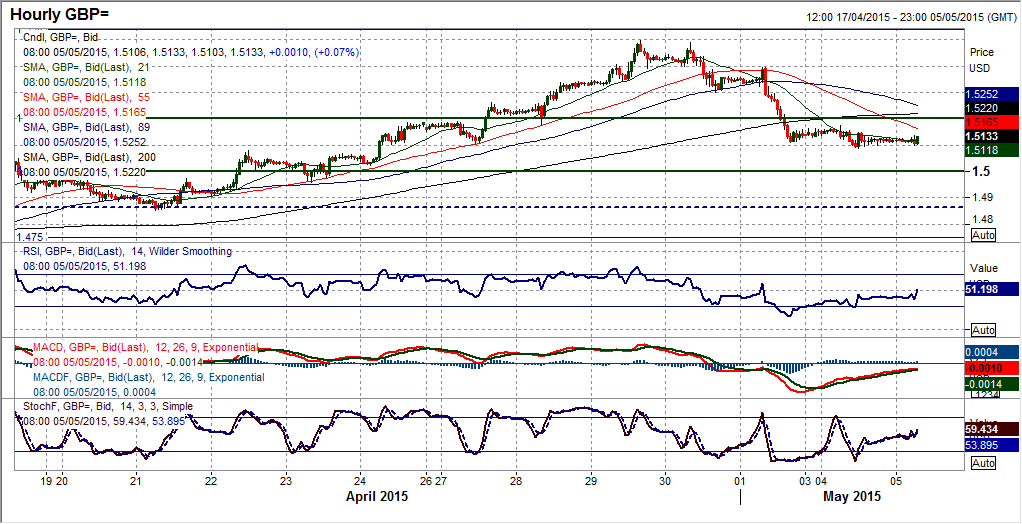
After such a strong run higher there was always the potential that once there was a sniff that the rally was maturing that the profit takers would move in quickly and the price fall sharply. The move has resulted in a sell signal on the Stochastics, the last one of which in February preceded 3 weeks of declines. That makes the old resistance band between $1.5000/$1.5050 now key as near term support. With the bank holiday yesterday, price movement was fairly limited but there should be more of an idea of direction today. The intraday hourly chart does not look so positive anymore, with the moving averages all turning lower and hourly momentum in more corrective configuration. The initial resistance is yesterday’s rally high at $1.5175 before $1.5300 comes into play. The test of $1.5000 is now key near term.
USD/JPY
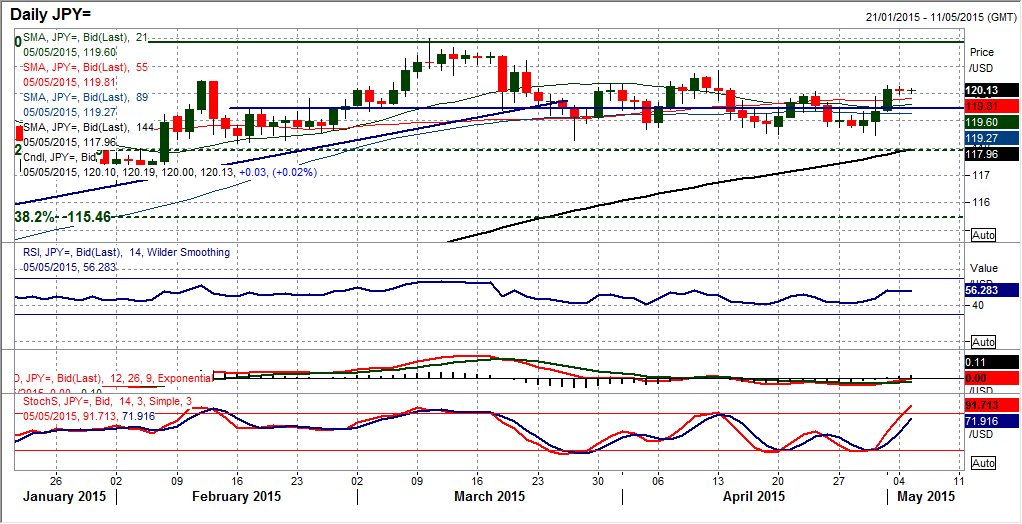
Despite having not written about Dollar/Yen for a couple of days, there is still a similar theme running through the chart. The medium term range play continues, but the limits of movement in the consolidation remain tight with maybe a two days of trend able to take hold before a retracement once more. This seems to have been the case again with the rally off the range lows above key support at 118.30 pushing strongly for a two days before the move begins to fall over. The pivot level around 119.40 is still playing a role near term and should again be seen as the divide between near term positive and near term negative. Once again looking at the hourly RSI it is entirely possible to play the classic overbought/oversold signals. The latest move has found resistance at 120.30 yesterday and this is preventing a move back to test 120.84. The momentum has unwound and is looking for the next signal. Above 119.40 I would favour pressure on the resistance.
Gold
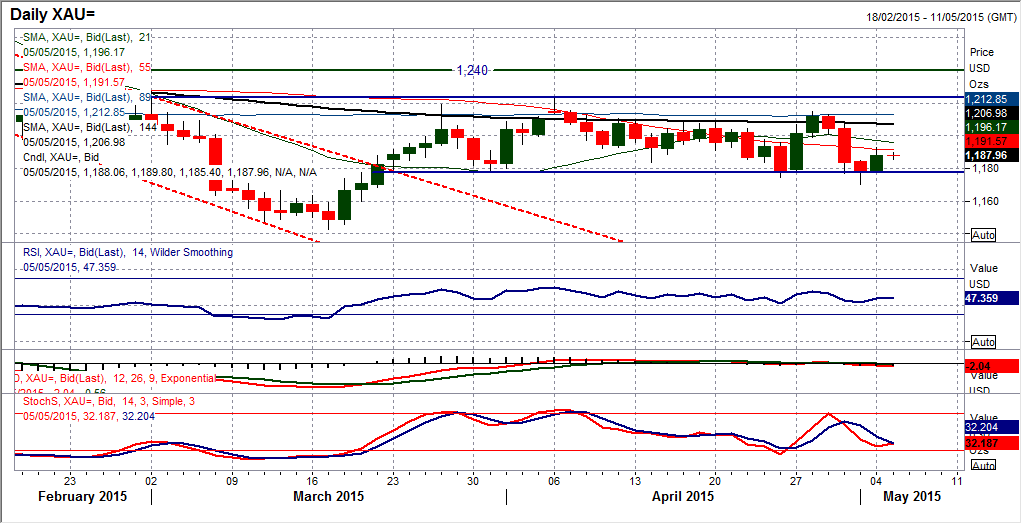
Despite the continued pressure on the support at $1178 in the past few days there is still a failure to close below the key near term level which leaves the bears unsure of a potential downside break. The daily chart candlesticks show the tails (i.e. intraday extremes) breaching the support, but no decisive move. So for now, although there is a slight negative bias to the technical indicators, I expect the range to continue. Yesterday’s slight recovery has added some support too, with the intraday hourly chart showing a higher low at $1180.00 above the $1170.20 low formed on Friday. If the bulls can manage to break above $1193 today which is yesterday’s high then the recovery within the range can continue.
WTI Oil
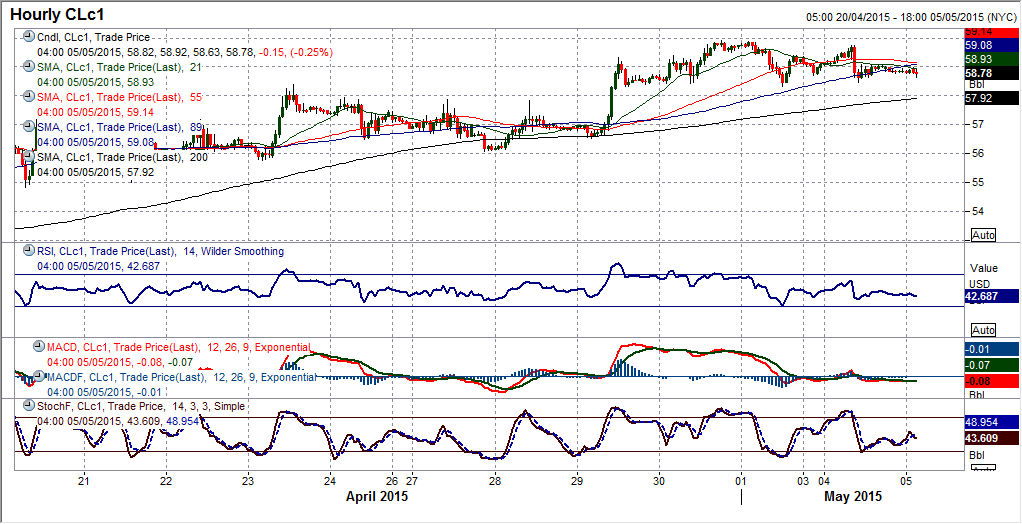
The bulls continue to remain strong and pull the price of WTI higher in a fairly calm and steady manner. The stepped advance which has now pulled the price well clear from the breakout level at $54.24 is now looking to test the psychological resistance at $60 which in a way protects the next resistance that was left within the old sell-off at $63.70. The intraday hourly chart shows that the initial support to be watching is at $58.30 from the top of a band back towards $56.00. The hourly momentum has unwound through a consolidation in the past two days and looks to be ready for the next leg higher.
Note: All information on this page is subject to change. The use of this website constitutes acceptance of our user agreement. Please read our privacy policy and legal disclaimer. Opinions expressed at FXstreet.com are those of the individual authors and do not necessarily represent the opinion of FXstreet.com or its management. Risk Disclosure: Trading foreign exchange on margin carries a high level of risk, and may not be suitable for all investors. The high degree of leverage can work against you as well as for you. Before deciding to invest in foreign exchange you should carefully consider your investment objectives, level of experience, and risk appetite. The possibility exists that you could sustain a loss of some or all of your initial investment and therefore you should not invest money that you cannot afford to lose. You should be aware of all the risks associated with foreign exchange trading, and seek advice from an independent financial advisor if you have any doubts.
Recommended Content
Editors’ Picks
EUR/USD rebounds to 1.0650 on renewed USD weakness

EUR/USD gained traction and rose to the 1.0650 area in the early American session on Tuesday. Disappointing housing data from the US seem to be weighing on the US Dollar, helping the pair stretch higher.
GBP/USD climbs above 1.2450 after US data

GBP/USD extended its recovery from the multi-month low it touched near 1.2400 and turned positive on the day above 1.2450. The modest selling pressure surrounding the US Dollar after dismal housing data supports the pair's rebound.
Gold retreats to $2,370 as US yields push higher

Gold stages a correction on Tuesday and fluctuates in negative territory near $2,370 following Monday's upsurge. The benchmark 10-year US Treasury bond yield continues to push higher above 4.6% and makes it difficult for XAU/USD to gain traction.
XRP struggles below $0.50 resistance as SEC vs. Ripple lawsuit likely to enter final pretrial conference

XRP is struggling with resistance at $0.50 as Ripple and the US Securities and Exchange Commission (SEC) are gearing up for the final pretrial conference on Tuesday at a New York court.
US outperformance continues

The economic divergence between the US and the rest of the world has become increasingly pronounced. The latest US inflation prints highlight that underlying inflation pressures seemingly remain stickier than in most other parts of the world supported by a strong US labour market.
