Market Overview
There is an uncertain feel to financial markets at the moment. Earnings season in the US has failed to ignite the bulls on Wall Street, where despite a string of positive corporate numbers and a nice beat of expectations on the existing home sales yesterday, the S&P 500 closed 0.5% higher and is still rangebound. Furthermore, overnight the data out of Asia was disappointing. Flash manufacturing PMI readings for both Japan and China both missed expectations and also worryingly showed that they were falling below 50 and into contraction territory. Although Asian markets have been mixed to slightly positive in their response, the European markets may not fare so well. Early trading shows a mixed response but negative data out of China will usually weigh on markets such as the FTSE and the export heavy DAX.
Forex trading shows that the US dollar has begun to strengthen as the European session has got underway, with euro and sterling both weaker. The big mover though has been the Kiwi dollar which has come under pressure after an official from the Reserve Bank of New Zealand suggested that weaker demand and prices could prompt a decrease in interest rates to be considered. The kiwi is over a percent lower as a result.
Traders will be watching for the flash Eurozone manufacturing PMIs early in the European session. Recent signs have suggested that activity in the Eurozone is beginning to pick up and it will be interesting if this is reflected in this morning’s data. The Eurozone data is at 0900BST and is expected to show an improvement to 52.6 from 52.2. The flash US manufacturing PMI is at 1445BST and is expected to slide slightly to 55.6 from 55.7. Weekly Jobless claims are out at 1330BST and are expected to show a slight improvement on last week’s 294,000 down to 288,000. The New Home Sales will also be of interest at 1500BST with a slight drop to 514,000 expected (last month 539,000).
Chart of the Day – DAX Xetra
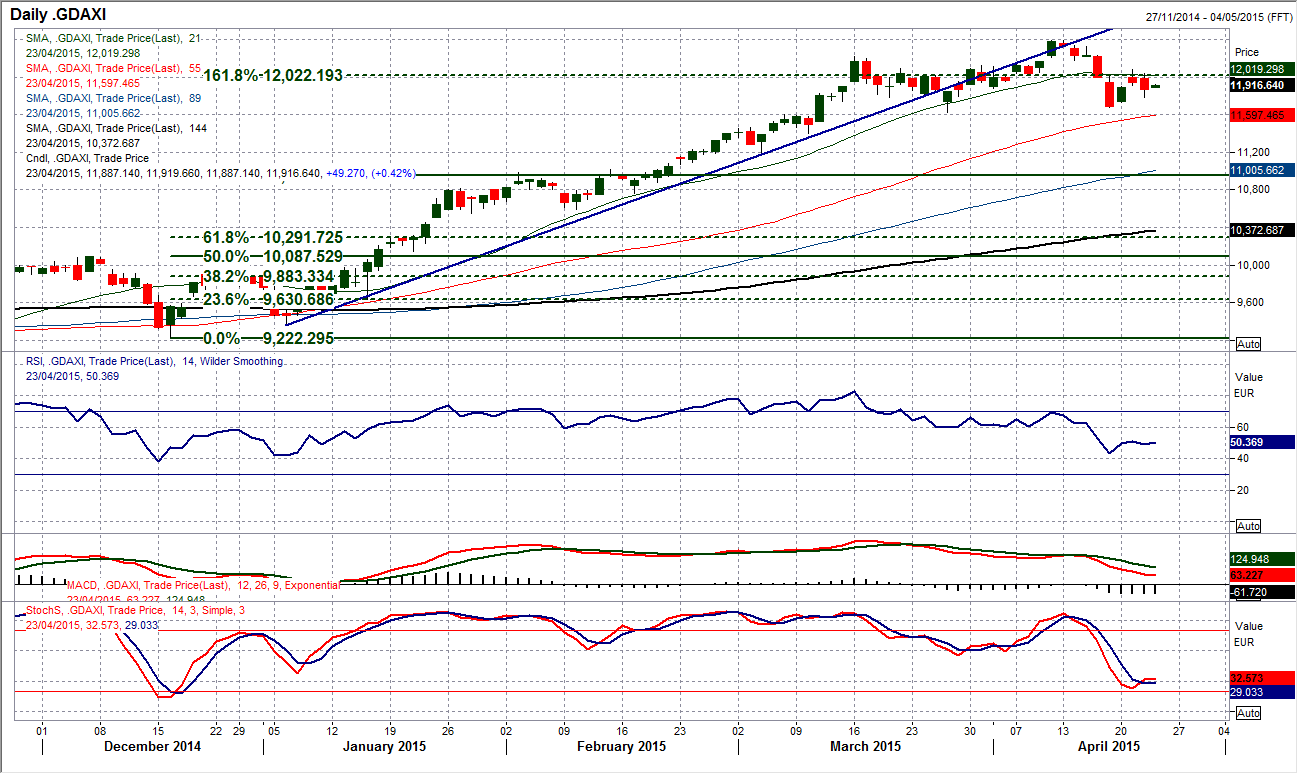
I wrote recently about the DAX falling away and putting pressure on the key support at 11,620 and despite an initial rebound, this support will still be very much part of traders’ concerns. This is because having turned lower form 12,079 the DAX is not too far away from completing a six week head and shoulders top pattern. The trouble is that the index has lost upside momentum now in the rally. The RSI, which had been above 60 for almost all of the rally since the beginning of January, has now dropped below 50. Furthermore, the MACD and Stochastics are also far weaker than previously. The number of bearish candlesticks posted since the all-time high at 12,391 almost two weeks ago also gives me concern. It suggests that the bulls consistently losing impetus during the session. The intraday hourly chart shows that there is a concern now, with hourly moving averages either flat or falling, and the hourly MACD falling over quickly in a recovery. A failure to move back above 12,079 will add to the growing downside pressure now.
EUR/USD
There has been some very indeterminate candles in the course of the past couple of days which reflect the lack of decisiveness in trading the euro. This comes after a recent rally had unwound any oversold momentum back to neutral and the price is again trading around the 21 day moving average. The intraday hourly chart shows a messy sequence of moves, with no real trend emerging. The moves in the last few days have been alternating between rallies and corrections ranging between 100/150 pips at a time. The head and shoulders top pattern completed on 20th April is still intact but whether it has any real relevance anymore is debatable. I have found the pivot level at $1.0800 once again doing a job yesterday also, whilst the 38.2% Fibonacci retracement of $1.1035/$1.0519 is also providing an interesting consolidation area at $1.0716. Until this choppy trading period ends and we get some direction it is difficult to call, however With the overhead supply, the weight of the technical indicators suggest the bears will win out in the end. Support comes in at $1.0658 and $1.0623.
GBP/USD
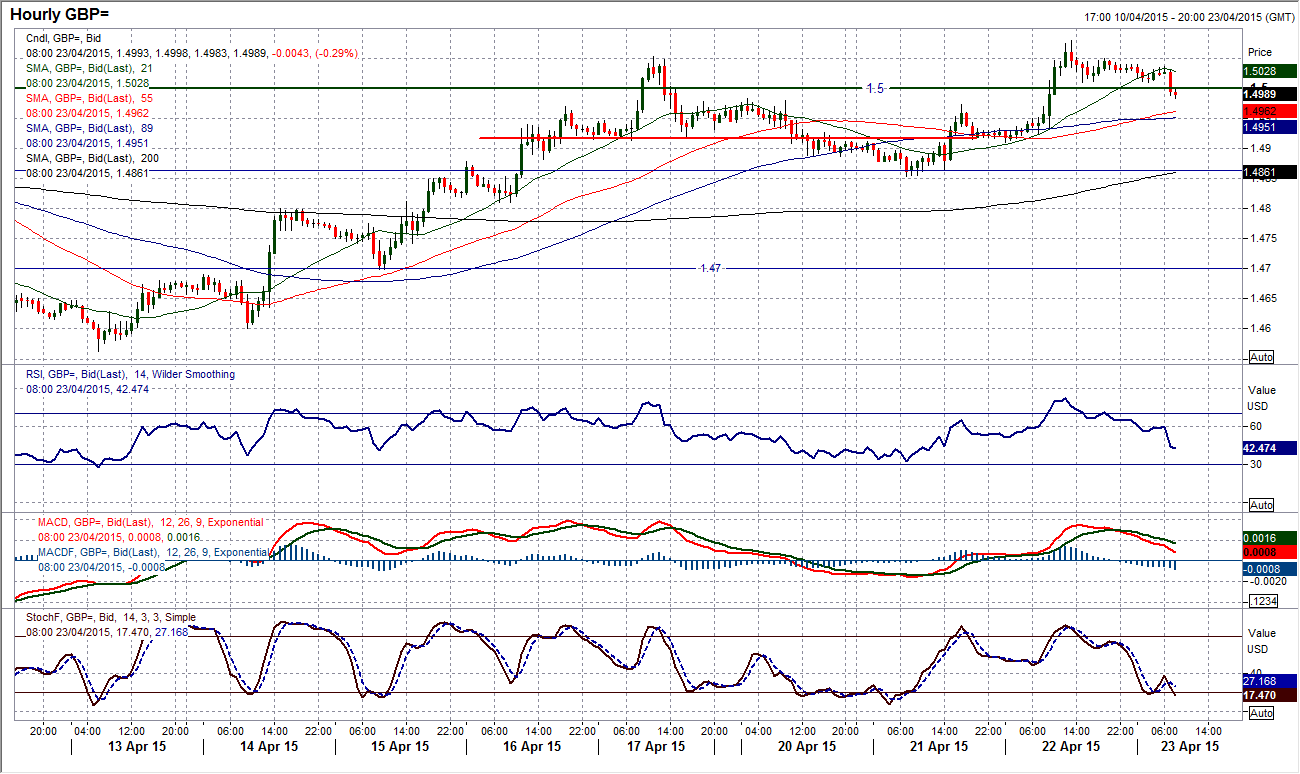
There was a very interesting upside break on Cable yesterday. For a few weeks the resistance at $1.5000 had been holding back a breakout with resistance being formed time and time again. A shooting star candle was the result of an attempted breakout last week, but yesterday finally the breakout was achieved and also held. That marks a significant improvement in the outlook. Daily momentum indicators continue to improve and the move looks to be fairly genuine. Although there are market concerns over the uncertainty of the UK general election, the upside break is flying in the face of popular opinion that sterling is likely to weaken. Maybe as we approach polling day on 7th May then there could begin to be a sense of concern, but not at the moment. The intraday hourly chart suggests that the old resistance band between $1.4950/$1.5000 could be a good gauge as if Cable can hold above it then the outlook will continue to improve. Key near to medium term support is now $1.4853.
USD/JPY
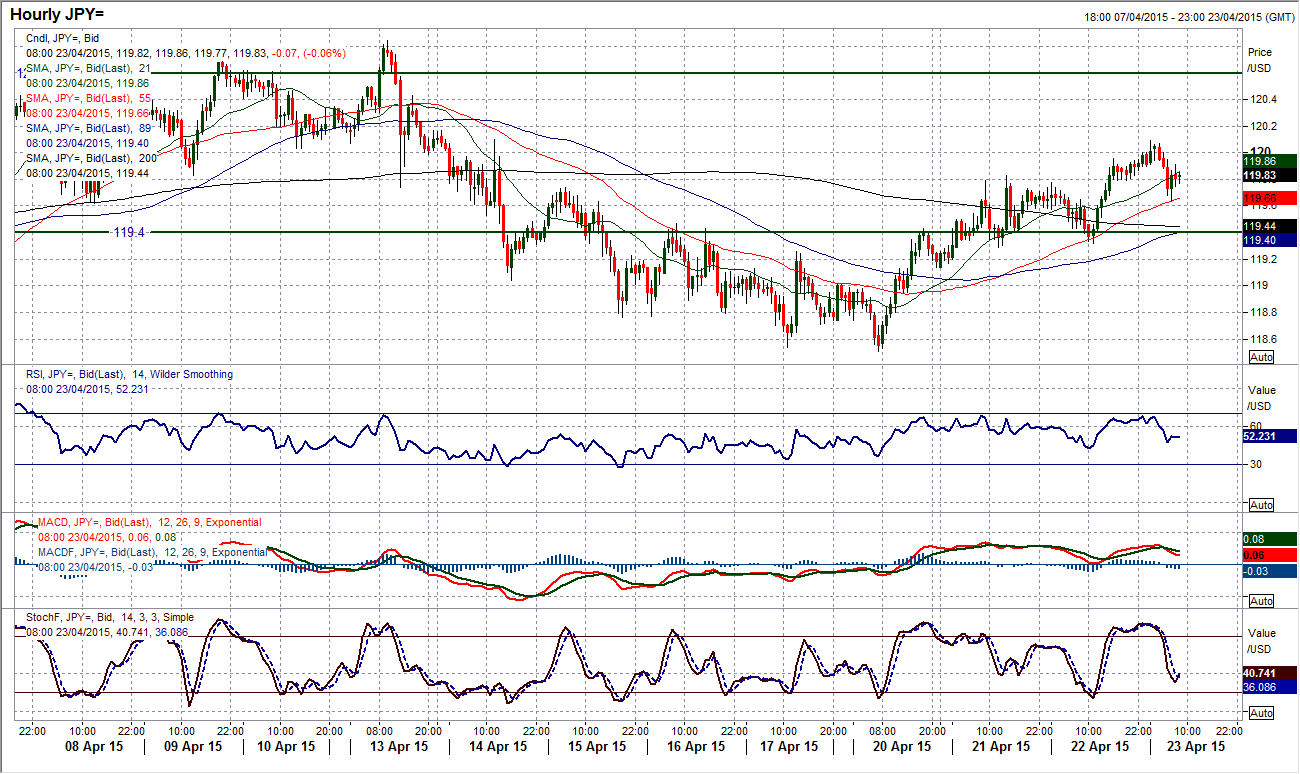
The dollar rebound has progressed over the past few days closing a third straight day with a positive candle (coming after 6 straight negative candles). This is all still part of the general range play on Dollar/Yen though. The one common theme though is still the use of the 119.40 pivot level and whilst the pair is trading above it (as it is currently) then the near term outlook will have a bullish bias. Hourly momentum indicators show a more positive configuration too. The strong close last night has been followed by a fall overnight (despite the weaker than expected Japanese flash manufacturing PMI) which has left a reaction high at 120.10. This fall though could give a near term opportunity to buy today. With the pivot at 119.40 and price support at 119.30 over the past couple of days this dip could be a chance to buy near term for the continued move back towards the 120.84 key reaction high. Continue to play the range.
Gold
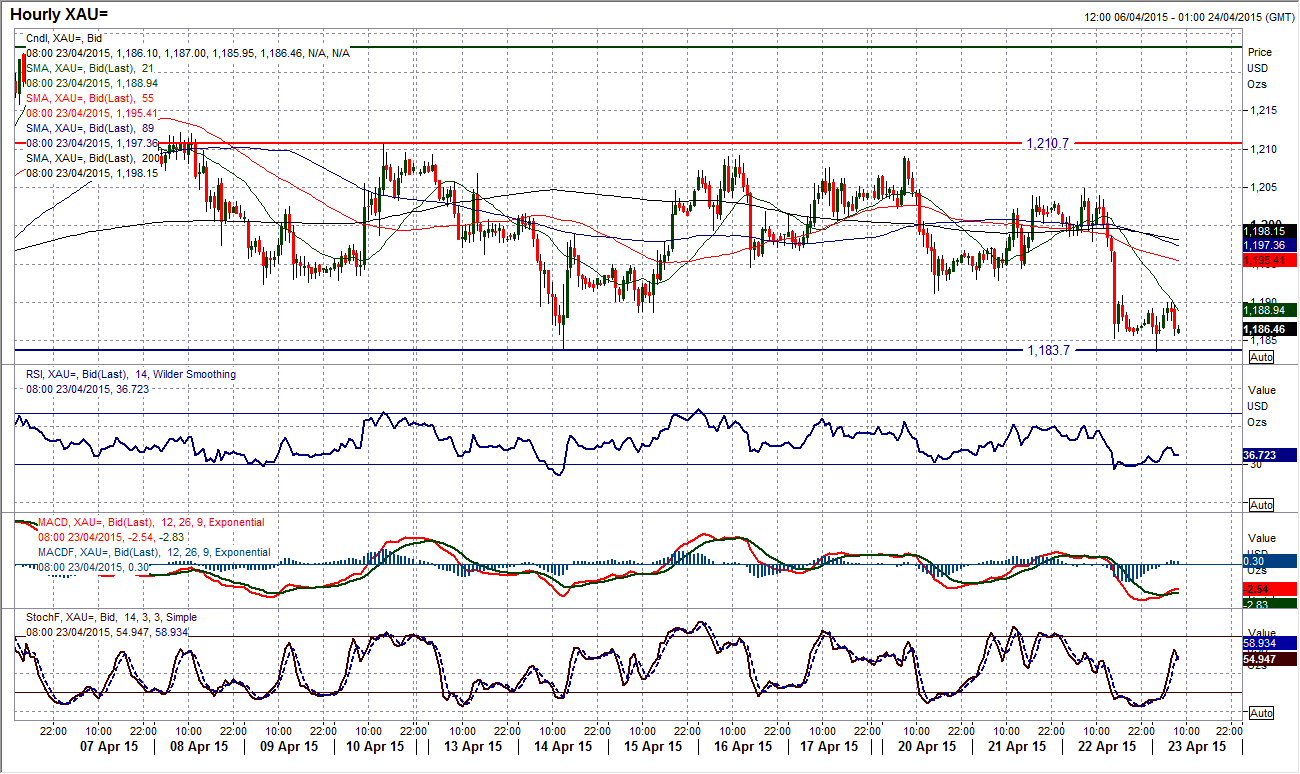
After several days of really indecisive trading, finally we got a bit of direction yesterday. With the posting of a bearish outside day it seems that the sellers may be growing in strength. With this move, both the RSI and Stochastics have deteriorated (Stochastics especially, in the wake of a strong bearish candle with a close towards the low of the day). The next thing to watch out for is a second consecutive negative candle to suggest that the move has been accepted. There have been no key levels broken yet, though the pressure is on. The reaction low $1183.70 from 14th April has been tested (and just held) early this morning, but this is right at the bottom of the recent range. A breach would see an immediate test of the key medium term support at $1178. Hourly momentum has just rebounded in the past couple of hours but there would need to be a decisive move back above the near term resistance around $1195 to suggest that the support was really holding. With the hourly technical indicators deteriorating, there is a battle on to protect the support. A breach of $1178 would be a medium term sell signal.
WTI Oil
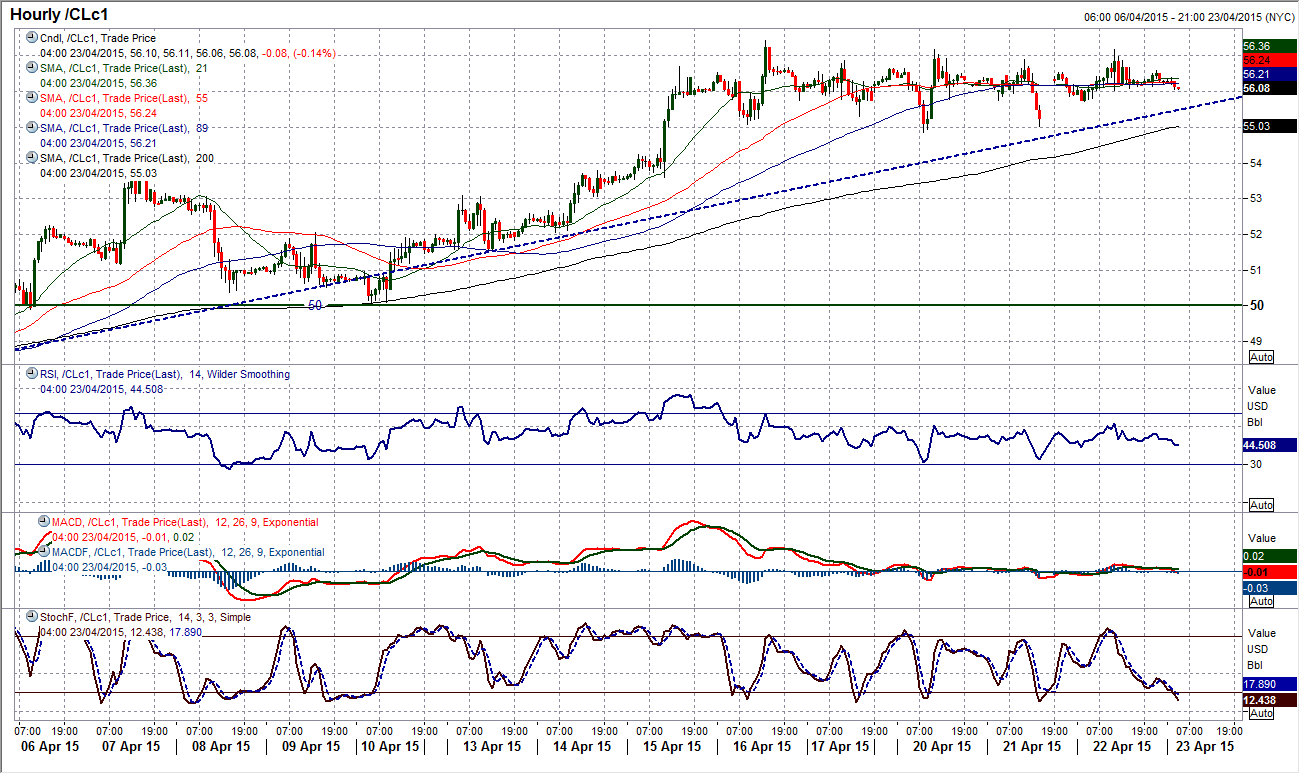
Looking at the intraday hourly chart on WTI for the past few days I could have just written exactly the same comments and it would have been basically valid. Since breaking above $54.24 the WTI oil price has been basically consolidating the move. The daily chart shows Tuesday’s slightly bearish candle was just part of the consolidation, and another neutral candle yesterday suggests a market that is considering it next options. Momentum and the fact that there has been no profit taking on the breakout will give the bulls confidence. Looking on the intraday hourly chart I still see the support band between $53.00/$54.24 and a close above $57.42 would re-open the upside to test resistance at $59.00 on the way towards the base pattern target at $65.00.
Note: All information on this page is subject to change. The use of this website constitutes acceptance of our user agreement. Please read our privacy policy and legal disclaimer. Opinions expressed at FXstreet.com are those of the individual authors and do not necessarily represent the opinion of FXstreet.com or its management. Risk Disclosure: Trading foreign exchange on margin carries a high level of risk, and may not be suitable for all investors. The high degree of leverage can work against you as well as for you. Before deciding to invest in foreign exchange you should carefully consider your investment objectives, level of experience, and risk appetite. The possibility exists that you could sustain a loss of some or all of your initial investment and therefore you should not invest money that you cannot afford to lose. You should be aware of all the risks associated with foreign exchange trading, and seek advice from an independent financial advisor if you have any doubts.
Recommended Content
Editors’ Picks
How will US Dollar react to Q1 GDP data? – LIVE

The US' GDP is forecast to grow at an annual rate of 2.5% in the first quarter of the year. The US Dollar struggles to find demand as investors stay on the sidelines, while waiting to assess the impact of the US economic performance on the Fed rate outlook.
EUR/USD holds gains above 1.0700, as key US data loom

EUR/USD holds gains above 1.0700 in the European session on Thursday. Renewed US Dollar weakness offsets the risk-off market environment, supporting the pair ahead of the key US GDP and PCE inflation data.
GBP/USD extends recovery above 1.2500, awaits US GDP data

GBP/USD is catching a fresh bid wave, rising above 1.2500 in European trading on Thursday. The US Dollar resumes its corrective downside, as traders resort to repositioning ahead of the high-impact US advance GDP data for the first quarter.
Gold price edges higher amid weaker USD and softer risk tone, focus remains on US GDP

Gold price (XAU/USD) attracts some dip-buying in the vicinity of the $2,300 mark on Thursday and for now, seems to have snapped a three-day losing streak, though the upside potential seems limited.
XRP extends its decline, crypto experts comment on Ripple stablecoin and benefits for XRP Ledger

Ripple extends decline to $0.52 on Thursday, wipes out weekly gains. Crypto expert asks Ripple CTO how the stablecoin will benefit the XRP Ledger and native token XRP.
