Market Overview
Markets come into the new week with mixed messages. The selling pressure that signed off last week has abated slightly and there is an element of support. The negative impact of new regulations on short selling in China have been countered over the weekend by a 100 basis point cut to the Reserve Requirement Ratio which is the largest cut since 2008. This should be a positive for the banks and has helped to temper the bullish momentum from spilling over into this week. Wall Street may have closed strongly lower with the S&P 500 down 1.1%. Asian markets have been mixed today with the Nikkei continuing to consolidate (amid a stronger yen) and Shanghai stocks in positive territory. The European markets have taken the positive side of the bargain and are trading higher today.
In forex trading there is a mixed performance for the dollar. The euro is slightly weaker as it continues to lag performance of sterling, whilst the yen continues its recent creeping strength. The big movers are the commodity currencies which re all positive against the dollar in the wake of the easing measures put in place over the weekend as it cut the RRR. Gold and silver continue to consolidate.
There is very little on the economic calendar today. Traders will though be interested in hearing from both Bank of Canada governor Poloz, and Reserve Bank of Australia governor Stevens.
Chart of the Day – Silver
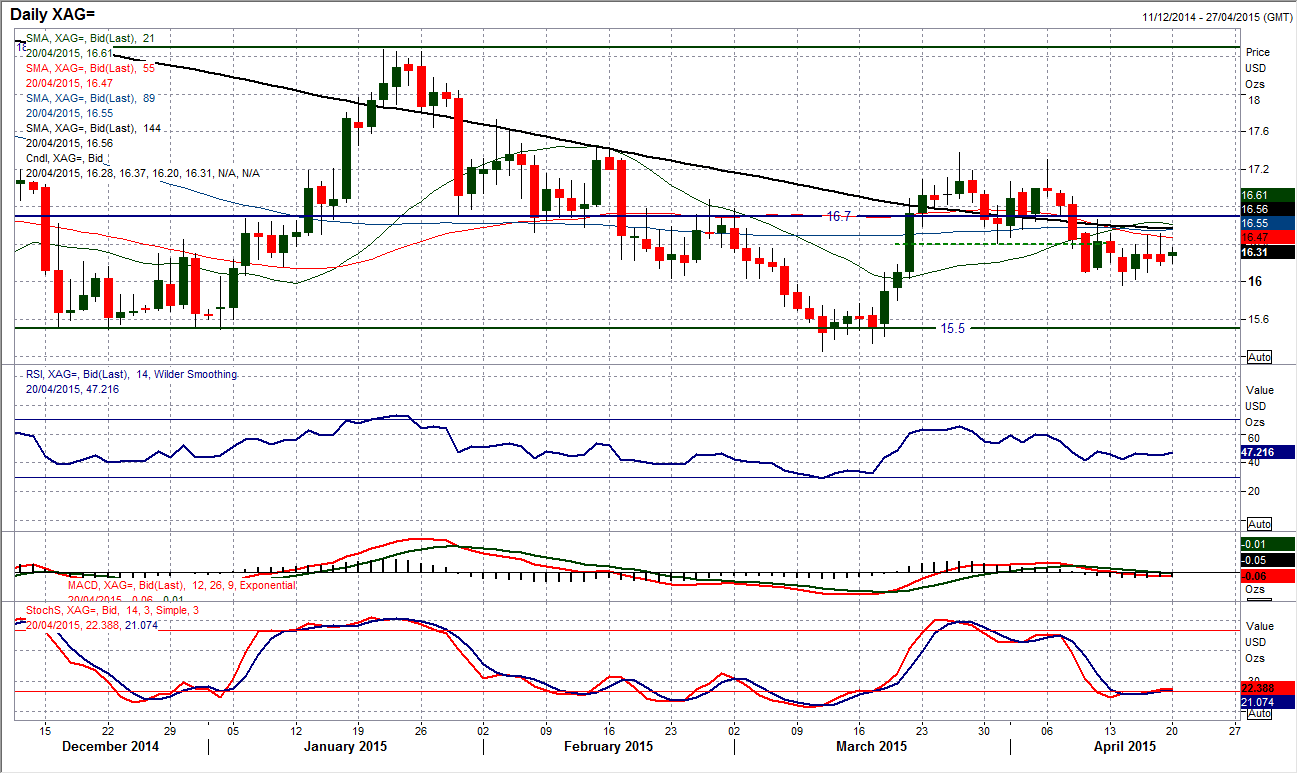
Silver is interesting because although it is in a consolidation and failing to make any consistent direction, there is certainly more of a negative outlook within the consolidation than there is with gold. The small top pattern completed below $16.40 remains in play with the neckline providing the resistance. There has been a consistent failure around the neckline for a recovery to take hold. Subsequently silver is finding resistance under all the moving averages now and it looks to be a matter of time before the sellers resume control. The hourly chart show that there is consistent pressure on the near term support at $16.20 and a breach re-opens the key low at $16.04. The daily chart shows a medium/longer term pivot around $16.70 and it would need a decisive breach to abort the bearish control.
EUR/USD
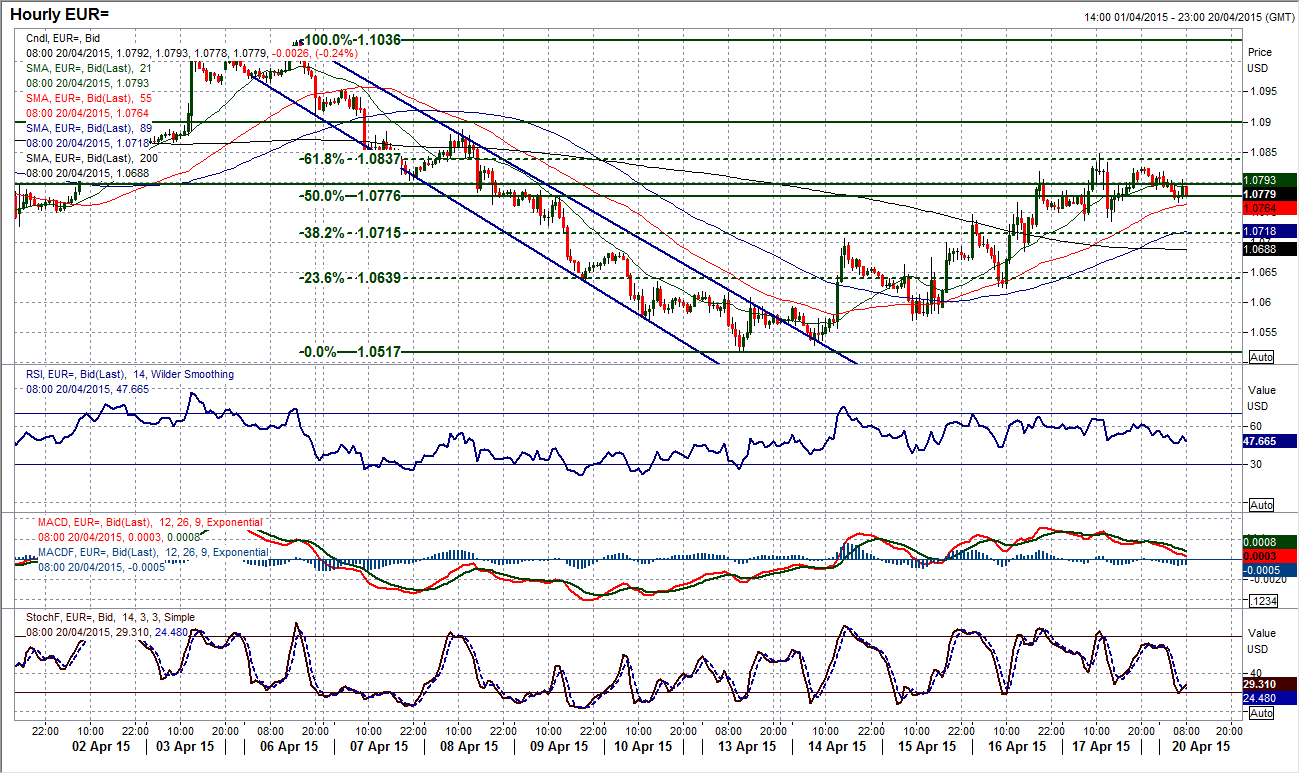
The rally on the euro has now managed to complete four successive positive trading days and now added over 250 pips. However, we are beginning to see a few signs that the rally may be running out of impetus. It would be also around an area at which the momentum indicators show the rallies tend to fall over too. With the early slide this morning, the RSI is still below 50 and the MACD lines have never really got going in the recovery. The hourly chart shows the 61.8% Fibonacci retracement of $1.1035/$1.0520 at $1.0835 has capped the rebound, whilst momentum indicators show very slight bearish divergences and a lack of impetus now. A failure of the support at $1.0735 would complete a small top pattern and imply a correction to $1.0635. There is minor support around $1.0700. The key resistance for the near term rally is at $1.0900.
GBP/USD
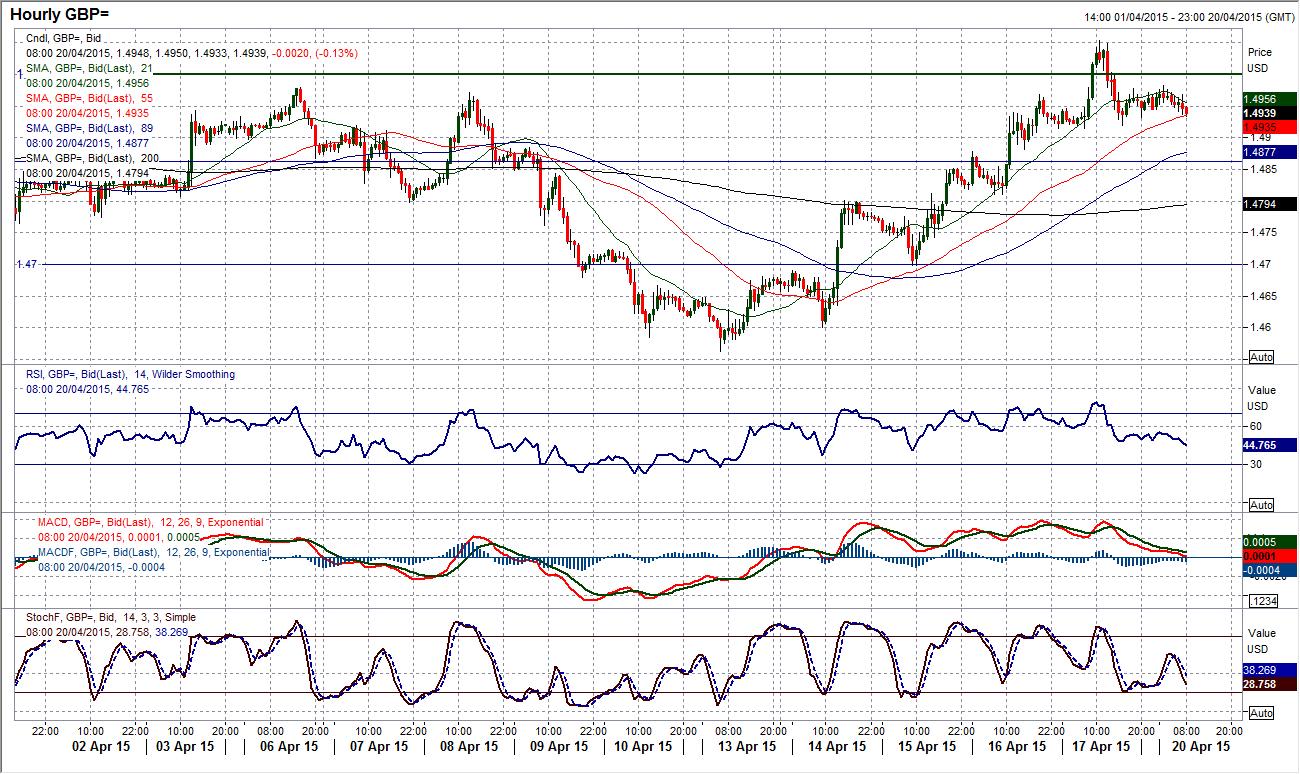
Friday’s intraday price action was very interesting. I have been looking for the resistance band between $1.4950/$1.5000 to cap the gains once more. However there was a mixed signal on Friday suggesting that the outlook is somewhat uncertain. The bulls could not sustain a move above $1.5000 with the rally topping out at $1.5053 only to close almost 100 pips below there. The candle was not a classic shooting star but the loss of momentum will be a concern for the bulls. Daily momentum indicators are now beginning to roll over. It also makes todays candle important as a negative move could act as a sell signal for some profits to be taken. The hourly chart shows a potential head and shoulders top pattern forming, needing a move below $1.4915. This would also break a sequence of higher lows and imply a move back towards $1.$1.4775. It would need a move above $1.5053 to maintain the bull run.
USD/JPY
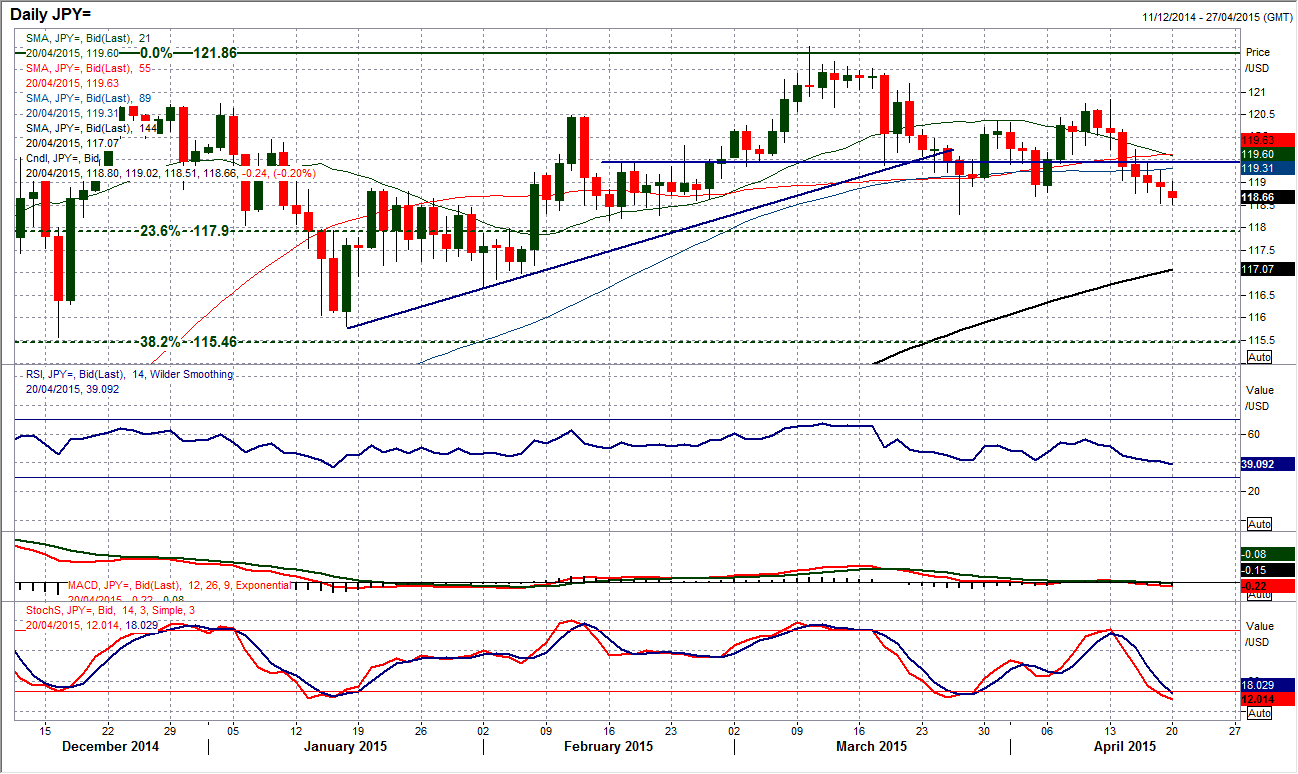
The key medium term support at 118.30 is coming under threat once more. The yen has now been gradually clawing back ground against the dollar for over a week now and the weakness on the pair again today suggests that the pressure is mounting. Daily momentum indicators, whilst not decisively negative have certainly become more corrective. The support of the March and mid-February low at 118.30 is now becoming increasingly important. A decisive break (a close below) would signal a key breakdown that would open 116.65 as the next support. Intraday hourly shows a series of lower highs, now finding resistance below the 119.40 pivot level at 119.25. The hourly MACD and RSI have both been in negative configuration for almost a week now. The pressure is growing to the downside and it needs a move above 119.25 to avert the near term selling.
Gold
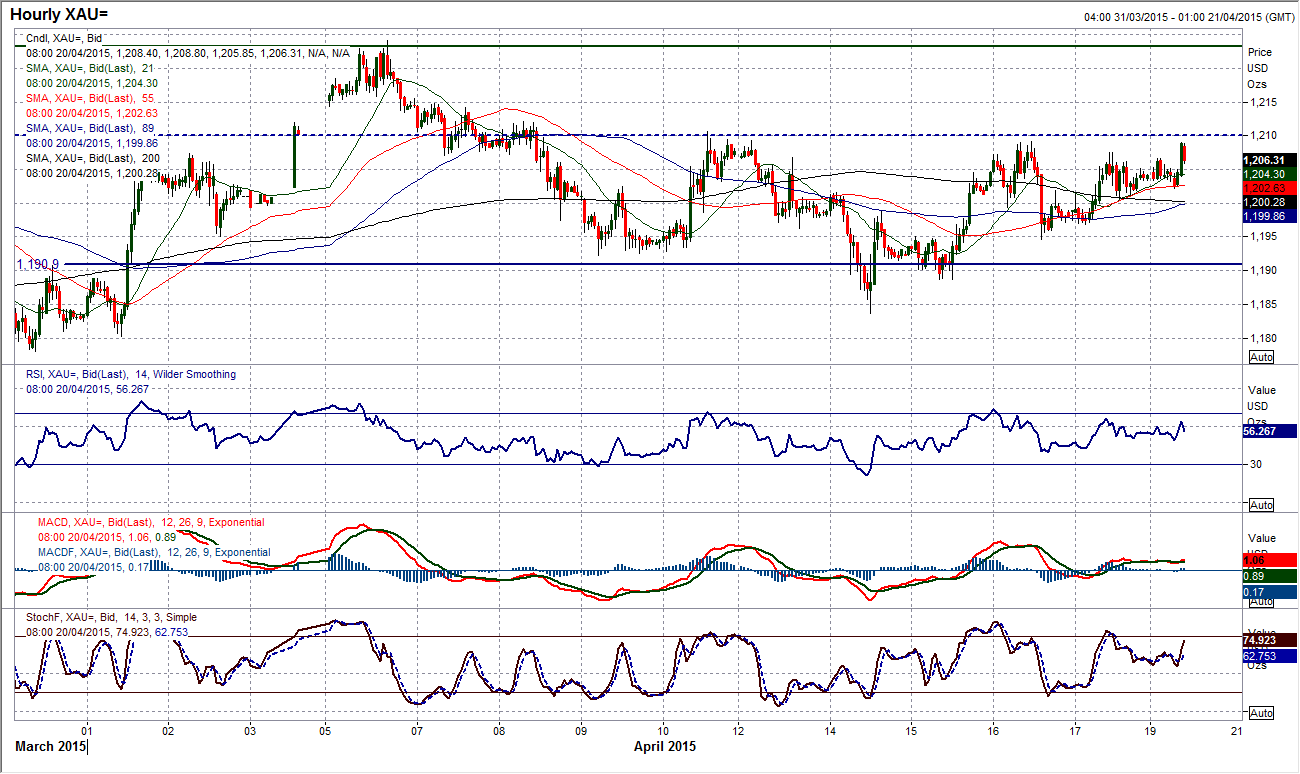
The tight range and the near term mixed outlook continue. The range that has formed between $1178/$1224 has now tightened and the bulls are failing to breach the resistance at $1210.70, with lows posted at $1183.70 and $1188.65. The last few days has seen a mixture of positive and negative candles and even the sequence of higher lows and higher highs has now been broken. Daily momentum indicators are all but neutral. It is almost as though the market is now waiting for a catalyst. In ranging situations such as these it is possible to play the near term range, with the extremes on the hourly RSI giving trading opportunities. However play this with caution as at some stage there is likely to be a breakout to end the consolidation.
WTI Oil
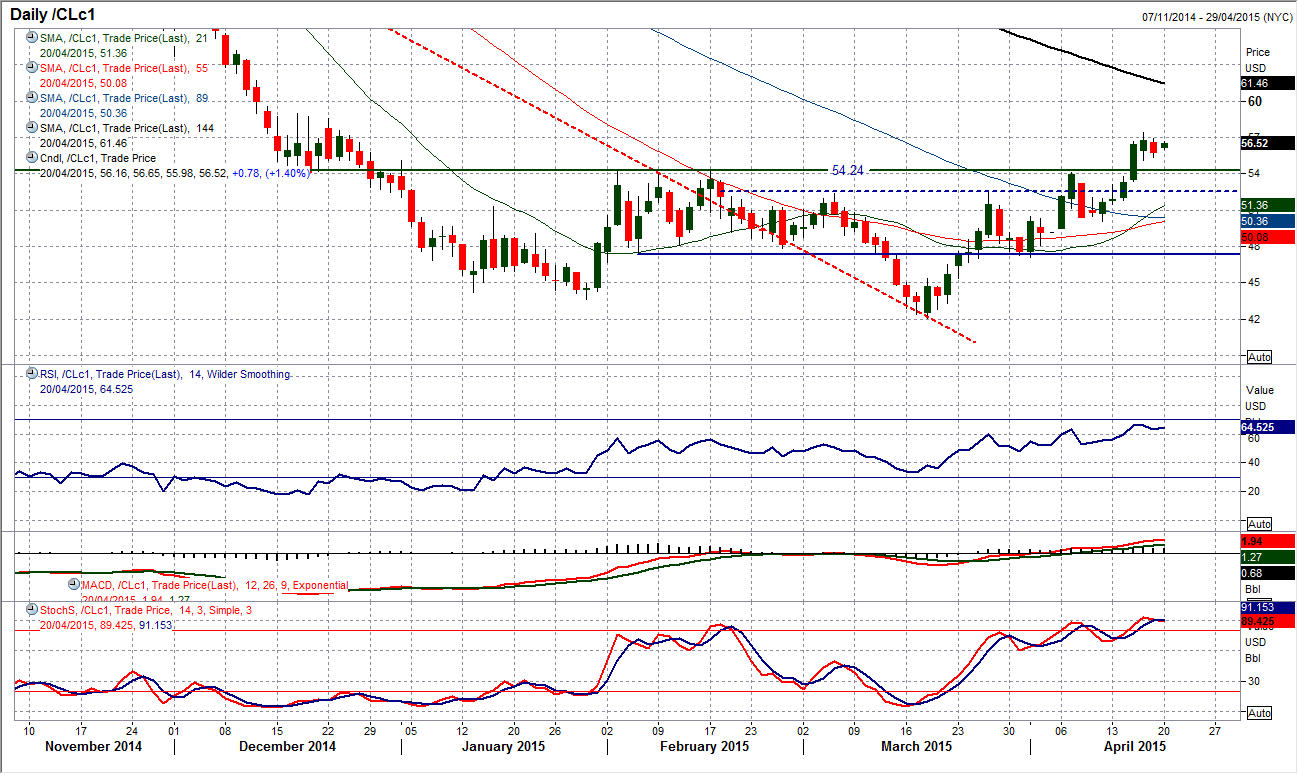
The daily chart shows a near term pullback on WTI after have completed a two day close above the key breakout resistance at $54.24. This move could turn into a pullback to the neckline of the breakout of the base pattern (which implies c. $65 in the coming months). The initial support comes in at $55.07 which was Thursday’s reaction low, but with the hourly momentum indicators showing a set of bearish near term divergences adds to the suggestion that a near term correction could be on. A pullback to the neckline would be a healthy medium term move. A break back above $57.42 re-opens the upside.
Note: All information on this page is subject to change. The use of this website constitutes acceptance of our user agreement. Please read our privacy policy and legal disclaimer. Opinions expressed at FXstreet.com are those of the individual authors and do not necessarily represent the opinion of FXstreet.com or its management. Risk Disclosure: Trading foreign exchange on margin carries a high level of risk, and may not be suitable for all investors. The high degree of leverage can work against you as well as for you. Before deciding to invest in foreign exchange you should carefully consider your investment objectives, level of experience, and risk appetite. The possibility exists that you could sustain a loss of some or all of your initial investment and therefore you should not invest money that you cannot afford to lose. You should be aware of all the risks associated with foreign exchange trading, and seek advice from an independent financial advisor if you have any doubts.
Recommended Content
Editors’ Picks
US economy grows at an annual rate of 1.6% in Q1 – LIVE

The US' real GDP expanded at an annual rate of 1.6% in the first quarter, the US Bureau of Economic Analysis' first estimate showed on Thursday. This reading came in worse than the market expectation for a growth of 2.5%.
EUR/USD retreats to 1.0700 after US GDP data

EUR/USD came under modest bearish pressure and retreated to the 1.0700 area. Although the US data showed that the economy grew at a softer pace than expected in Q1, strong inflation-related details provided a boost to the USD.
GBP/USD declines below 1.2500 with first reaction to US data

GBP/USD declined below 1.2500 and erased a portion of its daily gains with the immediate reaction to the US GDP report. The US economy expanded at a softer pace than expected in Q1 but the price deflator jumped to 3.4% from 1.8%.
Gold falls below $2,330 as US yields push higher

Gold came under modest bearish pressure and declined below $2,330. The benchmark 10-year US Treasury bond yield is up more than 1% on the day after US GDP report, making it difficult for XAU/USD to extend its daily recovery.
XRP extends its decline, crypto experts comment on Ripple stablecoin and benefits for XRP Ledger

Ripple extends decline to $0.52 on Thursday, wipes out weekly gains. Crypto expert asks Ripple CTO how the stablecoin will benefit the XRP Ledger and native token XRP.
