Market Overview
There is a mixed outlook across financial markets as we approach the key US data release of an interesting week. The general theme of weaker US data throughout this week has negatively impacted across dollar pairs which are now approaching some key levels. So the dollar bulls will be looking for a pick-up in US inflation to get them back on track. However across metals prices and equity markets there has been more of a consolidation despite the breakout to new 2015 highs on both WTI and Brent Crude oil prices. US earnings season has been a positive influence on Wall Street so far, but even strong numbers from Goldman Sachs could now prevent the S&P 500 from posting a 0.1% decline. Asian markets were also mixed overnight, with the Japanese Nikkei 225 down 1.2% as the yen has continued to hold recent strength. European markets are mixed to slightly lower in early trading today.
In forex trading, there is a lack of any real direction from the Asian session, with the dollar looking to steady the ship after another day of selling pressure. Gold and silver are both trading marginally higher. Traders will be watching out for UK unemployment at 0930BST which is expected to show a continued decline in unemployment to 5.6% and average earnings (ex-bonuses) rising slightly to +1.8%. There is also the final reading of Eurozone inflation data t 1000BST which is expected to show -0.1%. At 1330BST the US CPI inflation is expected to remain flat at 0.0% again after moving back to zero last week. The final key piece of data of the day is the US Michigan Consumer Sentiment at 1500BST which is expected to show a slight improvement to 94.0 from 91.2.
Chart of the Day – NZD/USD
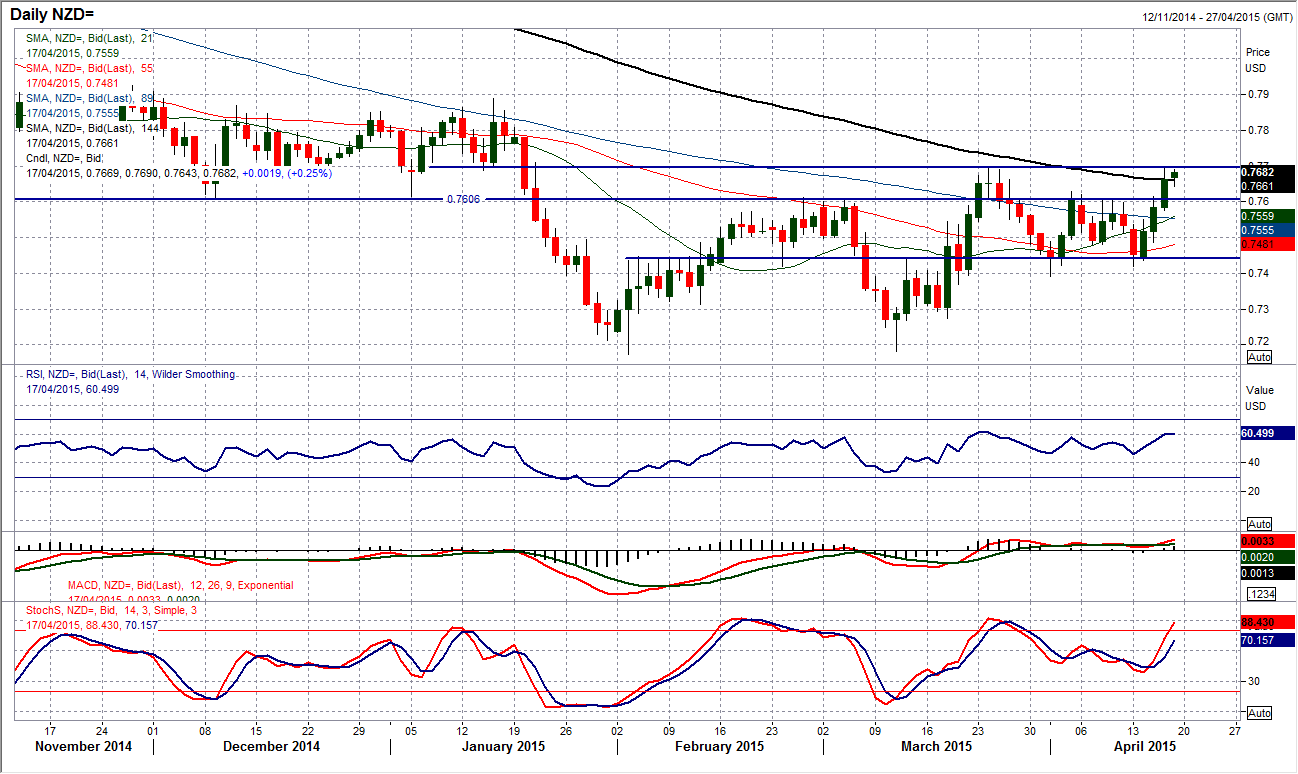
Can the Kiwi follow the oil price and break higher? It is certainly on the brink. In March the Kiwi turned lower to leave a high at $0.7695 and this resistance is once more under pressure today. Yesterday’s peak on my chart was $0.7697 but the move could not be sustained and fell away. A confirmed breach would actually complete a base pattern (similar to that on the oil price) which would at least imply a test of the next key overhead resistance at $0.7890. Daily momentum indicators are not leading the breakout yet, and are still suggesting the Kiwi remains a range play. This would all change though with a close above $0.7700. The intraday hourly chart shows the need for the bulls to continue to push the pair higher. However just recently there has been a falling over of the hourly MACD, RSI and Stochastics. That makes today’s trading key as the bulls need to back this run higher otherwise the profit takers could continue to play the range. A pullback below the old pivot level around $0.7600 would suggest the bulls have lost their way again.
EUR/USD
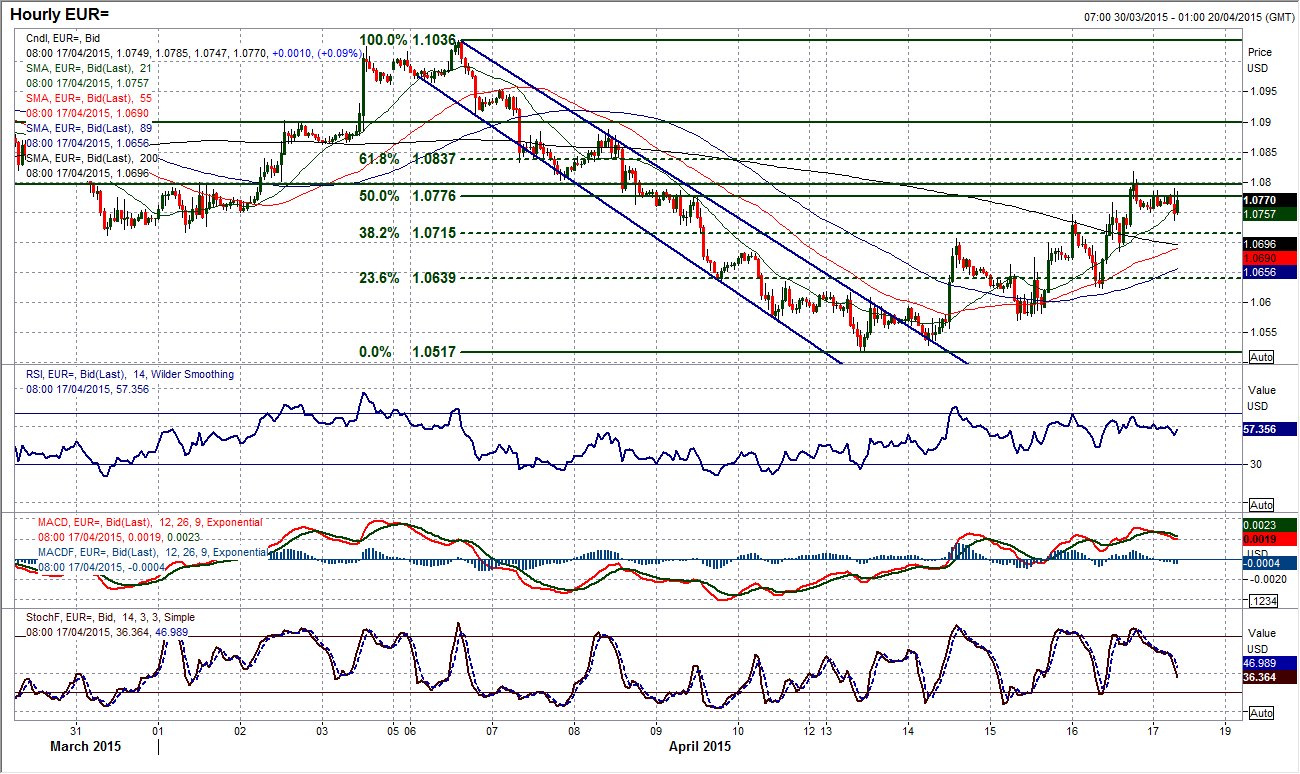
After seeing six days in a row of selling pressure the euro has now rebounded for the past three. I remain a seller into strength and I am once more now looking for an opportunity to sell. The daily momentum indicators retain a configuration that suggests rallies will be seen as a chance for the bears to reassert themselves. I have spoken recently about the key pivot levels at $1.0800 and $1.0900 and I see these as having important roles to play today. The intraday hourly chart shows that the euro has been consolidating around the 50% Fibonacci retracement of the $1.1035/$1.0519 decline at $1.0776. Furthermore there has also been a consolidation around $1.0800 overnight. A push back above $1.0800 would re-open $1.0900 but it is between the two at which I expect to see some sort of sell signal form. There is support now round $1.0700 initially and then $1.0620.
GBP/USD
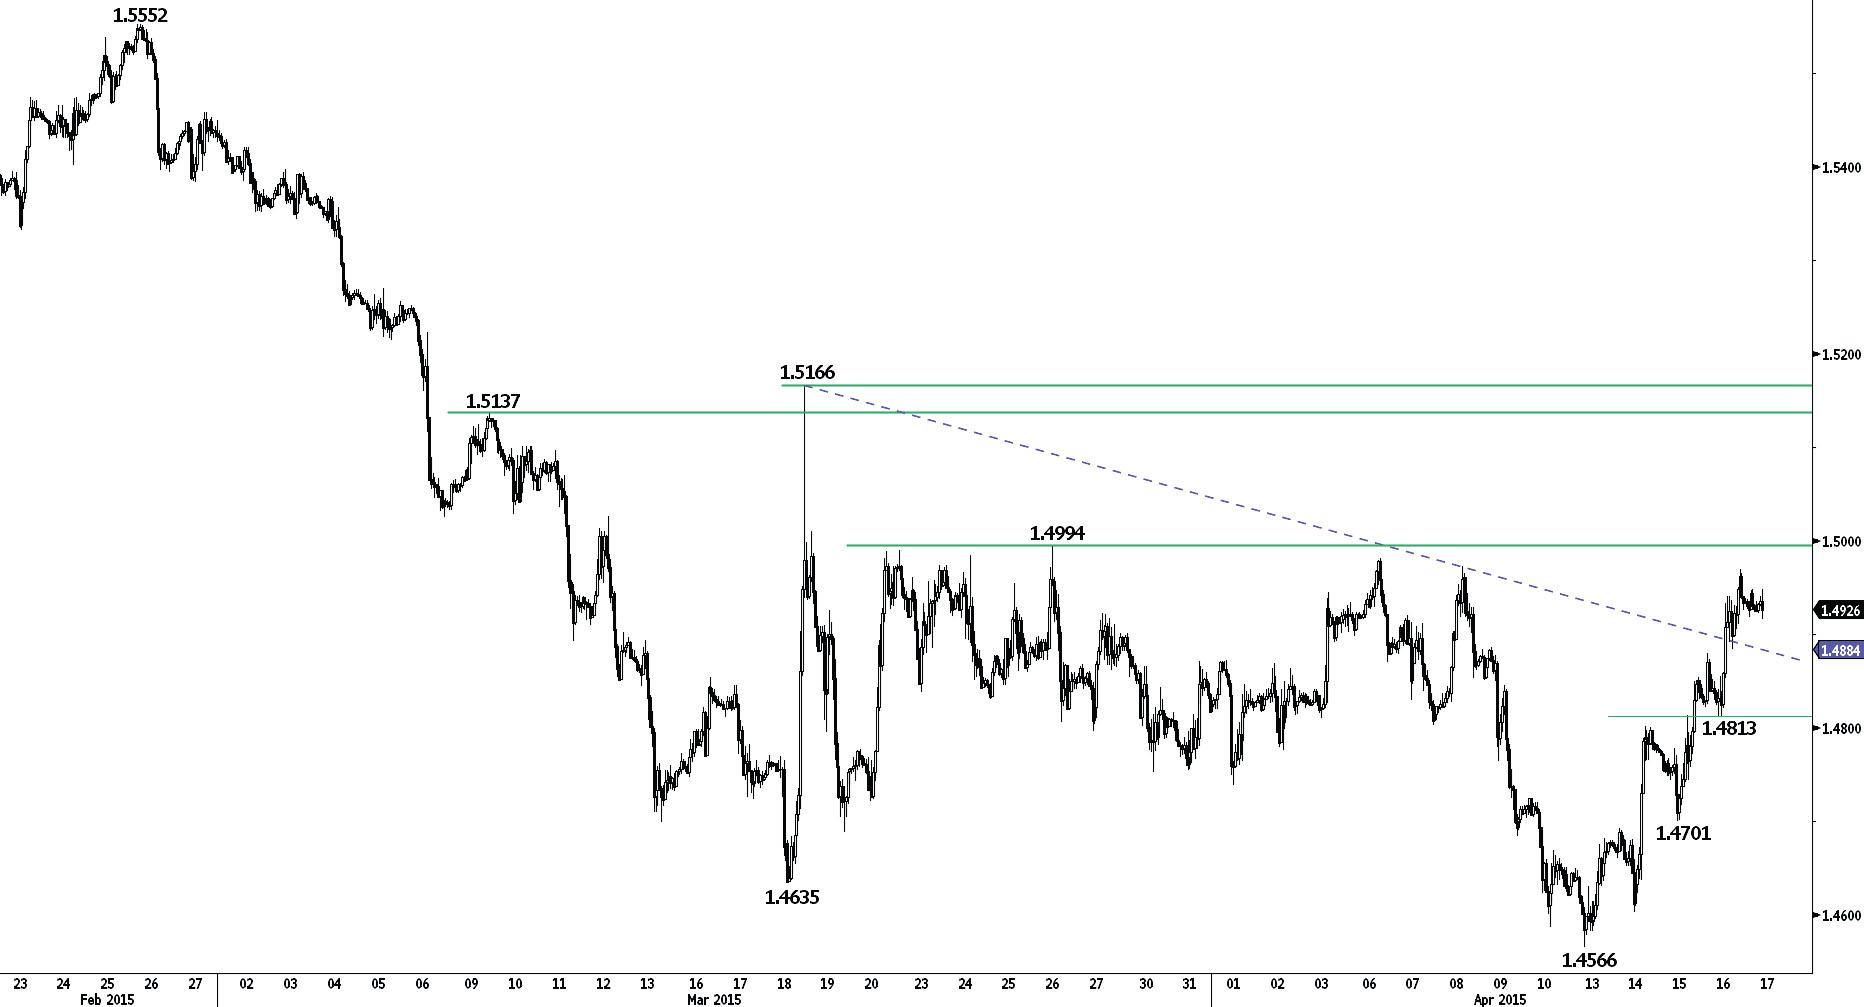
I continue to say this but the technical rally on Cable is a little more advanced than on the euro and could be the leader in terms of either an upside break or a resumption of the selling pressure. My expectation is that the resistance band $1.4950/$1.5000 which has been so strong for the past few weeks will once more play a role in driving the profit-taking in this run higher for the past four days. The main caveat I have for this outlook is that the Stochastics have bounced strongly in the past four days as Cable has posted four strong candles all of which closing towards the high of the daily range. That makes today’s trading very important as it is already testing this $1.4950/$1.5000 range. The intraday hourly chart shows a sequence of higher highs and higher lows, with positive configuration on the hourly momentum indicators. Yesterday’s peak at $1.4970 is the initial resistance, with support back around $1.4880. Today’s trading could be pivotal for the medium term outlook.
USD/JPY
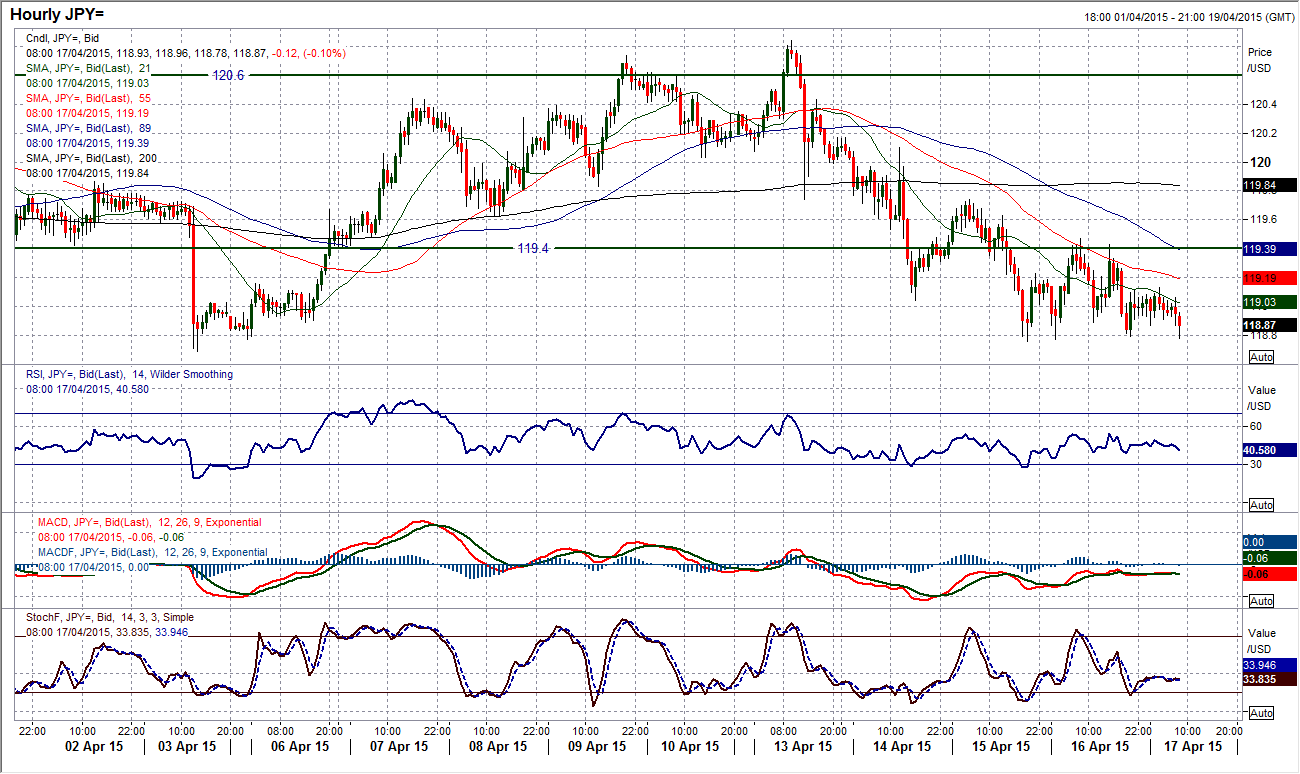
The pair completed a fifth consecutive negative candle yesterday but despite this there was an element of slowing in the selling pressure and there is still a sense that Dollar/Yen continues to trading in a sideways phase between 118.30/120.85. The momentum indicators on the daily chart are still rather neutral, although there is a slightly negative bias of late due to the last week of declines. The interesting chart is the hourly intraday, which shows a consolidation over the past 36 hours between the reaction low support at 118.70 and the key pivot level within the range at 119.40. The break either way of this mini range could determine the next move. For now I am neutral and see the sideways trading continuing but continued downside pressure would mean a big test of 118.30 again. Hourly momentum is still in negative configuration. It might be interesting to watch the falling 55 hour moving average (currently 119.20) which has been a resistance in the past few days. A breach of this to the upside could signal a lack of intent by the bears to keep going.
Gold
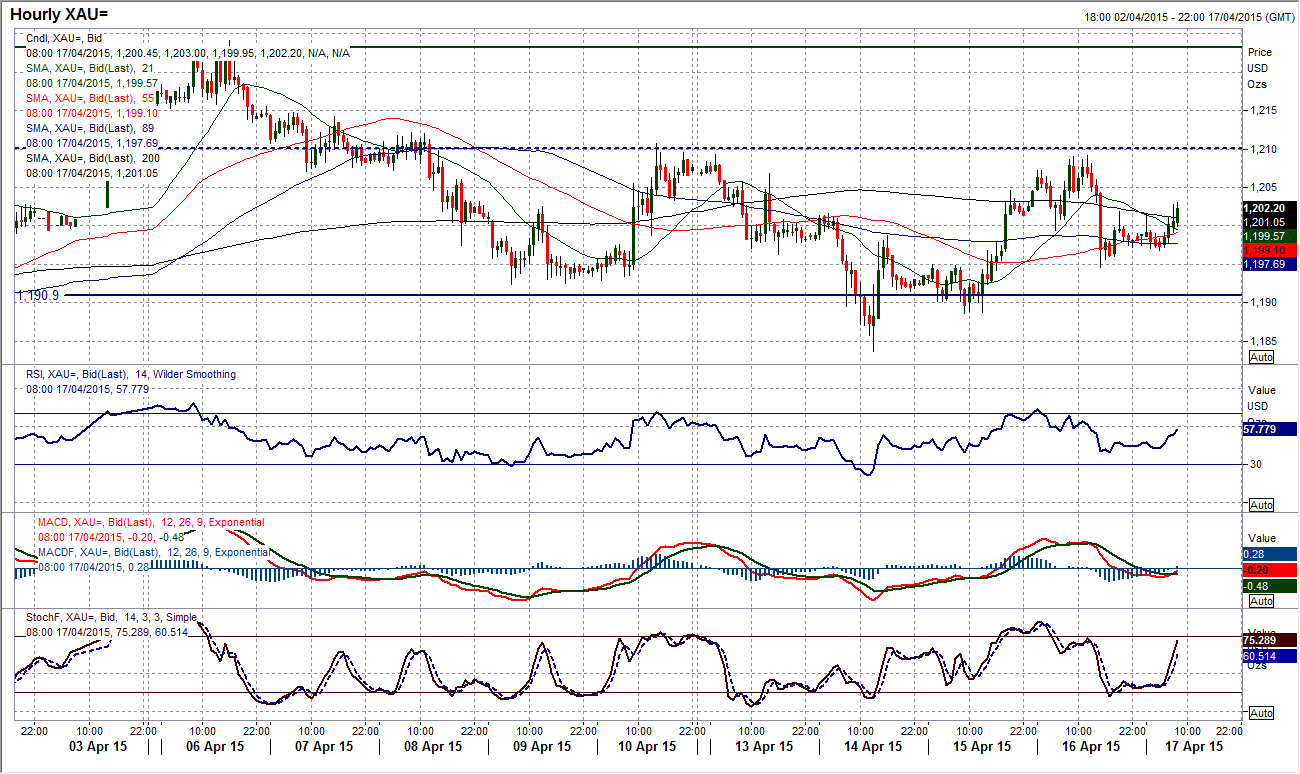
I have been saying for several days that gold is rangebound and once again, yesterday’s price action has done little to convinced me of anything else. Gold is in a range between the key support at $1178 and the resistance at $1224. The candles that have built up within that range over the past four weeks have all been fairly erratic with little real sense of trend forming and yesterday’s negative candle following a strong bullish candle plays into that theme. Momentum indicators are almost entirely neutral with even the one anomaly that was the falling Stochastics, now turning up once more. The intraday hourly chart shows that within the range there have been a couple of lows now left at $1183.70 and then $1188.60 to help provide support. There is also top-side resistance building around the $1210.70 high. Until these levels are breached there is little direction to be played. Perhaps it is possible to play the overbought/oversold hourly RSI, but aside from that there is little real direction to be found.
WTI Oil
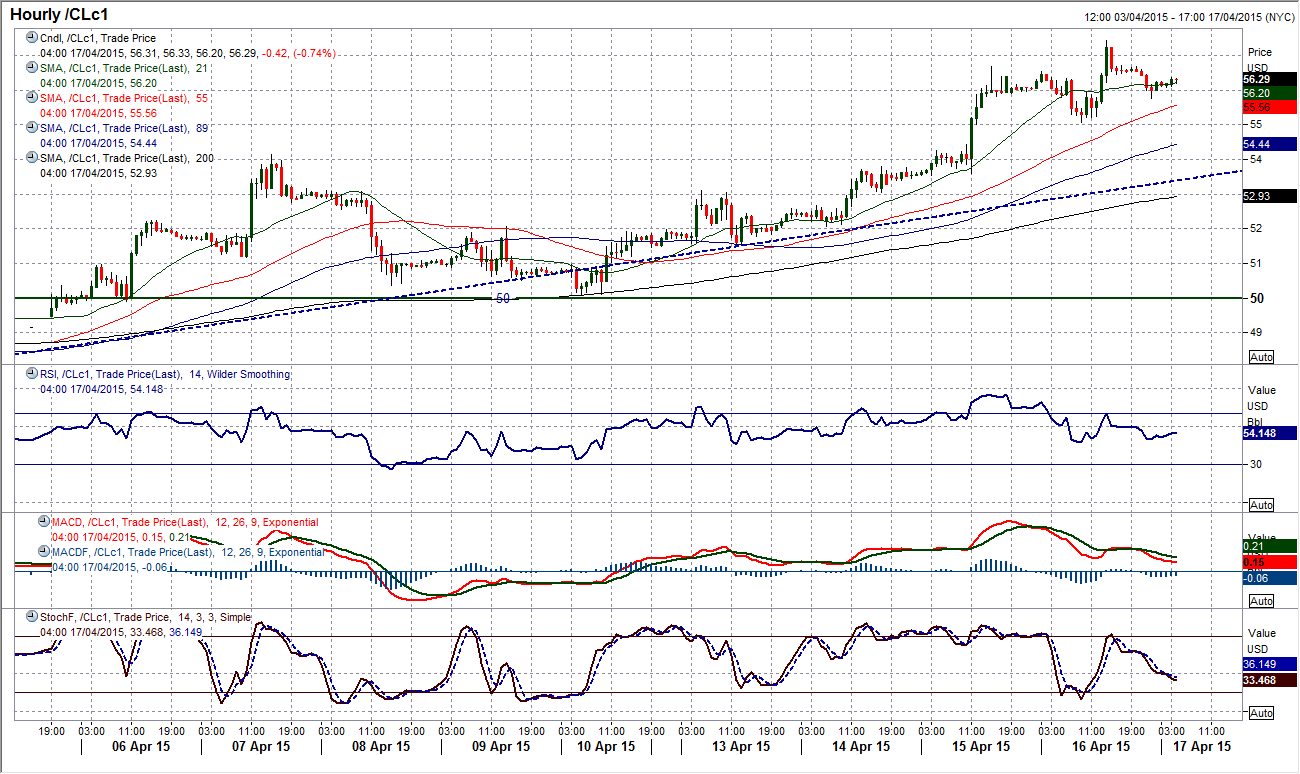
Following the sharp upside break that took the WTI price to a 2015 high, yesterday was a day more of consolidation. The outlook for the daily momentum indicators continues to improve as the RSI pushes towards the mid-60s, with MACD beginning to move solidly above neutral for the first time since July and the Stochastics also in bullish configuration. Not only that it has also achieved a 2 day close above the crucial resistance at $54.24 which adds to the conviction that bulls are accepting the breakout. The upside implied from the base pattern is now $65. The intraday hourly chart corrected nicely yesterday to help renew the immediate upside potential, leaving a low at $55.07 in the process. The resistance on a move back above the 2015 high of $56.69 re-opens a minor reaction high at $59.00 from December. Corrections look to be a good chance to buy now. The supports left above the key $50 low come in at $51.50 and $53.10 now.
Note: All information on this page is subject to change. The use of this website constitutes acceptance of our user agreement. Please read our privacy policy and legal disclaimer. Opinions expressed at FXstreet.com are those of the individual authors and do not necessarily represent the opinion of FXstreet.com or its management. Risk Disclosure: Trading foreign exchange on margin carries a high level of risk, and may not be suitable for all investors. The high degree of leverage can work against you as well as for you. Before deciding to invest in foreign exchange you should carefully consider your investment objectives, level of experience, and risk appetite. The possibility exists that you could sustain a loss of some or all of your initial investment and therefore you should not invest money that you cannot afford to lose. You should be aware of all the risks associated with foreign exchange trading, and seek advice from an independent financial advisor if you have any doubts.
Recommended Content
Editors’ Picks
EUR/USD holds steady near 1.0650 amid risk reset

EUR/USD is holding onto its recovery mode near 1.0650 in European trading on Friday. A recovery in risk sentiment is helping the pair, as the safe-haven US Dollar pares gains. Earlier today, reports of an Israeli strike inside Iran spooked markets.
GBP/USD recovers toward 1.2450 after UK Retail Sales data

GBP/USD is rebounding toward 1.2450 in early Europe on Friday, having tested 1.2400 after the UK Retail Sales volumes stagnated again in March, The pair recovers in tandem with risk sentiment, as traders take account of the likely Israel's missile strikes on Iran.
Gold price defends gains below $2,400 as geopolitical risks linger

Gold price is trading below $2,400 in European trading on Friday, holding its retreat from a fresh five-day high of $2,418. Despite the pullback, Gold price remains on track to book the fifth weekly gain in a row, supported by lingering Middle East geopolitical risks.
Bitcoin Weekly Forecast: BTC post-halving rally could be partially priced in Premium

Bitcoin price shows no signs of directional bias while it holds above $60,000. The fourth BTC halving is partially priced in, according to Deutsche Bank’s research.
Geopolitics once again take centre stage, as UK Retail Sales wither

Nearly a week to the day when Iran sent drones and missiles into Israel, Israel has retaliated and sent a missile into Iran. The initial reports caused a large uptick in the oil price.
