Market Overview
It was an interesting session yesterday, where market sentiment was positive on the back of talk of further stimulus in Asia and then the US session took positive data (improving Personal Consumption Expenditure and Pending Home Sales)in a positive fashion. This also drove dollar strength too. So we had the curious situation where positive data was both positive for equities and the dollar. This is something unusual for these markets of late, with equity markets seemingly scared of shockwaves of a move towards FOMC tightening. This is a positive sign for markets and it will be interesting to see if it is a mere one off day. On a data heavy week it will not be long before we get the chance to find out. In geopolitical events, there is apparently a 50/50 chance of a deal being done between the US and Iran over nuclear sanctions; whilst Germany is still to see a comprehensive list of reforms from Greece. With both situations, there is clearly an appetite for this to be done (although the Republicans might disagree with the Iranian talks), however there is still a degree of uncertainty.
Wall Street closed in positive territory, with the S&P 500 1.2% higher for its first consecutive gains since 17th February. Asian markets have been mixed overnight, with the Nikkei 225 lower by 1.0%, although other markets benefited from talk of further easing from the People’s Bank of China. The European markets are giving back a little of yesterday’s gains in early trade today.
In forex trading, once again we are seeing a broad dollar strength, with the euro coming under the most pressure. This dollar strength is also filtering through into the commodity space with gold and silver both lower again, whilst oil is also weaker.
Traders will be prepared for a raft of data today. The early European session we have German unemployment at 0855BST (flat at 6.5% with a reduced claimant count of 12,000 expected), the final reading of Q4 UK GDP at 0930BST (+0.5% and the same as the previous reading expected) and then the composite Eurozone inflation data at 1000BST (improvement to -0.1% expected). The US data starts in earnest at 1400BST with the CaseShiller home prices (+4.5% year on year expected) and then Consumer Confidence at 1500BST (a slight dip to 96.0 is expected). Chart of the Day – Silver
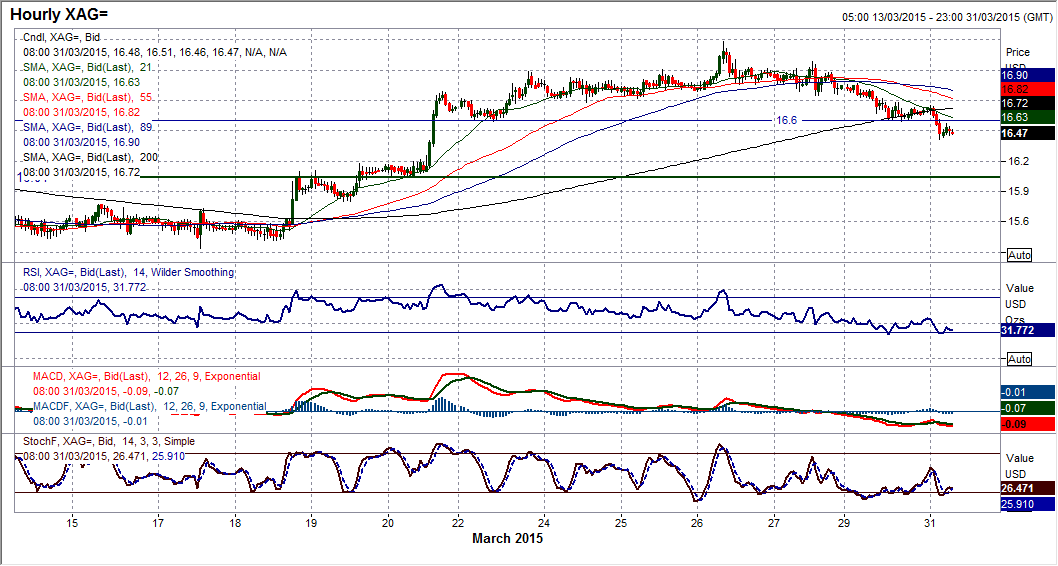
There is a still a strongly positive correlation between gold and silver and the charts certainly reflect that too with the strong rally of mid-March now rolling over and is now into a third corrective day. This is impacting across the momentum indicators which show a bearish crossover sell signal today being confirmed on the Stochastics and also the RSI now falling decisively. The old key pivot level around $16.60 held briefly yesterday but again today has been breached and it looks as though now the selling pressure is mounting. The hourly chart shows an attempt at building support around $16.60 which has been broken overnight and interestingly is already acting as a basis of resistance once more. Since mid-March the 21 hour moving average has been a decent gauge for silver and with the price having rolled over this indicator (currently at $16.64) has become a gauge of resistance. The hourly momentum has also turned corrective as well, with the suggestion now that any rally towards $16.60 should now be seen as a chance to sell for a move back towards the next basis of support at $16.04 which is an old key pivot level. There is further price resistance around $16.80. It would now need a move above $17.00 to defer the corrective pressure.
EUR/USD
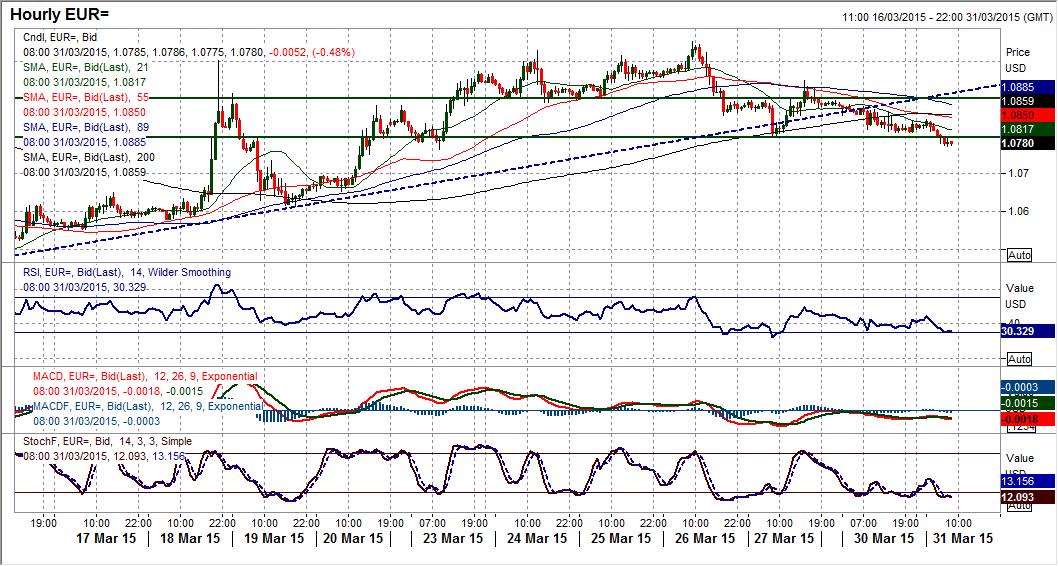
The daily chart shows a bearish drift has returned to the euro. The price now seems to be tracking the falling 21 day moving average and sliding along the support of the old downtrend. Momentum indicators have certainly rolled over now with RSI and Stochastics falling away and there is a feeling that the bulls have lost the control. When you look at the intraday hourly chart you also get a sense that the bears are on the brink of regaining control once more. There is a band of support $1.0766/$1.0800 which is now being tested and if this is breached it would be the lowest on the price since 20th March but also arguably complete a (rather asymmetrical) top pattern. In the past two days the hourly momentum has taken on more of a corrective outlook with the RSI and MACD lines especially in more negative configuration. This suggests that rallies are increasingly a chance to sell, whilst the 55 and 89 hour moving averages (both falling between $1.0850/$1.0890) are now a good gauge of resistance. If $1.0766 was decisively cleared then it would be likely for a break back towards $1.0620 support. Near term resistance is now $1.0950.
GBP/USD
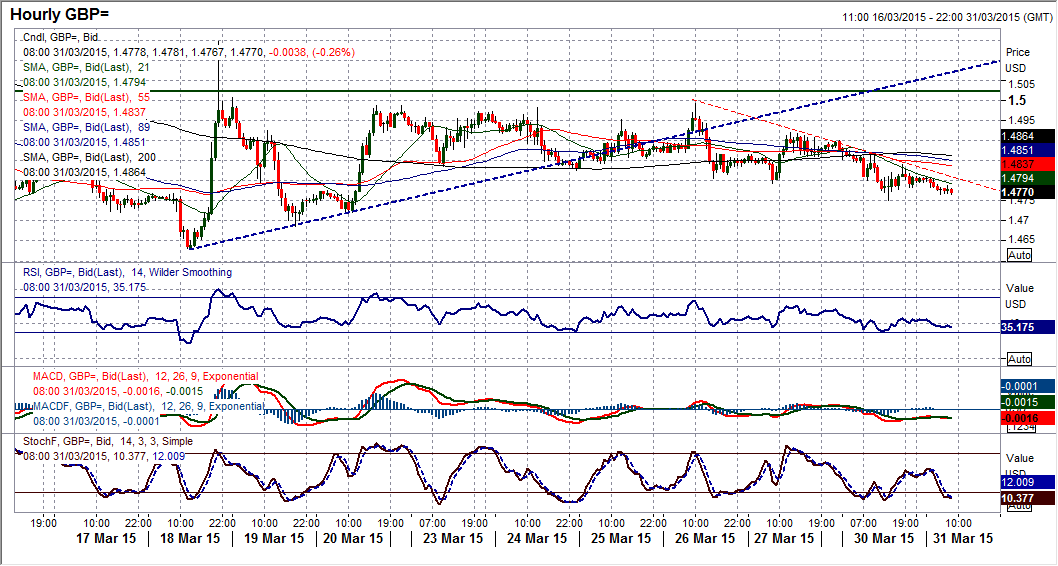
The last few days has seen Cable drifting away from the key band of resistance overhead at $1.5000 and now the bears look to be re-establishing control. The daily chart shows that the momentum indicators never really did anything more than unwind oversold momentum and the Stochastics are beginning to turn lower again as the RSI has dipped back into the 30s once more. The 21 day moving average remains a good basis of resistance around $1.4950 and there seems to be little to prevent a retest of the lows again at $1.4632. The intraday hourly chart is not decisively bearish but has certainly got more of a negative slant which suggests that the intraday rallies that are intermittently seen should be viewed as a chance to sell. In the last two sessions there have been intraday rallies of between 90 and 130 pips, both of which have left lower highs and would have given decent opportunities. The moves have now left a key near term resistance at $1.4920. The support around $1.4800 was breached yesterday to open the next low around $1.4685 but there should be a test of the lows in due course.
USD/JPY
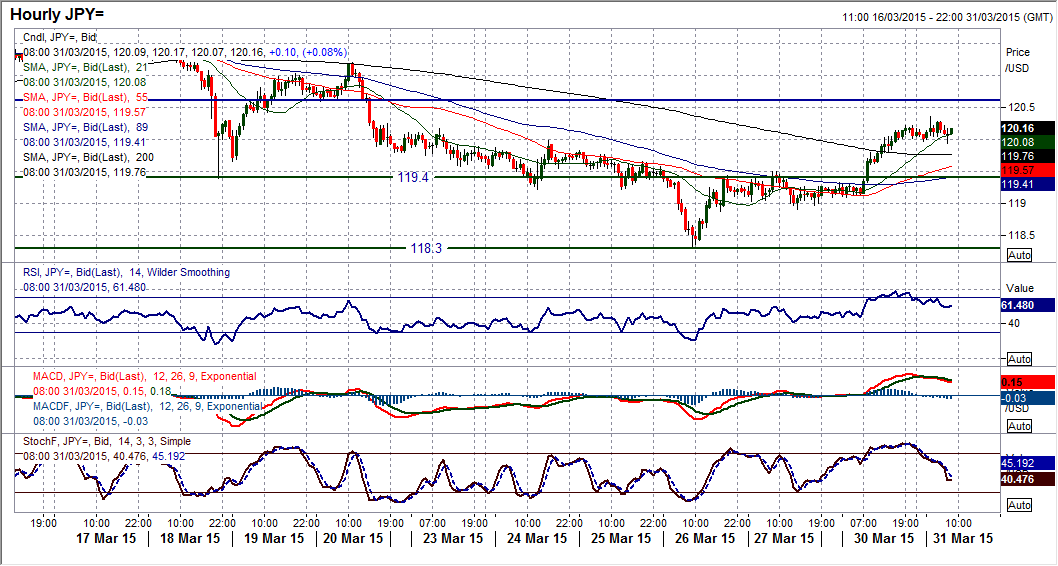
I still view Dollar/Yen as a good gauge of sentiment for the market as a risk-on market would not be putting money into the yen. So yesterday’s rally was generally heartening to see (interestingly coming with rallying equities as well). This strong move on the pair has had a significant impact on the daily chart which had been bearishly drifting lower across momentum indicators and now this move just alters the mind-set once more. The Stochastics have picked up significantly, as has the RSI which has moved higher from the low 40s. These indicators could suggest the bullish bias is returning once more. A positive day today could go a long way towards confirming this. The hourly chart shows the resistance that was in place at 119.40 but then the burst of gains once the resistance was breached. This 119.40 level now becomes supportive. It was also bullish to clear the resistance around 120.00. There is a consolidation now around the breakout, with the momentum indicators just taking a breather. I would be looking now for another higher low to be posted between 119.40/120.00 to continue the sequence of higher lows (latest at 118.90) as the improvement continues. The pair is looking to now retest the next near term resistance around 121.20. A loss of support now at 119.40 would disappoint, with below 118.90 suggesting bearish control again.
Gold
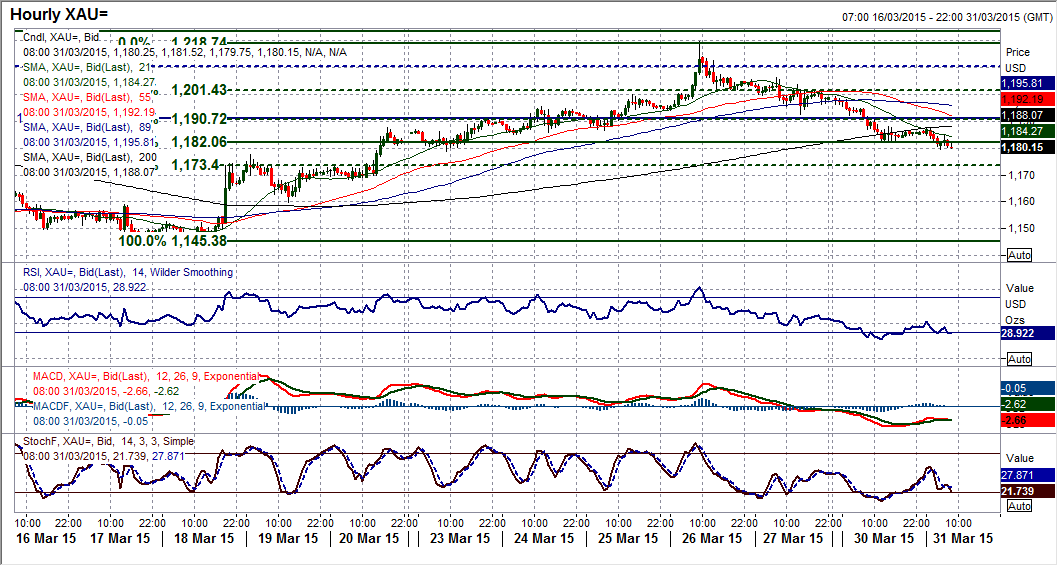
Taking a step back and looking across the forex majors, the concern is that there is a gradual shift back towards dollar strength once more and this is again reflected in the gold price. There is no mass sell-off, but just a slow negative drift which is strangling the life out of the gold rally. The seven day rally has turned round and is now into its third days of correction once more. The momentum indicators have all rolled over with the RSI failing under 60 and the Stochastics arguably giving a bearish crossover sell signal (especially if this is seen as simply a bear market rally). The intraday hourly chart shows the gradual drift lower of the past three days as support after support that was left during the rally is now being eaten away. I spoke yesterday of the loss of $1185 support that would open $1175 and then $1159.66 and the hourly momentum shows that there is a turn to a more corrective outlook. Interestingly the old key floor around $1191 has become a near term pivot level which could now be looked upon as a chance to sell, whilst $1200 is also resistance. It would now need a rally above $1206.20 to defer the correction.
WTI Oil
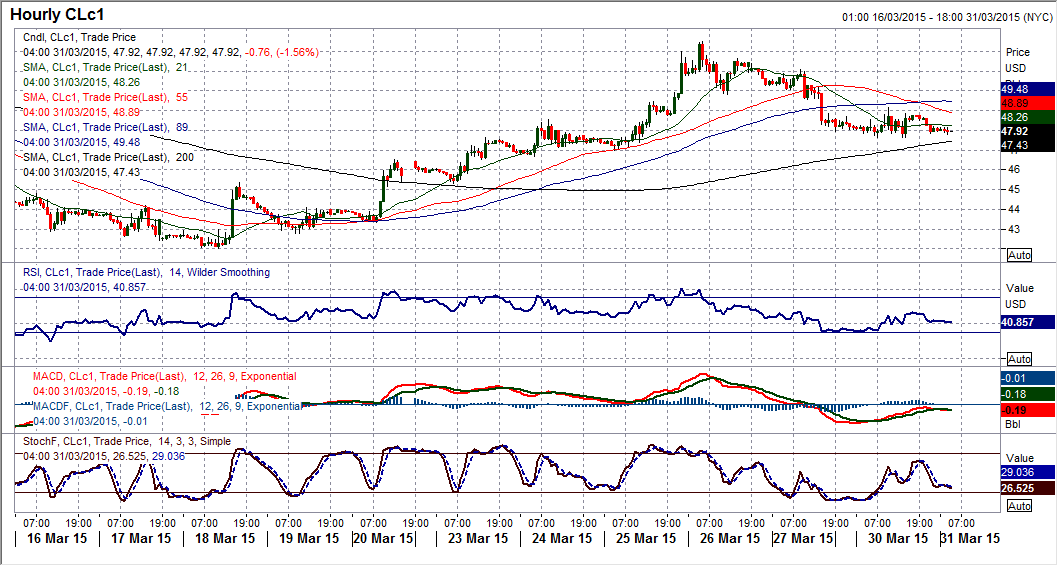
The correction on WTI has started to show an element of consolidation and it is interesting that this is coming just above the old key floor of $47.36. This suggests that whilst the recovery bulls may have lost near term control the outlook is not bearish. However, the key as to whether this will turn out to be just a consolidation within a new corrective move, or a buying opportunity, could now be the overhead barrier of indicators such as the falling 55 hour moving average at $48.95. Additionally, there were some lows that came in around $49.50/$49.80 from Thursday/Friday last week which are now areas of overhead supply. Also watch the hourly RSI which had formerly been in bullish configuration during the rebound, but the outlook has changed. If the hourly RSI is unable to break back above 60 whilst consistently moving towards the low 30s then the outlook will be deteriorating and pressure will continue towards the $46.67/$47.00 support band.
Note: All information on this page is subject to change. The use of this website constitutes acceptance of our user agreement. Please read our privacy policy and legal disclaimer. Opinions expressed at FXstreet.com are those of the individual authors and do not necessarily represent the opinion of FXstreet.com or its management. Risk Disclosure: Trading foreign exchange on margin carries a high level of risk, and may not be suitable for all investors. The high degree of leverage can work against you as well as for you. Before deciding to invest in foreign exchange you should carefully consider your investment objectives, level of experience, and risk appetite. The possibility exists that you could sustain a loss of some or all of your initial investment and therefore you should not invest money that you cannot afford to lose. You should be aware of all the risks associated with foreign exchange trading, and seek advice from an independent financial advisor if you have any doubts.
Recommended Content
Editors’ Picks
EUR/USD stays near 1.0700 after US data

EUR/USD stays in a consolidation phase at around 1.0700 in the early American session on Wednesday. The data from the US showed a strong increase in Durable Goods Orders but failed to provide a boost to the US Dollar.
USD/JPY refreshes 34-year high, attacks 155.00 as intervention risks loom

USD/JPY is renewing a multi-decade high, closing in on 155.00. Traders turn cautious on heightened risks of Japan's FX intervention. Broad US Dollar rebound aids the upside in the major. US Durable Goods data are next on tap.
Gold manages to hold above $2,300

Gold struggles to stage a rebound following Monday's sharp decline but manages to hold above $2,300. The benchmark 10-year US Treasury bond yield stays in the green above 4.6% ahead of US data, not allowing XAU/USD to gain traction.
Worldcoin looks set for comeback despite Nvidia’s 22% crash Premium

Worldcoin price is in a better position than last week's and shows signs of a potential comeback. This development occurs amid the sharp decline in the valuation of the popular GPU manufacturer Nvidia.
Three fundamentals for the week: US GDP, BoJ and the Fed's favorite inflation gauge stand out Premium

While it is hard to predict when geopolitical news erupts, the level of tension is lower – allowing for key data to have its say. This week's US figures are set to shape the Federal Reserve's decision next week – and the Bank of Japan may struggle to halt the Yen's deterioration.
