Market Overview
The market sentiment is a touch missed going into what could be a crucial week of economic data. Several days of selling pressure were halted on Friday as Janet Yellen made comments that seemed to suggest there was no immediate rush to raise interest rates and that when it did come it would be a slow and steady process. This helped to avoid a 5th consecutive negative close on Wall Street and saw the S&P 500 rally by 0.2%.
Asian markets have been slightly higher today despite a weak set of Japanese industrial data which saw industrial production falling by 3.4% which was worse than expected. Alongside comments coming from the People’s Bank of China about the slide in growth this has the potential to drive further easing to monetary policy by both Japan and China. This allowed the Nikkei to close around 0.8% higher. European markets are set to follow the Wall Street bounce into the close and are currently seeing early gains.
In forex trading the majors are all under a little bit of pressure against the US dollar with Cable seemingly under the most pressure. Traders will be looking out for the German inflation data that is released throughout the morning culminating in the country-wide data at around 1300BST. There is also the Personal Consumption Expenditure at 1330BST which is the Fed’s preferred measure of inflation, so markets will be looking for any uptick in inflation even though Yellen suggested on Friday that an increase in core inflation was not essential to an increase in rates. Note the time change in the European markets today following on from the shift to summer time over the weekend.
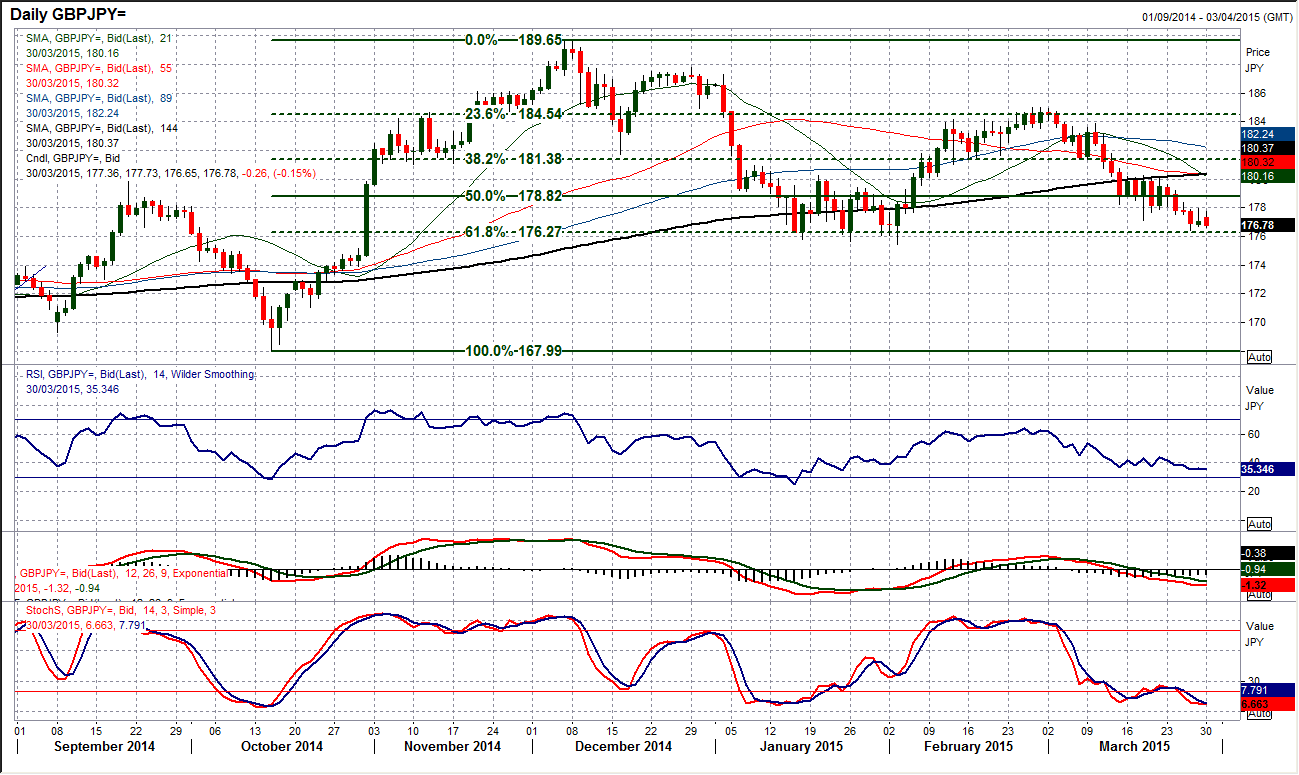
Chart of the Day – GBP/JPY
The downside pressure has been continuing for a few weeks now but is once more coming up to a crucial test of support. The Fibonacci retracement levels of the big October to December bull run from 168.00/179.65 have been an excellent gauge for turning levels and consolidations over the past few months. The 61.8% retracement is at 176.27 and played a strong role in the holding of support in January and February. Now this level is close again, being used on Thursday for the low and which continues to hold. Momentum indicators show a clear corrective bias with RSI, Stochastics and MACD all in deterioration, but this level of support is now crucial for the near/medium term outlook. A confirmed breach of support (and a close below 175.45) would re-open the downside once more for a potential full retracement towards 168.00 with only 171.00 support to prop up the price. The intraday hourly chart shows a resistance band 177.50/177.90 providing a barrier to the upside now.
EUR/USD
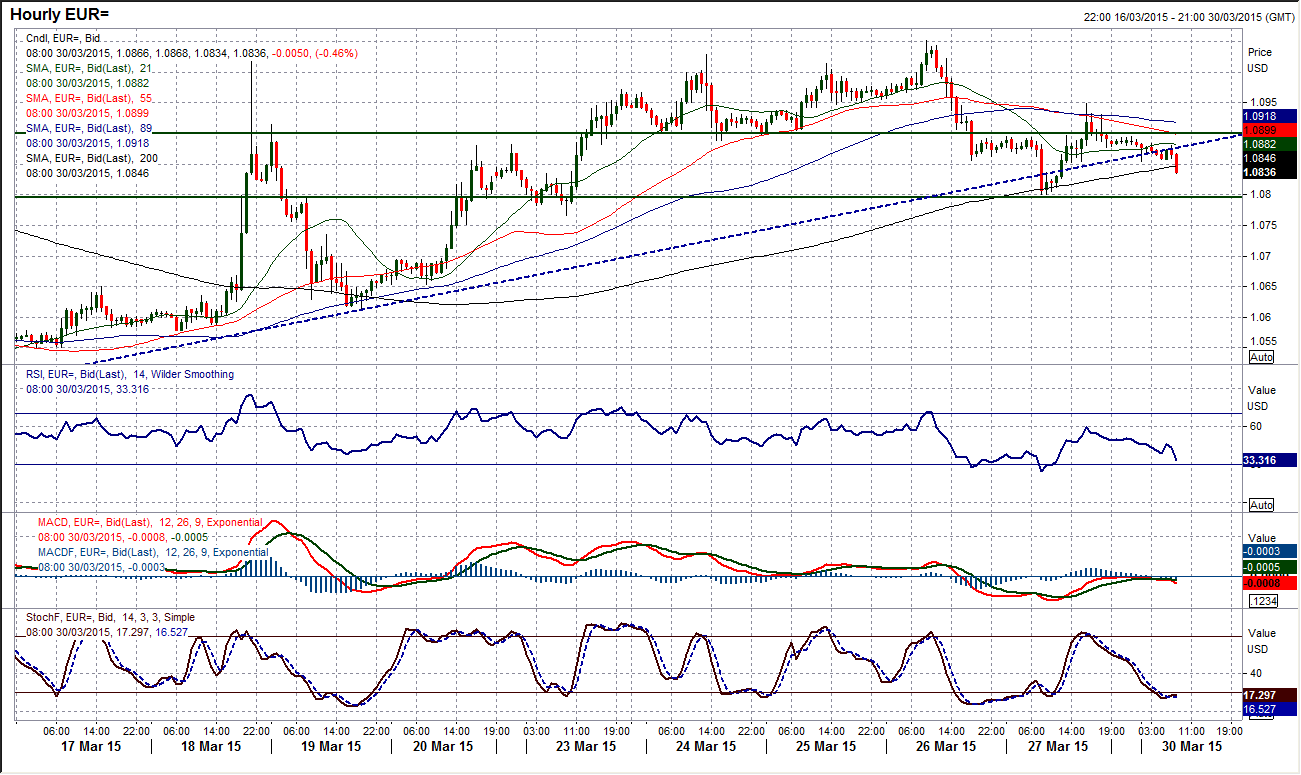
The outlook for the euro is becoming increasingly settled now following the sharp volatility in the wake of the FOMC meeting on 18th March. What we are now seeing are the momentum indicators flattening off on a near to medium term basis and the price beginning to settle around the 21 day moving average which is also beginning to settle. The intraday chart shows the consolidation means that the uptrend formed in the past 10 days is being broken, whilst it is apparent that the pivot level around $1.0900 could now be forming a 50 pip band of resistance up to $1.0950. The hourly MACD lines suggest that the bulls have lost the upside impetus as the recent rebound has rolled over at the neutral line, whilst the Stochastics and RSI also suggest there is no longer an outright bullish outlook. The support is now in at $1.0807, but the low at $1.0766 protects the outlook from turning bearish now as we wait for direction to form.
GBP/USD
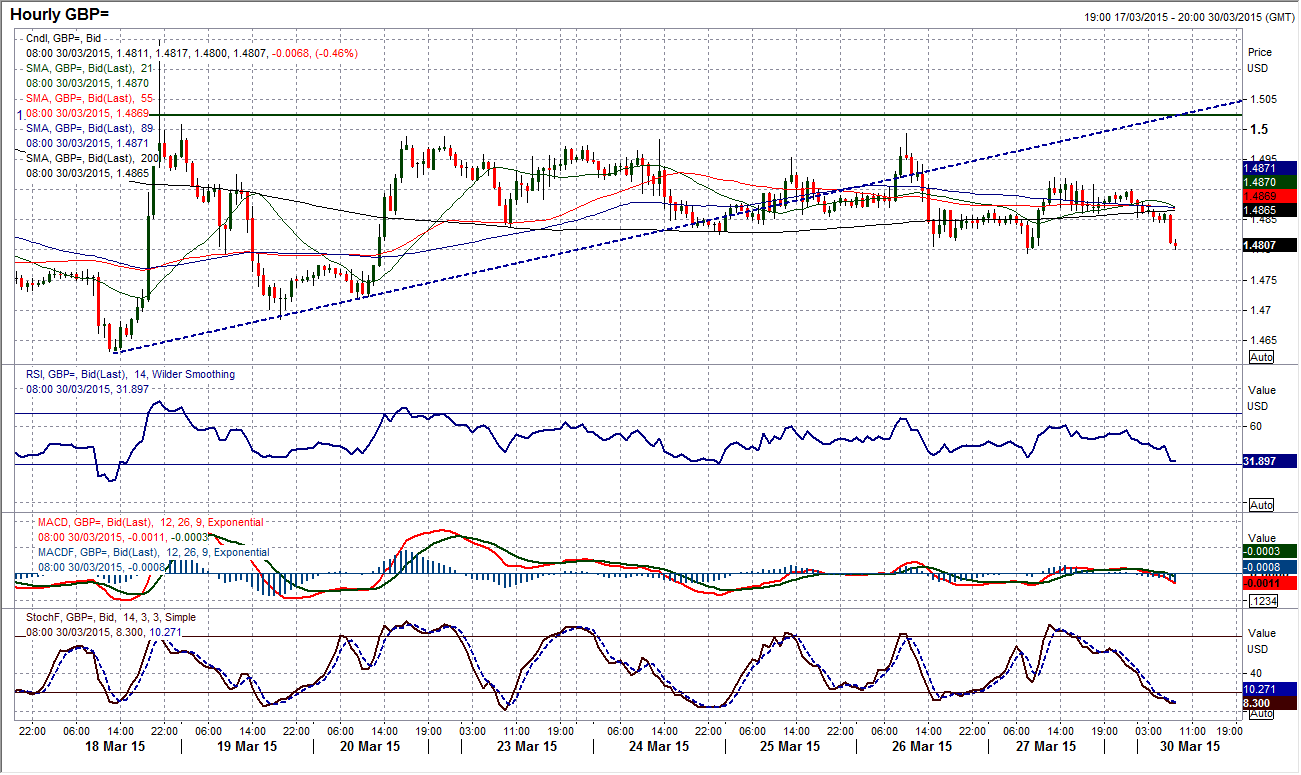
An incredible consolidation has formed in recent days but there is still a slight bearish bias to proceedings which is again threatening to show through this morning. The past three completed sessions have all been very settled as the momentum indicators have plateaued. The resistance continues to be formed under $1.5000 and the 21 day moving average is a key indicator now in this consolidation as it remains a basis of resistance (currently falling around $1.4975). The intraday chart reflects this consolidation even more with the hourly moving averages flat and choppy trading in the past few days. If the support around $1.4800 is holding it becomes possible to play the classic RSI signals on the hourly chart, buying between 30/25 and selling between 65/70. A decisive breach of support at $1.4800 would re-engage the sellers and open a retest of $1.4685.
USD/JPY
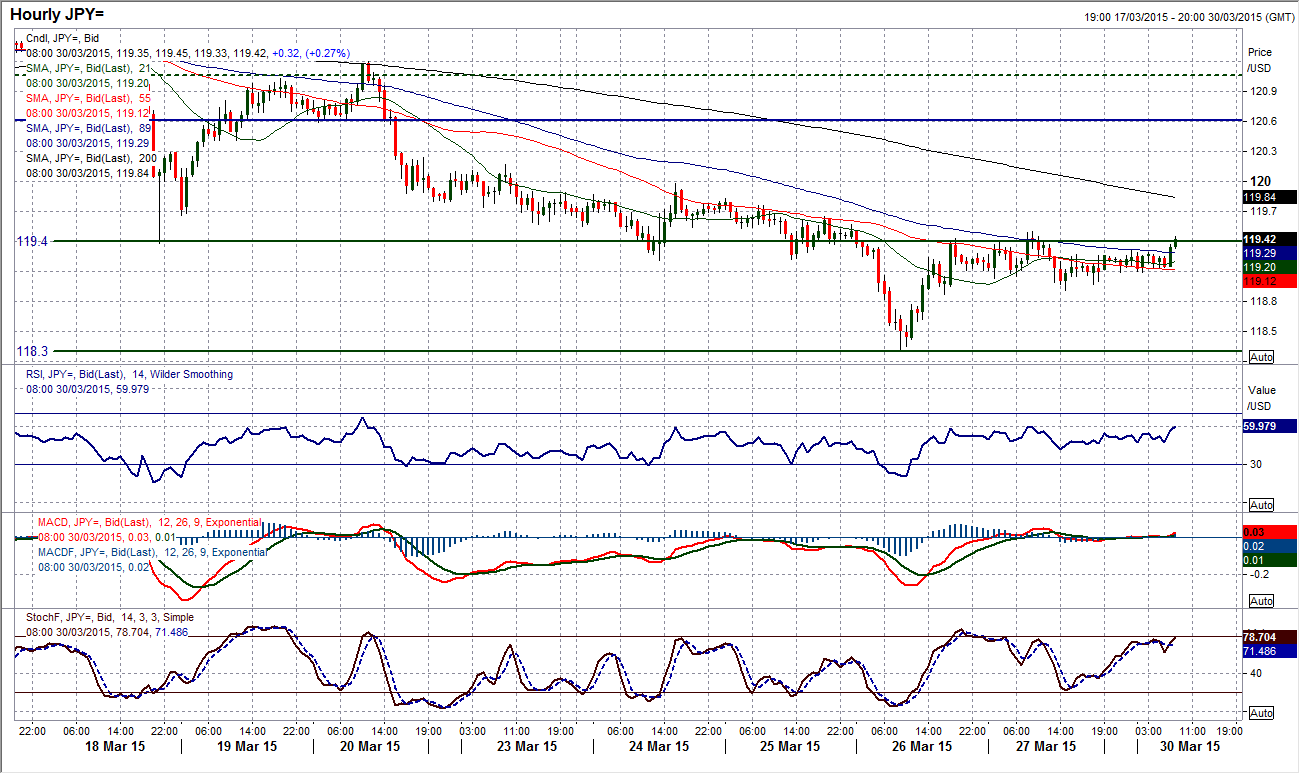
The outlook on the yen is also settling down and the consolidation is seeing indicators plateau around neutral. The MACD lines are around neutral, whilst the RSI is just in the low 40s, whilst Stochastics have stopped falling. There is though still a slight bearish bias to the outlook now for the near to medium term with the intraday hourly chart showing that the old support band around 119.40 is now acting as an area of resistance. Although there is no explicit selling pressure in the near term a failure of minor support at 118.90 would begin to suggest a drift back towards a test of the key low at 118.30 again. Wit would probably take a breach of the resistance at 120.00 to suggest the bulls were gaining some sort of near term control.
Gold
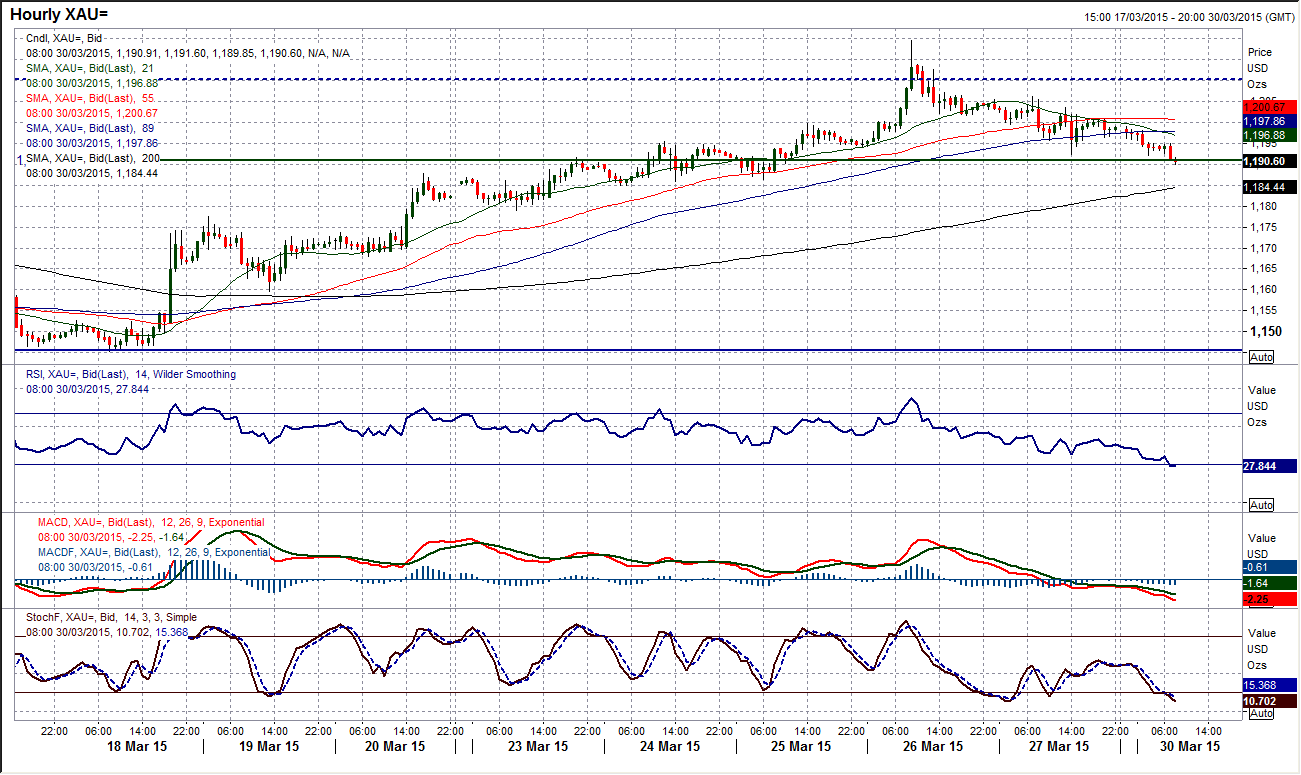
The bull rally has just run out of steam after having completed 7 consecutive days of gains. With the move seemingly continuing today, the momentum indicators are rolling over and pressure is beginning to be applied on support. Although there is no clear selling pressure being applied it is more of a slow a steady drift lower. The hourly chart reflects this loss of control that the bulls now face as the hourly momentum indicators such as the RSI and MACD lines are now facing far more of a corrective configuration. Also the last couple of days has seen resistance forming at successively lower levels and pressure being applied to the support band $1185/$1191. There are numerous support levels that have been left on the way up which could be tested should the support around $1185 be breached, with the main ones coming in around $1180 and $1159.65.
WTI Oil
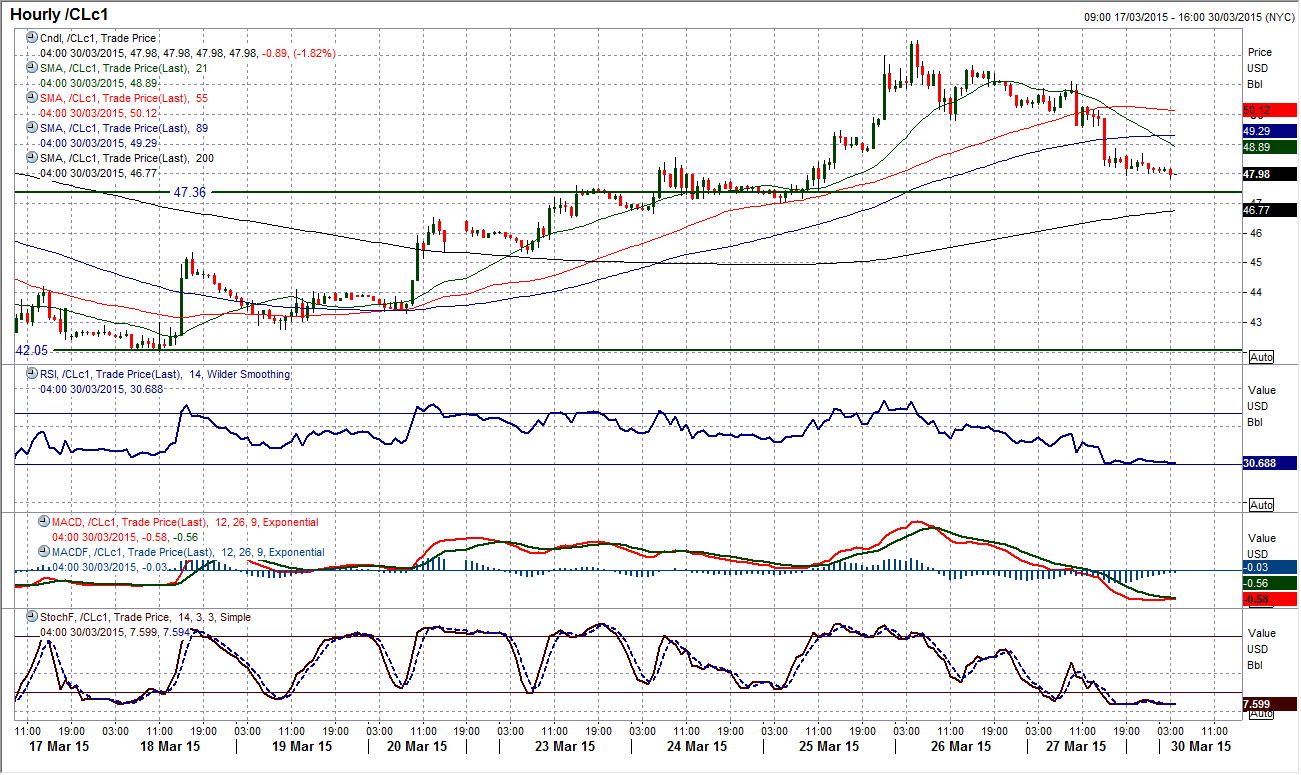
The recovery of 5 days of gains began to reverse on Friday. With resistance in place at $54.20, the selling pressure accelerated through late in the session for the price to close sharply lower, back below $50 again. The intraday hourly chart shows the outlook now deteriorating. The 55 hour moving average (at $50.15) had been the basis of support through the uptrend but this has now failed, whilst hourly momentum indicators are suggesting the positive momentum of the recovery has also turned corrective. A sequence of lower highs is now beginning to form with $51.10 and $51.65 coming in below the high, whilst there is initial resistance around $49.50. A retreat back towards the support of the old key floor around $47.36 seems to be building.
Note: All information on this page is subject to change. The use of this website constitutes acceptance of our user agreement. Please read our privacy policy and legal disclaimer. Opinions expressed at FXstreet.com are those of the individual authors and do not necessarily represent the opinion of FXstreet.com or its management. Risk Disclosure: Trading foreign exchange on margin carries a high level of risk, and may not be suitable for all investors. The high degree of leverage can work against you as well as for you. Before deciding to invest in foreign exchange you should carefully consider your investment objectives, level of experience, and risk appetite. The possibility exists that you could sustain a loss of some or all of your initial investment and therefore you should not invest money that you cannot afford to lose. You should be aware of all the risks associated with foreign exchange trading, and seek advice from an independent financial advisor if you have any doubts.
Recommended Content
Editors’ Picks
EUR/USD clings to daily gains above 1.0650

EUR/USD gained traction and turned positive on the day above 1.0650. The improvement seen in risk mood following the earlier flight to safety weighs on the US Dollar ahead of the weekend and helps the pair push higher.
GBP/USD recovers toward 1.2450 after UK Retail Sales data

GBP/USD reversed its direction and advanced to the 1.2450 area after touching a fresh multi-month low below 1.2400 in the Asian session. The positive shift seen in risk mood on easing fears over a deepening Iran-Israel conflict supports the pair.
Gold holds steady at around $2,380 following earlier spike

Gold stabilized near $2,380 after spiking above $2,400 with the immediate reaction to reports of Israel striking Iran. Meanwhile, the pullback seen in the US Treasury bond yields helps XAU/USD hold its ground.
Bitcoin Weekly Forecast: BTC post-halving rally could be partially priced in Premium

Bitcoin price shows no signs of directional bias while it holds above $60,000. The fourth BTC halving is partially priced in, according to Deutsche Bank’s research.
Week ahead – US GDP and BoJ decision on top of next week’s agenda

US GDP, core PCE and PMIs the next tests for the Dollar. Investors await BoJ for guidance about next rate hike. EU and UK PMIs, as well as Australian CPIs also on tap.
