Market Overview
The interesting moves in the last 24 hours came in the forex markets yesterday as comments from FOMC member Dennis Lockhart resulted in the dollar strengthening into the afternoon and caused a sharp turnaround on some of the major pairs. Lockhart, who has traditionally kept a dovish stance, somewhat hawkishly suggested that the potential for a rate hike in the meetings of June, July and September was still on the table. How sustainable this move is remains to be seen but there has been a degree of uncertainty put on the markets once more. There is still a slight element of safe haven demand as Saudi Arabia continued to bomb positions in Yemen. This has the potential to cause supply issues for oil, which has subsequently pushed the price higher. This has also helped to drive gold and the yen higher too.
There has been a fairly muted steer from action later in the US session which has seen markets lower again without any real selling pressure taking hold. On Wall Street the S&P 500 closed 0.2% lower. Asian markets focused on the weaker than expected Japanese data which showed retail sales disappoint and the inflation figures (adjusted for the sales tax hike) coming in at flat which suggested that Japan was on the brink of moving back into deflation. This is a double edge sword as it suggests the economy is slowing but could also induce further stimulus from the Bank of Japan. The Nikkei was 1% lower overnight. European markets are looking on the bright side this morning, with slight gains being seen.
Forex markets are showing a dollar strength beginning to resume, with the euro and the commodity currencies (Aussie and Kiwi) are under more pressure as the oil price has just dipped back slightly today. There is little significant data being released from Europe so traders will be looking towards the final reading of US Q4 2014 GDP at 1230GMT. The expectation is for a slight upward revision to 2.4% (from the previous reading of 2.2%) although this is still way below the 5.0% seen in Q3. There is also the final University of Michigan Sentiment at 1400GMT which is expected to improve slightly to 92.5 (from 91.2%).
Chart of the Day – AUD/USD
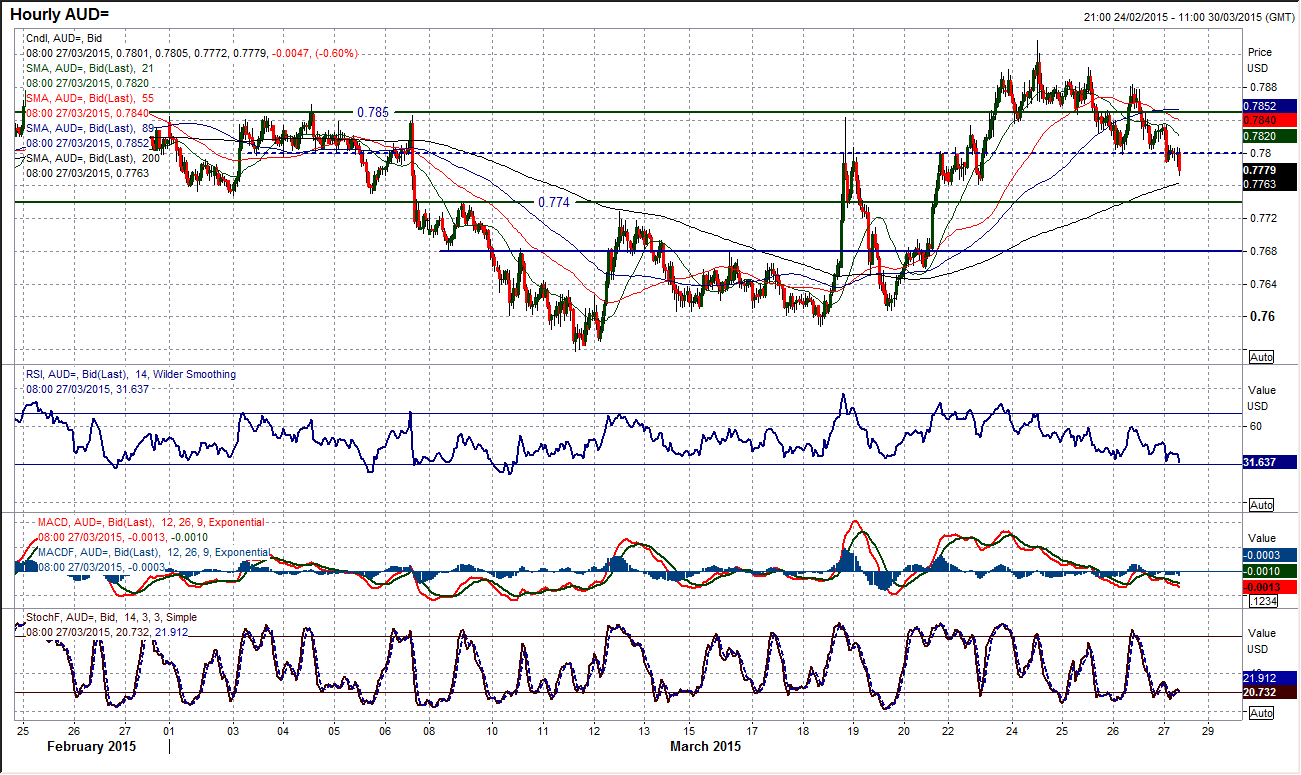
The bulls will be increasingly worried that the rally is now at an end. Whilst the candles in the past few days have not been excessively bearish there is certainly a negative drift underway which is impacting across the daily momentum indicators and is causing them to roll over once more. The hourly chart is interesting as all the old pivot levels are once more being used near term. The pivot level at $0.7850 held for just over a day before being breached to open the next level at $0.7800 which also had been holding but is again coming under increasing pressure. A failure at $0.7800 would open the key $0.7740 pivot. All this is coming under the backdrop of deteriorating hourly momentum though which is increasingly pointing towards rallies being seen as a chance to sell. The resistance now comes in at $0.7885 prior to the key high at $0.7937.
EUR/USD
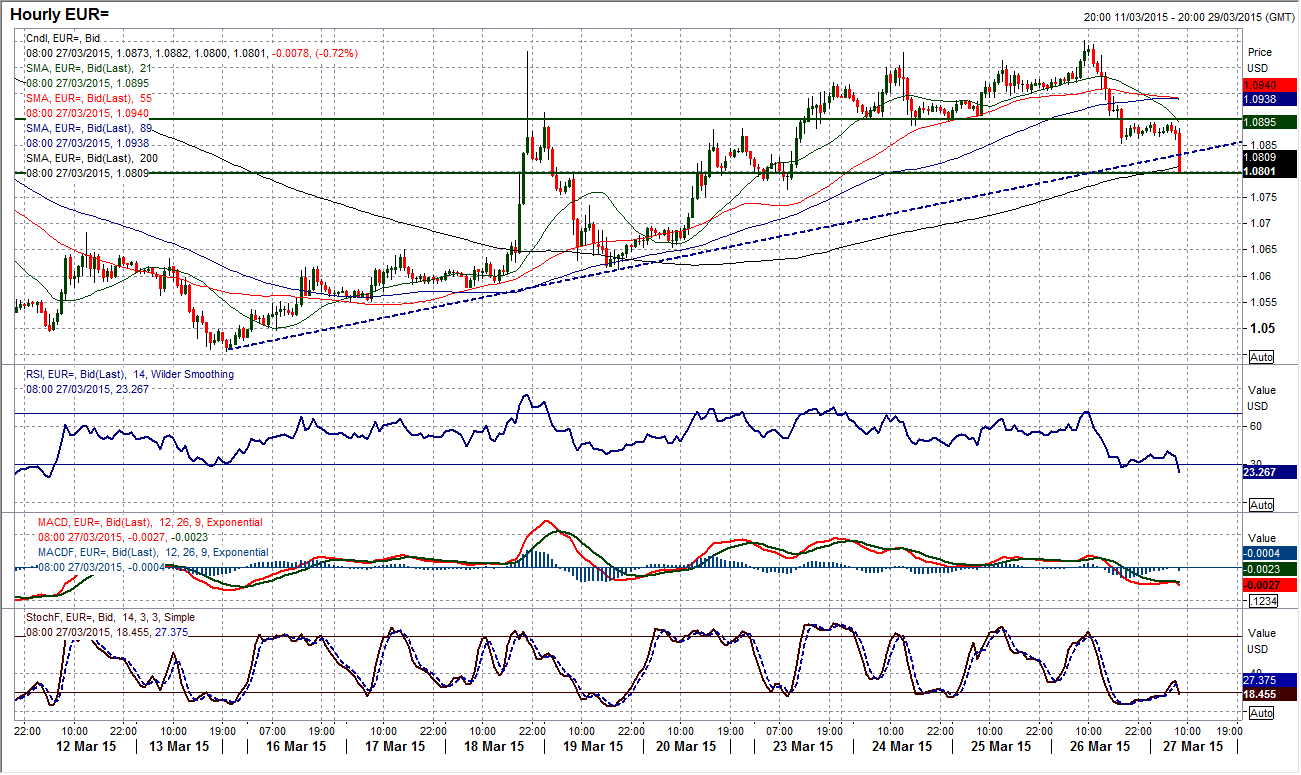
A bearish key one day reversal is a negative signal on the euro and complicates the outlook for a recovery. There was a significant swing in sentiment yesterday with the initial upside break turning round at $1.1050 and downside pressure accelerating in the afternoon to close below the previous low. The turnaround came as FOMC member (a reputed dove on the committee) stated that there an interest rate hike was possible in the June, July and September meetings, which saw the dollar subsequently strengthen across the board. This has seen the daily momentum indicators just threaten to roll over now which gives the bulls something to think about. The hourly chart shows there has been a break back below the pivotal $1.0900 level which had been building as support. The key one day reversal on the daily chart is the first real signal that questions the bull control. I am now looking at the uptrend on the hourly chart to suggest whether there is something more to it and it is under serious pressure as the European session is getting going. The uptrend currently comes in around $1.0830. A failure to get back above $1.0900 will add to the downside pressure on the euro. Below $1.0766 opens downside towards $1.0650.
GBP/USD
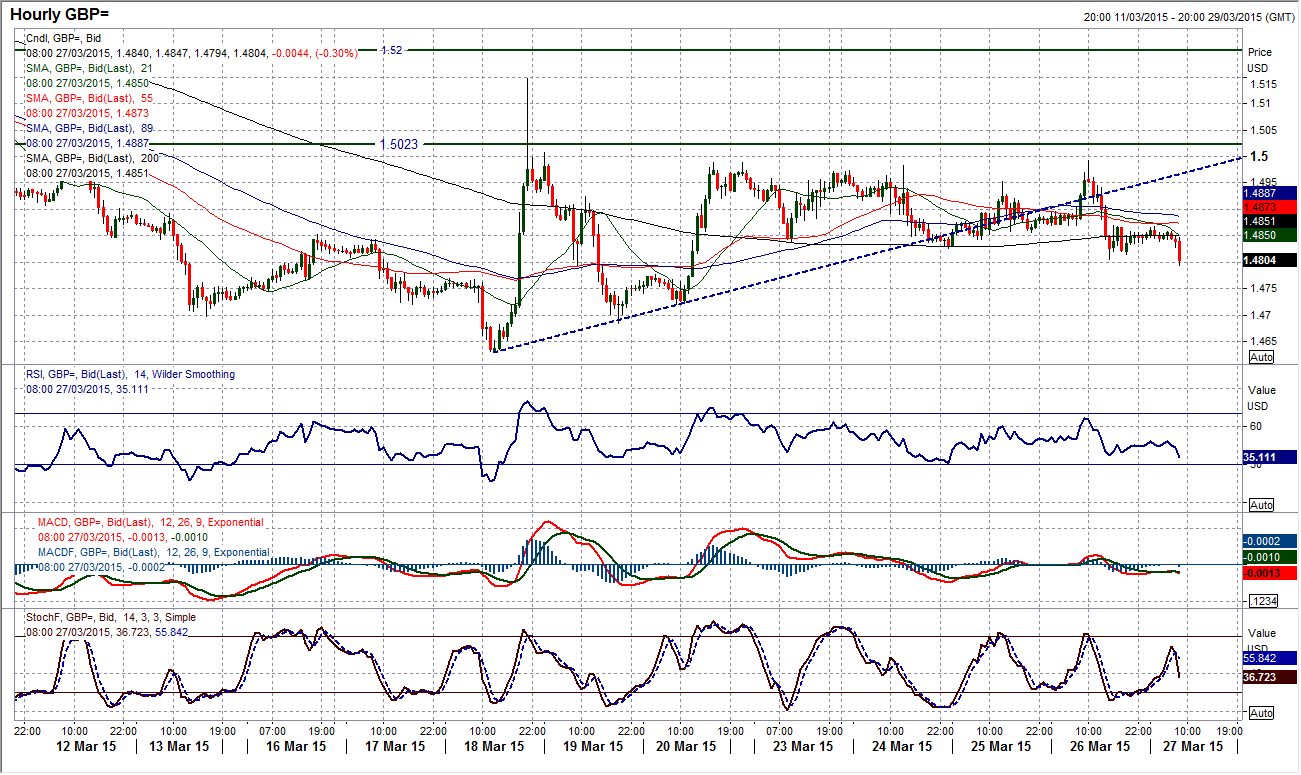
I am still concerned by the underperformance of sterling in the recent days and the fact that Cable has once more found resistance at around $1.5000 (the fifth time in six sessions) again bolsters the fact that the sterling bulls are unable to get any real foothold in a recovery. The daily momentum indicators that have unwound from oversold have shown little indication that this rebound is anything more than a chance to sell again. Interestingly also the falling 21 day moving average (today at $1.5000) which had previously acted as a very good gauge for Cable, once more has capped the upside. The hourly chart shows consistent pressure on the support around $1.4825. A slight breach yesterday could not complete the breakdown, but with the recovery uptrend broken and hourly moving averages beginning to turn lower the chance of a clean break are mounting. A decisive breach would suggest that a move towards the lows around $1.4700 would be on. I see rallies now as a chance to sell.
USD/JPY
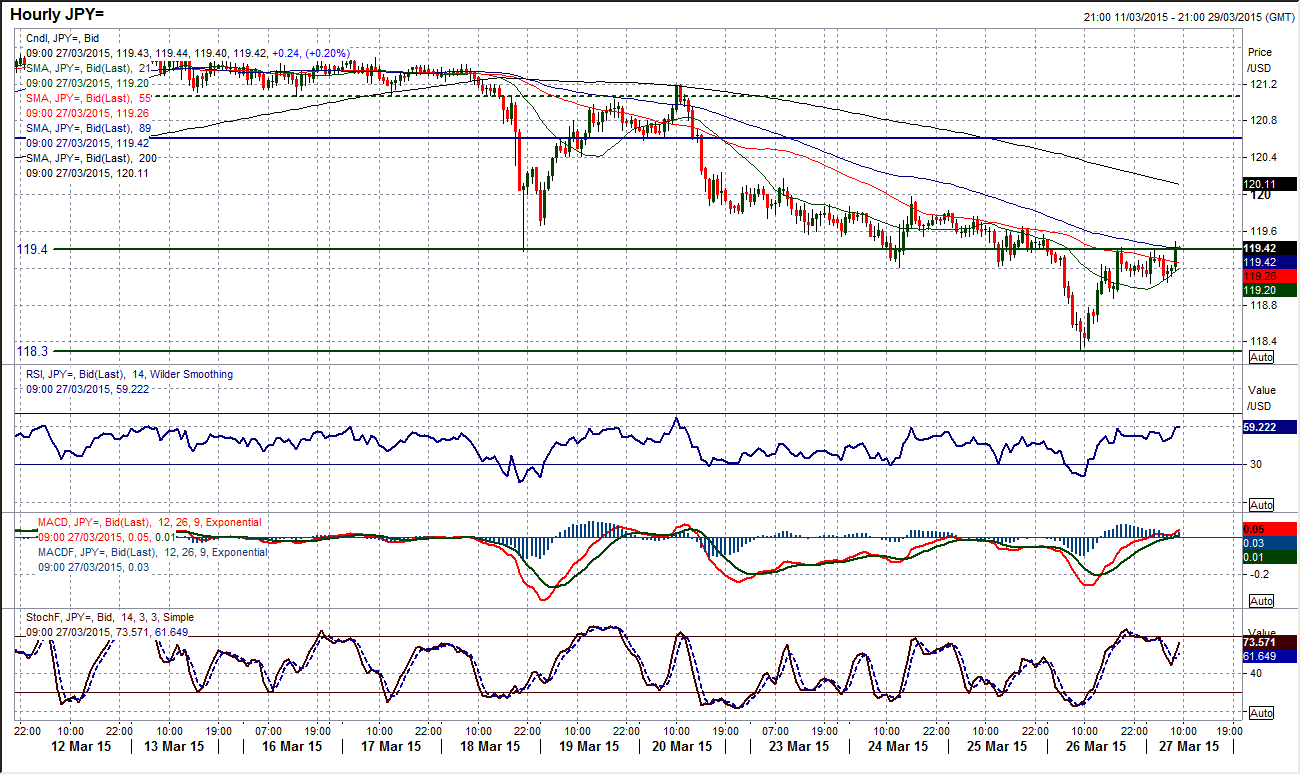
With the 2 month uptrend having been decisively broken this tells me that Dollar/Yen is still trading within this ranging phase. Momentum indicators have been unable to show any real trend following characteristics for a while and this suggests we must be looking out for where the extremes are in this range that moves between 115.80/121.84. That would suggest it is around mid-range now then. The RSI is currently around the low 40s so there is further downside potential, with weak Stochastics also backing this. The hourly chart shows a break below 119.40 pivot level bounced yesterday off the next key support at 118.30. it is interesting that the rebound is also now finding resistance at 119.40 again (old support is new resistance) to continue the sequence of lower highs and lower lows. The hourly momentum has already rolled over and is deteriorating again to suggest this is another chance to sell for a retest of 118.30 again. The outlook would begin to improve again if there were to be a breach of the reaction high at 120.00.
Gold
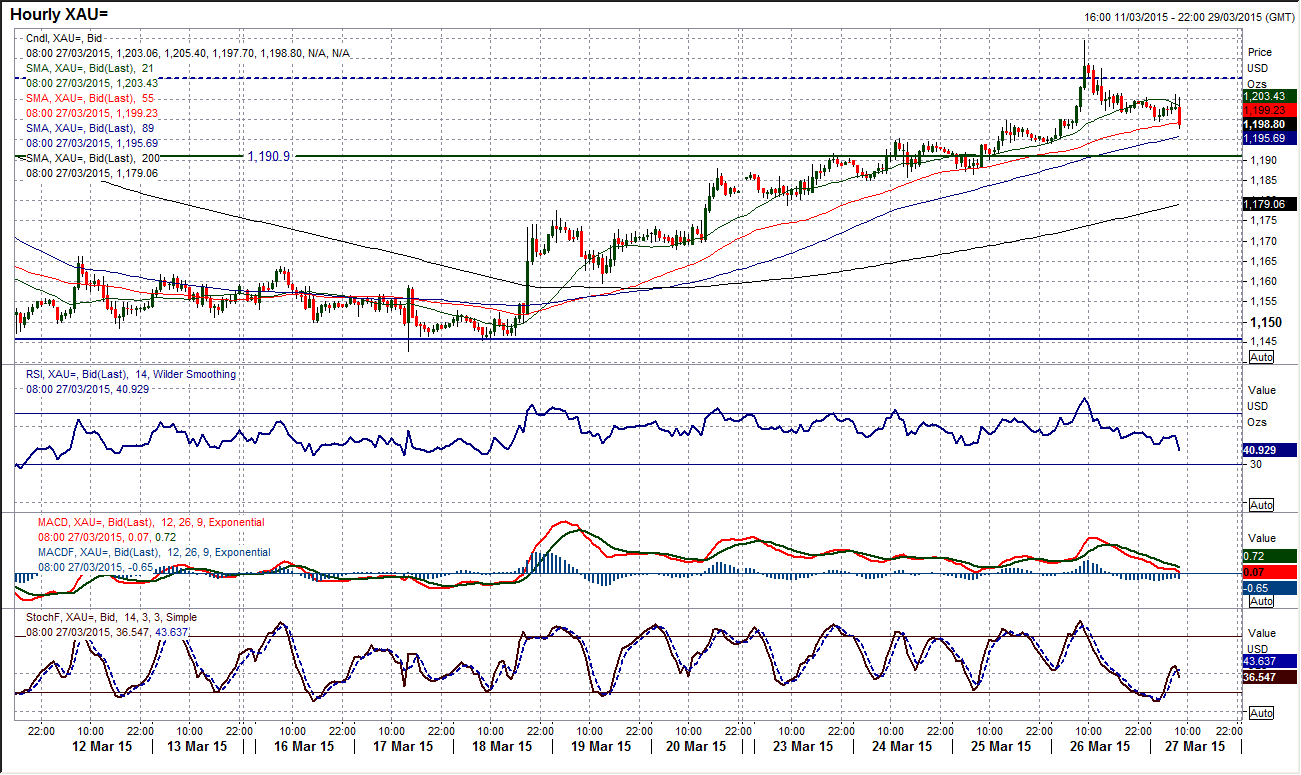
Yesterday’s positive close was the 7th straight positive candle in a row (something not seen since August 2012). However the bulls did not have it all their own way on a volatile day. An initial spike higher found resistance at $1219.40 before coming back to close at $1204 just under the mid-point of the daily range. This leaves a something of a bitter sweet taste in the mouth for the bulls and could be an early warning sign (look at the Stochastics just beginning to roll over perhaps). The hourly chart suggests that all is still fine though with support forming around the $1200 mark which had been a minor breakout level and also psychological. The hourly momentum indicators have unwound and are beginning to turn positive again which is an encouraging sign too. I am looking at the rising 55 hour moving average which has been a basis of support throughout the rebound and is currently around $1199. I would say though that the recovery bulls remain intact whilst the support band $1184.85/$1190.90 in intact. For now I am still expecting gold to retest the resistance on the daily chart at $1223.20.
WTI Oil
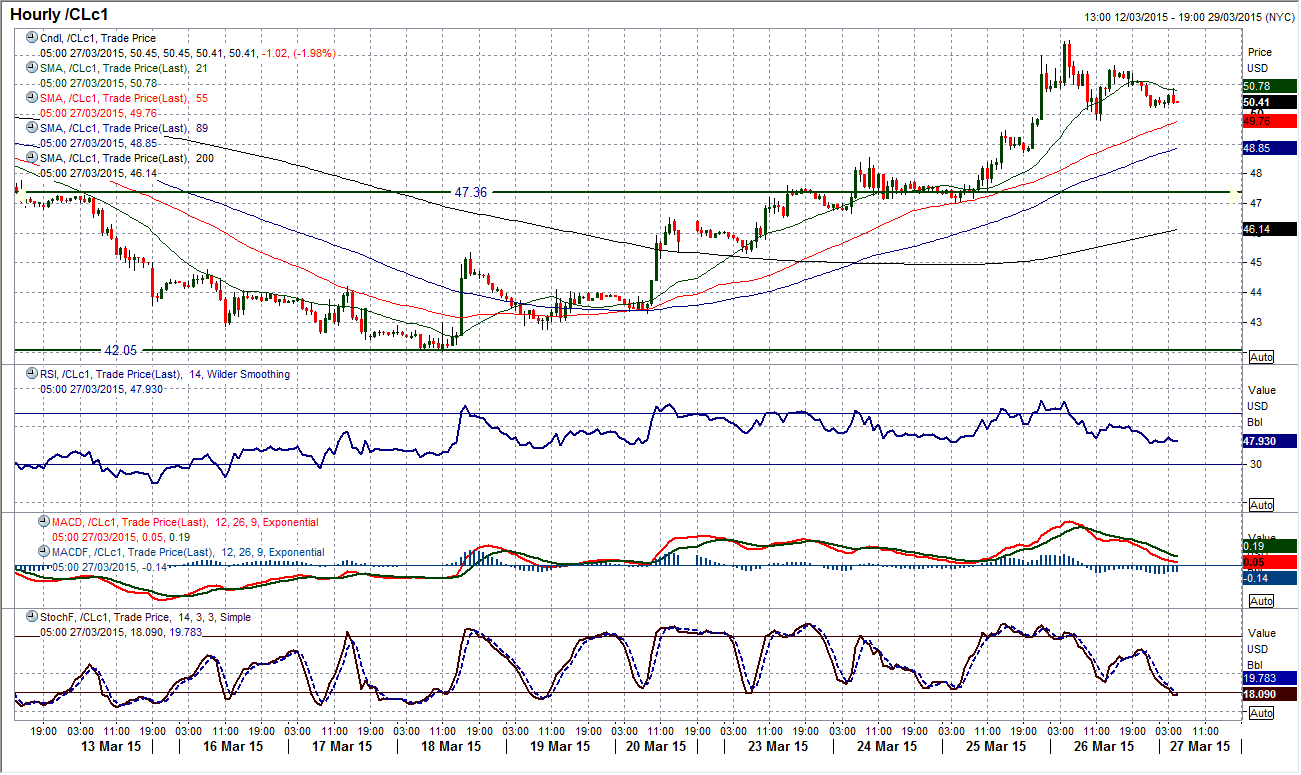
There has been significant volatility in WTI over the past couple of days as the price has continued to rally. With 5 straight days of gains the RSI is now at its highest level since June last year (around when the sell-off began), which would suggest that the medium term outlook has certainly improved. However, I still see WTI as a range play and I would be worried about staying in a long position for too long. The peak yesterday came close to the upper Bollinger Band (the bands are also flat currently which suggests also more of a range play). It was also very interesting that yesterday’s peak in the price came almost to the pip at the $52.40 reaction high from the 5th March. The trend is still positive on the hourly chart with the 55 hour moving average being used as a good basis of support, but that is currently around $49.70, so this may mean a near term drift. Yesterday’s low at $49.85 is now supportive near term.
Note: All information on this page is subject to change. The use of this website constitutes acceptance of our user agreement. Please read our privacy policy and legal disclaimer. Opinions expressed at FXstreet.com are those of the individual authors and do not necessarily represent the opinion of FXstreet.com or its management. Risk Disclosure: Trading foreign exchange on margin carries a high level of risk, and may not be suitable for all investors. The high degree of leverage can work against you as well as for you. Before deciding to invest in foreign exchange you should carefully consider your investment objectives, level of experience, and risk appetite. The possibility exists that you could sustain a loss of some or all of your initial investment and therefore you should not invest money that you cannot afford to lose. You should be aware of all the risks associated with foreign exchange trading, and seek advice from an independent financial advisor if you have any doubts.
Recommended Content
Editors’ Picks
AUD/USD posts gain, yet dive below 0.6500 amid Aussie CPI, ahead of US GDP

The Aussie Dollar finished Wednesday’s session with decent gains of 0.15% against the US Dollar, yet it retreated from weekly highs of 0.6529, which it hit after a hotter-than-expected inflation report. As the Asian session begins, the AUD/USD trades around 0.6495.
USD/JPY finds its highest bids since 1990, approaches 156.00

USD/JPY broke into its highest chart territory since June of 1990 on Wednesday, peaking near 155.40 for the first time in 34 years as the Japanese Yen continues to tumble across the broad FX market.
Gold stays firm amid higher US yields as traders await US GDP data

Gold recovers from recent losses, buoyed by market interest despite a stronger US Dollar and higher US Treasury yields. De-escalation of Middle East tensions contributed to increased market stability, denting the appetite for Gold buying.
Ethereum suffers slight pullback, Hong Kong spot ETH ETFs to begin trading on April 30

Ethereum suffered a brief decline on Wednesday afternoon despite increased accumulation from whales. This follows Ethereum restaking protocol Renzo restaked ETH crashing from its 1:1 peg with ETH and increased activities surrounding spot Ethereum ETFs.
Dow Jones Industrial Average hesitates on Wednesday as markets wait for key US data

The DJIA stumbled on Wednesday, falling from recent highs near 38,550.00 as investors ease off of Tuesday’s risk appetite. The index recovered as US data continues to vex financial markets that remain overwhelmingly focused on rate cuts from the US Fed.
