Market Overview
There was a real sense of concern that took over Wall Street last night that has driven a flight into safer haven plays. As the durable goods orders disappointed there is a fear is that the strength of the dollar will negatively impact through to corporates revenues and earnings. Additionally there was news that in the Middle East, Saudi Arabia was beginning military operations in Yemen which sent the oil price sharply higher. This has all driven demand for safe haven instruments such as the yen, and gold. Wall Street sold off significantly with the S&P 500 down by 1.5%. The strengthening yen has also had an impact on the Nikkei 225 which was also down 1.5% overnight. European markets have begun the day in negative territory too.
Forex trading shows that majors having been fairly settled during Asian trading (with the exception of the stronger yen) are now beginning to show dollar weakness is on the brink of continuing again. This is reflective of the flight into safer haven trades. However, despite a strong rebound being seen in oil, the commodity currencies have been struggling to gain traction which again could be reflective of reduced risk sentiment.
Traders have not got much to drive sentiment from any announcements today, with the Weekly Jobless Claims from the US the first real release at 1230GMT. The expectation is for 290,000 which is only a very slight improvement on last week. The Kansas Fed manufacturing data will also be watched at 1500GMT for further signs of how regional economies are performing in the US, with a figure of 5 the last time out.
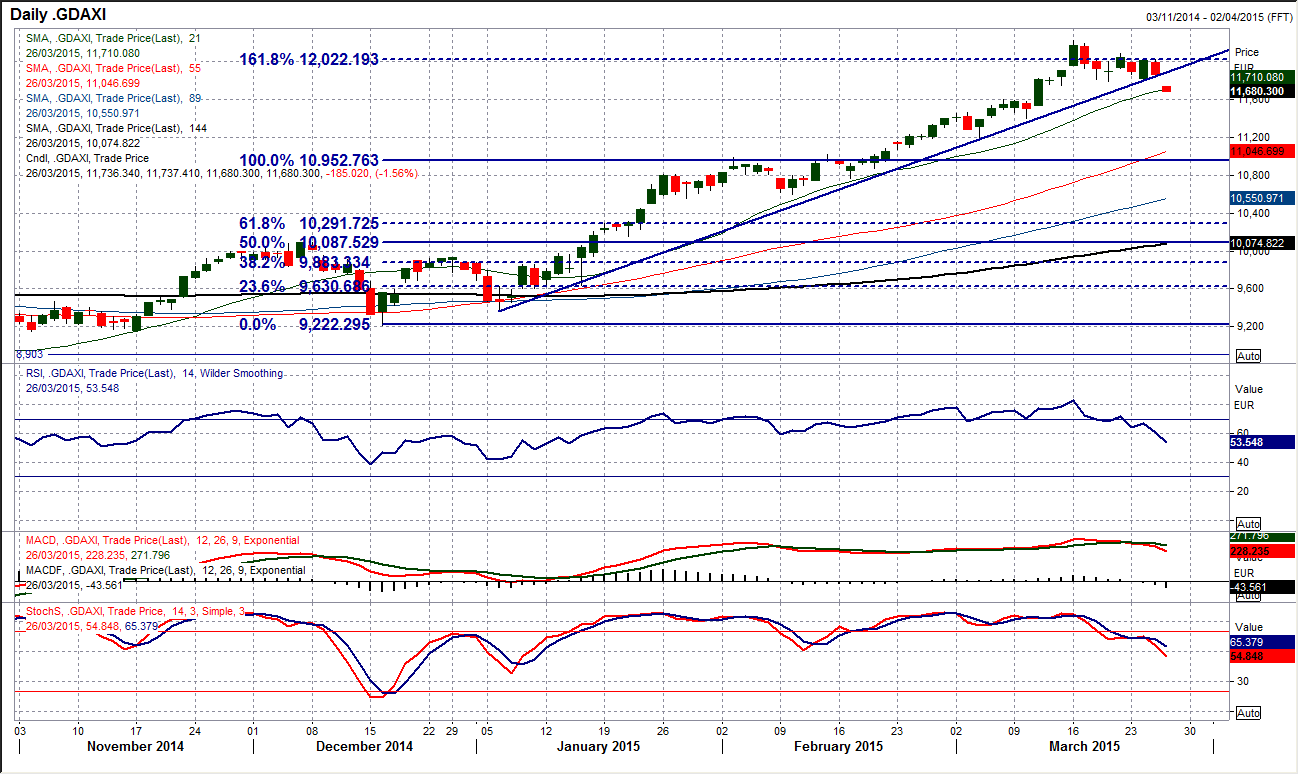
Chart of the Day – DAX Xetra
We are seeing a very interesting technical development on the DAX today. The DAX has been consolidating around the 161.8% Fibonacci projection level around 12,000 for the past 8 days, but now a correction is threatening which could see the DAX dragged lower again. The big uptrend which has been pulling the index higher for the past 3 months is today under serious pressure. The daily chart shows that momentum indicators have been falling away ever since the peak on 16th March at 12,219 and now today both the RSI and the Stochastics are threatening to close at their lowest level since early January. The intraday hourly chart also reflects this concern for the bulls and a confirmed breach of 11,787 would actually form a small top pattern than would imply a downside target around 300 points lower at 11,490 (which would also take the DAX right back into the middle of a 200 point consolidation between 11,400/11,600.
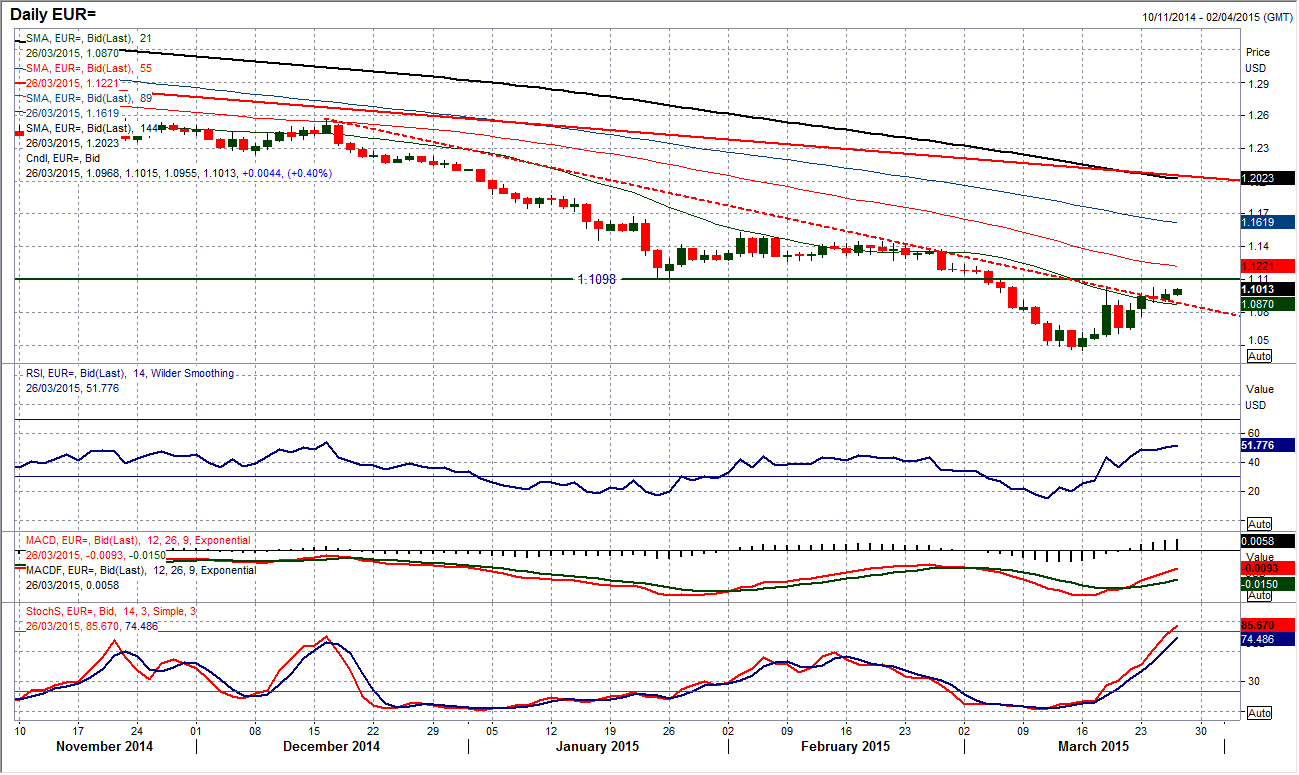
EUR/USD
There is still a bullish bias to the outlook for the recovery, although there has been an element of consolidation that has begun to set in. The daily momentum indicators continue to rise, with the Stochastics now at their highest since October and RSI the highest since December. The intraday hourly chart gives a sense of the positive near term outlook with rising moving averages bullish configuration on the momentum indicators and the continued use of the old resistance around $1.0900 as the basis of the support. However there is still a slight reluctance to push the rally forward, with a resistance consistently being found in the band $1.1000/$1.1030. I am still positive for further recovery towards the $1.1098 old key low but the bulls need a gentle nudge to get them going again. The support of the near two week uptrend comes in around $1.0800 today.
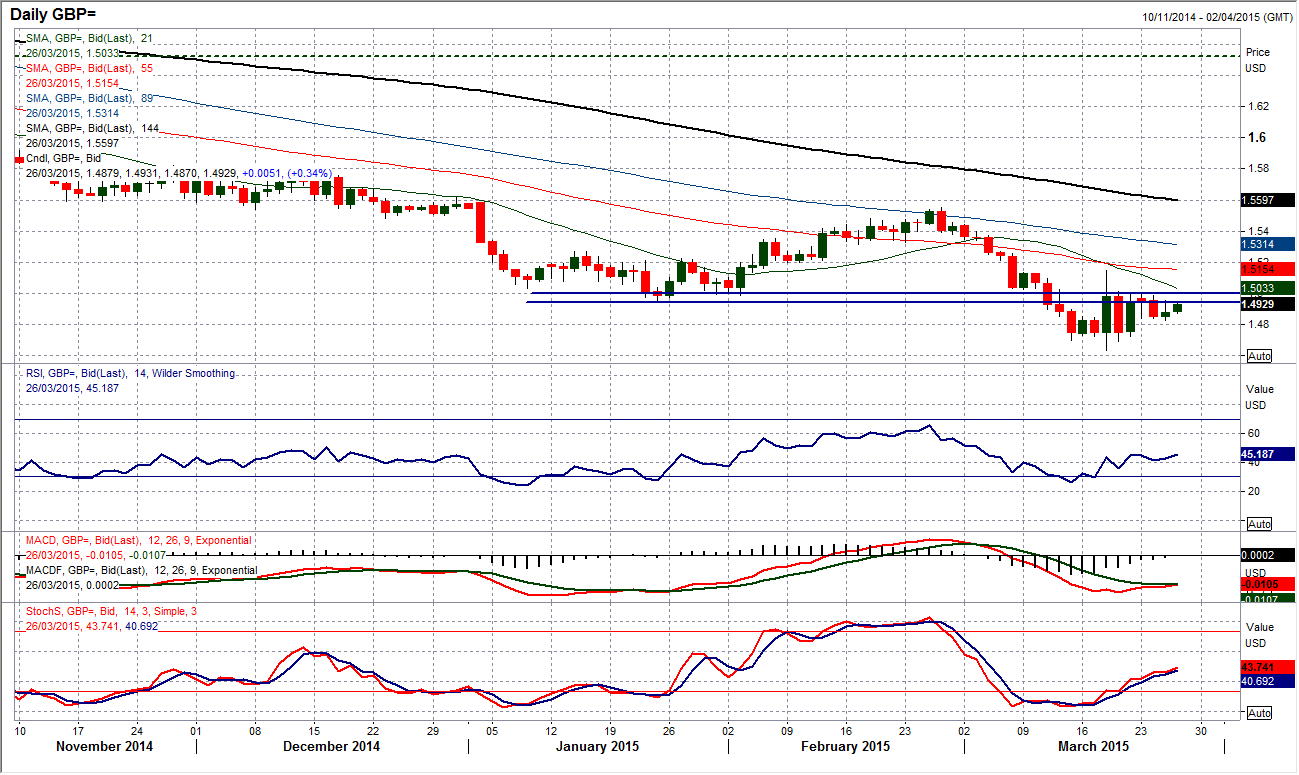
GBP/USD
Whilst I see a bullish bias to the euro, the same cannot be said for sterling which continues to be the disappointing performer of the forex majors since the FOMC. The consistent failure around $1.5000 resistance is now weighing on Cable with momentum indicators beginning to roll over and the prospects of a serious recovery taking hold diminishing. The intraday hourly chart shows the one week uptrend now having been breached and the outlook at best neutral. The support at $1.4825 held throughout yesterday’s trading but there is still a sense that this is under pressure. A breakdown of $1.4825 would imply a move back towards $1.4700. There is now minor near term resistance at $1.4953.
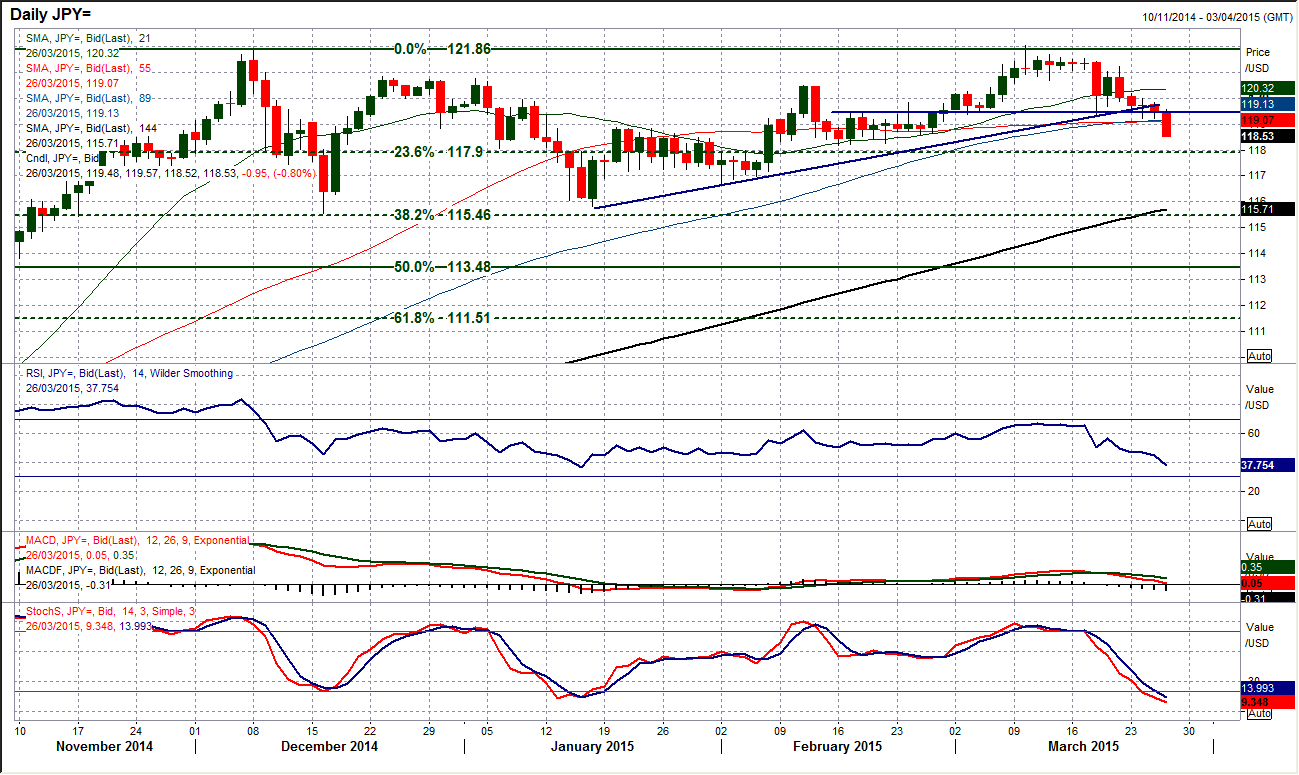
USD/JPY
After several days of consolidating and testing the support band 119.20/119.40 the bears have finally won the argument and the support has been decisively breached. This has now re-opened the next key support band 118.15/118.30. This is an important development on the daily chart as it has taken the pair below the rising 89 day moving average for the first time since August. So for the first time in months the trend is beginning to deteriorate. This continues the medium/longer term sideways trading outlook on the chart that has been in place for the past few months and Dollar/Yen could easily now be turning into a choppy range play for the next few months. On a daily chart I would be inclined to see this near term corrective phase playout with some supports along the way at 117.90 (the 23.6% Fibonacci retracement of the 105.18/121.84 rally) also a potential area of consolidation.
Gold
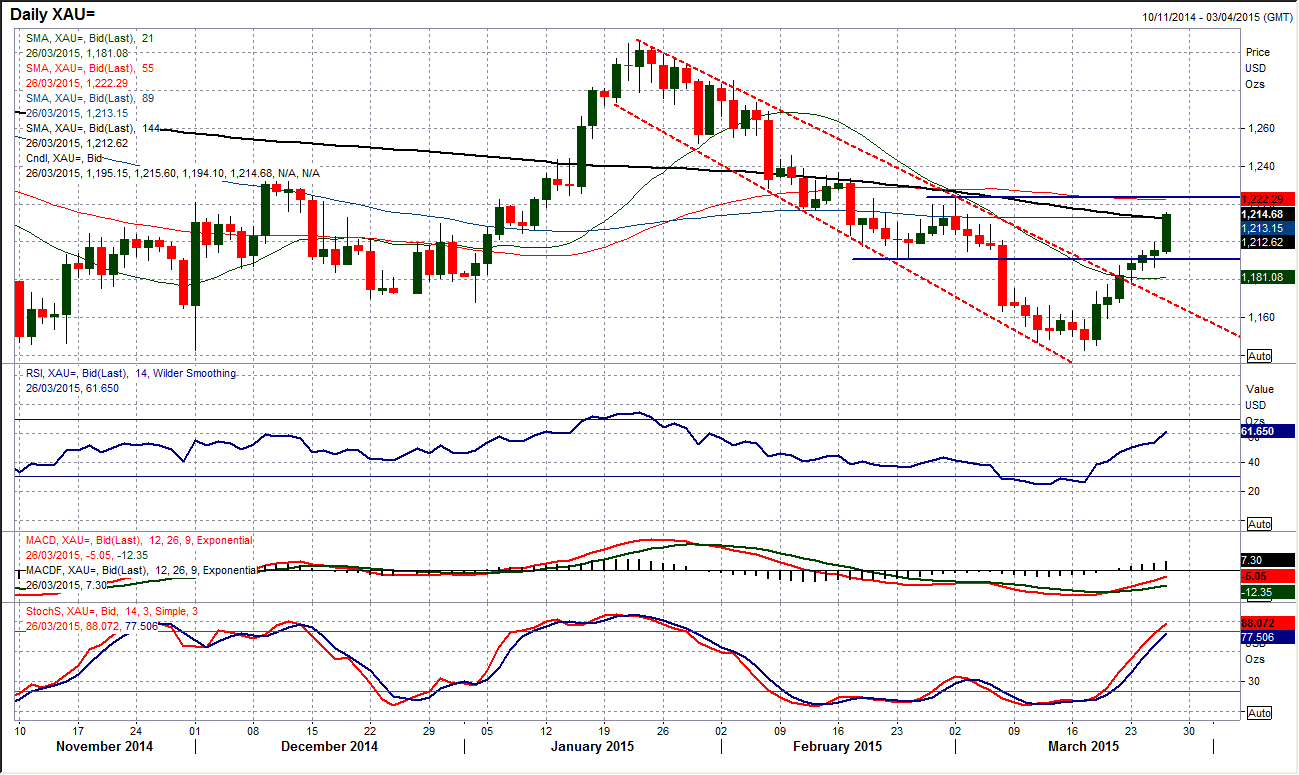
The gold price continues on its recovery, having now posted higher lows and higher highs in each of its past 7 sessions. The momentum is also continuing to improve with RSI now well above 50, whilst the MACD and Stochastics also increasingly encouraging. The intraday hourly chart just shows a very strong chart, with all indicators showing strong configuration and further gains are likely. The bulls will now be eying the $1223.20 resistance from the March high and the way the charts are configured there is little reason to no back the run. There is now support around the $1186/$1191 consolidation area.
WTI Oil
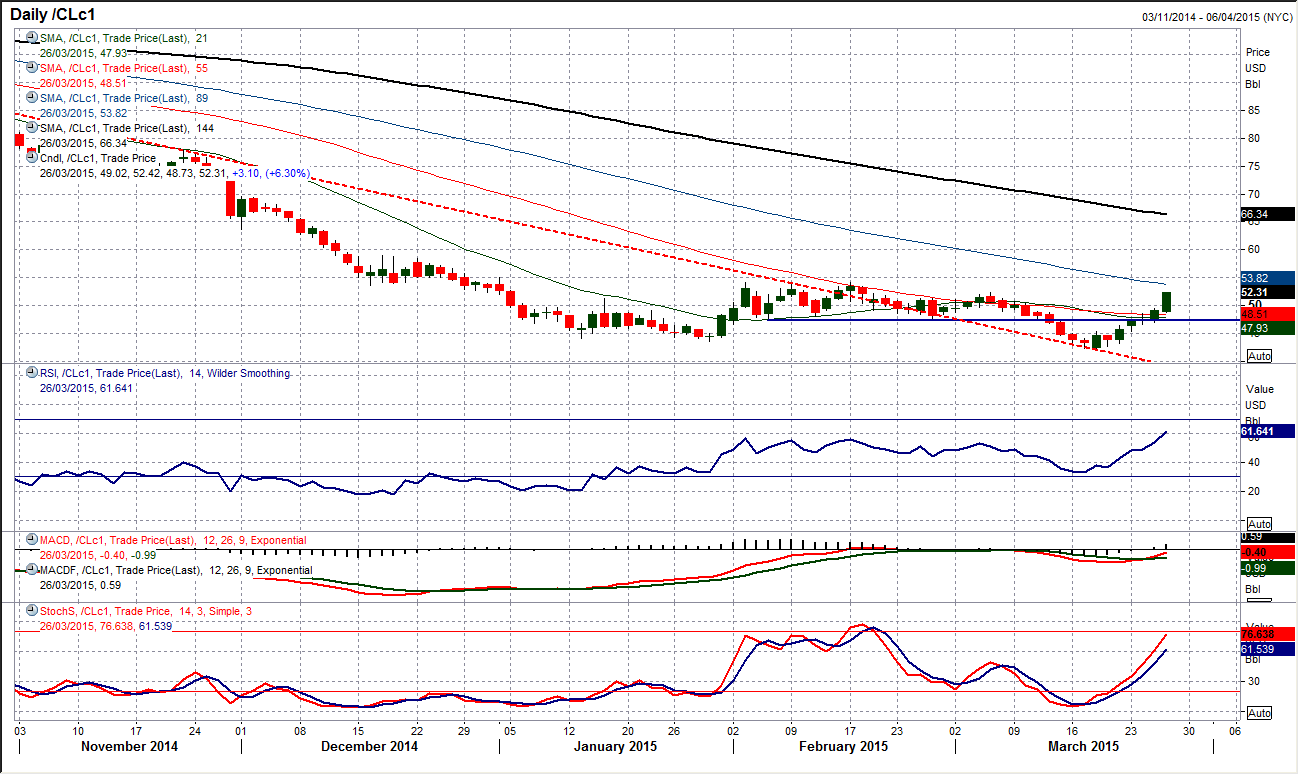
Technically, the outlook for the recovery has been positive in recent days but this has been exacerbated by fundamental news flow from the Middle East where military action by Saudi Arabia in Yemen has seen the oil price shoot back above $50 once more. This move means that the WTI price is now showing higher lows and higher highs for the past 5 days and the RSI on the daily chart is at its highest since June. The next resistance to be tested is at $52.40 and then $54.15. The intraday hourly chart shows there is a near term band of support $48.70/$49.50 whilst momentum remains strong. The big caveat in these situations is how sustainable the move is if the fundamental news flow calms down again. I would be looking towards the 55 hour moving average which as been an excellent gauge for WTI throughout March and is acting as support, currently around $48.20. The bulls therefore remain in control whilst the support band $46.67/$47.00 remains intact.
Note: All information on this page is subject to change. The use of this website constitutes acceptance of our user agreement. Please read our privacy policy and legal disclaimer. Opinions expressed at FXstreet.com are those of the individual authors and do not necessarily represent the opinion of FXstreet.com or its management. Risk Disclosure: Trading foreign exchange on margin carries a high level of risk, and may not be suitable for all investors. The high degree of leverage can work against you as well as for you. Before deciding to invest in foreign exchange you should carefully consider your investment objectives, level of experience, and risk appetite. The possibility exists that you could sustain a loss of some or all of your initial investment and therefore you should not invest money that you cannot afford to lose. You should be aware of all the risks associated with foreign exchange trading, and seek advice from an independent financial advisor if you have any doubts.
Recommended Content
Editors’ Picks
EUR/USD fluctuates near 1.0700 after US data

EUR/USD stays in a consolidation phase at around 1.0700 in the American session on Wednesday. The data from the US showed a strong increase in Durable Goods Orders, supporting the USD and making it difficult for the pair to gain traction.
USD/JPY refreshes 34-year high, attacks 155.00 as intervention risks loom

USD/JPY is renewing a multi-decade high, closing in on 155.00. Traders turn cautious on heightened risks of Japan's FX intervention. Broad US Dollar rebound aids the upside in the major. US Durable Goods data are next on tap.
Gold keeps consolidating ahead of US first-tier figures

Gold finds it difficult to stage a rebound midweek following Monday's sharp decline but manages to hold above $2,300. The benchmark 10-year US Treasury bond yield stays in the green above 4.6% after US data, not allowing the pair to turn north.
Worldcoin looks set for comeback despite Nvidia’s 22% crash Premium

Worldcoin price is in a better position than last week's and shows signs of a potential comeback. This development occurs amid the sharp decline in the valuation of the popular GPU manufacturer Nvidia.
Three fundamentals for the week: US GDP, BoJ and the Fed's favorite inflation gauge stand out Premium

While it is hard to predict when geopolitical news erupts, the level of tension is lower – allowing for key data to have its say. This week's US figures are set to shape the Federal Reserve's decision next week – and the Bank of Japan may struggle to halt the Yen's deterioration.
