Market Overview
As we edge ever closer to the crucial data of the week (Non-farm Payrolls), markets are a little on edge. Yesterday’s declines certainly showed that despite the lack of negative macro news flow, the bulls will not have things all their own way. The sharp end of day reversal lower in Europe is a warning sign, whilst Wall Street also closed lower. The S&P 500 was off 0.5% into the close, whilst Asian markets have been lower overnight. European markets are trading marginally higher today in early trading as some of yesterday’s weakness is unwound.
The key data point early this morning has been the Australian GDP data which came in a touch light for the quarter on quarter number to +0.5%. Aussie stocks took some selling pressure but the Aussie dollar is broadly flat today. The China HSBC services PMI showed a slight improvement on last month with a move to 52.0 (from 51.8). There was also an unexpected rate cut by the Bank of India which adds to the list of central banks that have been easing monetary policy in recent weeks.
Forex majors are fairly quiet today with very little direction shown yet, whilst gold and silver have achieved very slight gains. Traders have got a raft of economic data to look forward to today. The Eurozone services PMIs are released throughout the early morning, with the UK data at 0930GMT which is expected to improve very slightly to 57.6 (from 57.2). The ISM Non-manufacturing data is at 1500GMT and is expected to dip slightly to 56.5. Before that though the markets get a look at the ADP employment report which is forecast to improve slightly to 219,000 from last month’s slightly disappointing 213,000. I saw slightly disappointing as the Non-farm Payrolls remained strong last month as the ADP dipped and this could mean that the number is treated with a little caution today.
Chart of the Day – NZD/USD
The rally of the past 4 weeks is now into a key test. The key resistance around 0.7600 is the overhead barrier that must now be overcome to continue the push higher. However this is a formidable resistance which has already been tested in the past week. The first test though ended up leaving resistance at 0.7613, whilst a subsequent attempt formed a bearish key one day reversal from 0.7600 as the bulls lost control. The 4 week uptrend is rapidly now closing in on the resistance one more and something will have to give. The daily momentum indicators are interesting because the Stochastics have now been falling (bearish diverging) for almost two weeks, whilst the MACD lines are now back to neutral. Furthermore, the RSI is once more back to the mid-50s which is where the bears tend to regain control. So this is now a key crossroads in the medium term outlook. A break above 0.7600 would instantly open 0.7890, whilst key support is at 0.7420.
EUR/USD
Having appeared to garner some sort of direction on Thursday last week the euro has once more become rather lifeless with a third drab trading day devoid of any real direction. There are a couple of key events on Thursday (ECB press conference) and Friday (Non-farm Payrolls) which appear to be what the market is now looking towards. This may mean therefore, more of the same today unfortunately. The only real prospect of any move would come with a big surprise on the ISM Non-manufacturing data today. Technically the daily chart looked primed for further downside with momentum indicators all showing a negative set-up and a retest of $1.1098 is likely. The hourly chart shows a series of lower highs in place since the $1.1260 key support (now key overhead resistance) was breached. The lower highs come around $1.1245 and then at yesterday’s peak at $1.1217. There is no immediate sense of impending bearishness on the hourly chart, just the slow drift of negativity. The euro needs a catalyst once more, perhaps Mario will give it tomorrow, but more likely we will be waiting for the payrolls.
GBP/USD
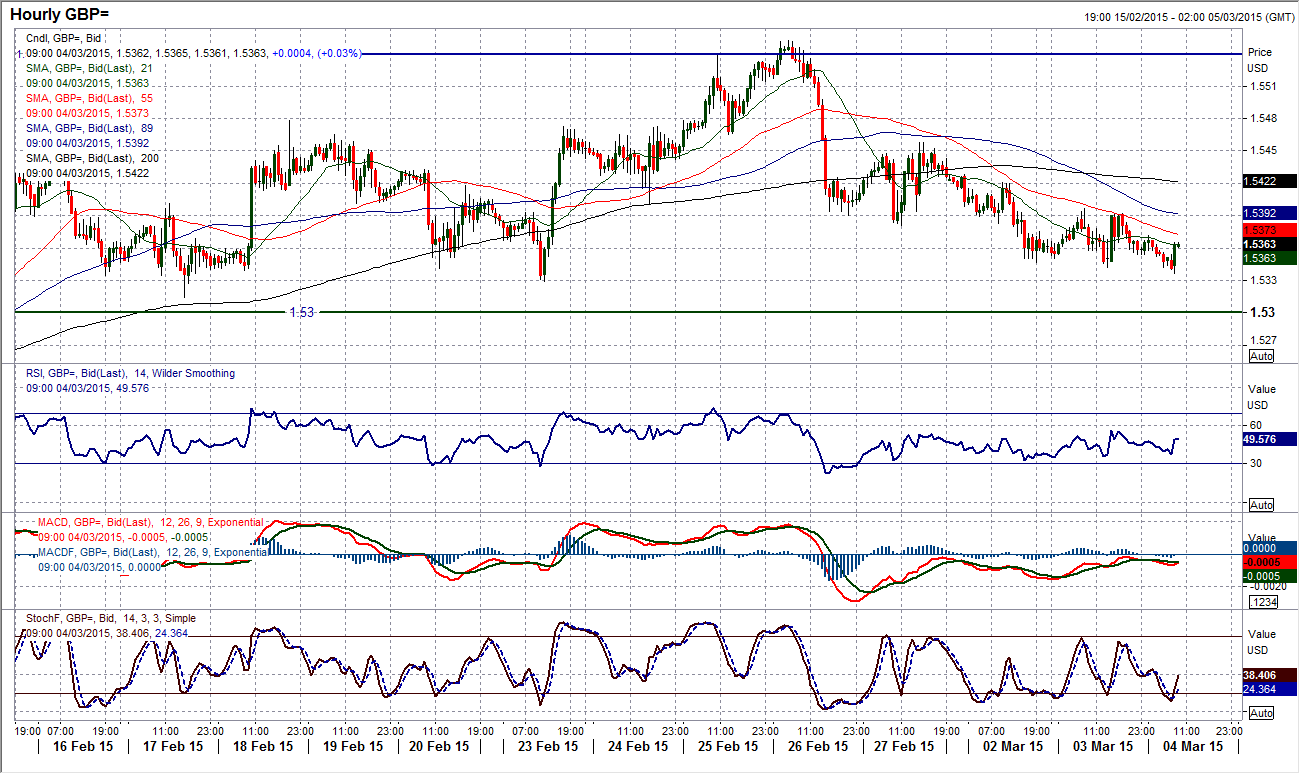
The more that this chart progresses the more I see a test of the $1.5300 level that is a threshold of bullish control. For several days now the bulls have been losing their grip on the outlook with indicator after indicator turning negative and implying correction, however with price action so important, until we see $1.5300 breached I cannot confirm the loss of control. The price is now trading below the 21 day moving average for the first time in four weeks. Stochastics are in consistent decline whilst there has now been a MACD crossover. RSI is at 50 and if it goes below the neutral level this is just another signal to add to the list. The intraday hourly chart shows a series of lower highs over the past few days. Interestingly also, the level around $1.5400 had previously been supportive but yesterday has become a resistance level. The hourly momentum is weak and suggests that intraday rallies are now being sold into. Anything around $1.5400 looks to be a chance to sell now for pressure towards $1.5300. The key near term resistance is at $1.5458.
USD/JPY
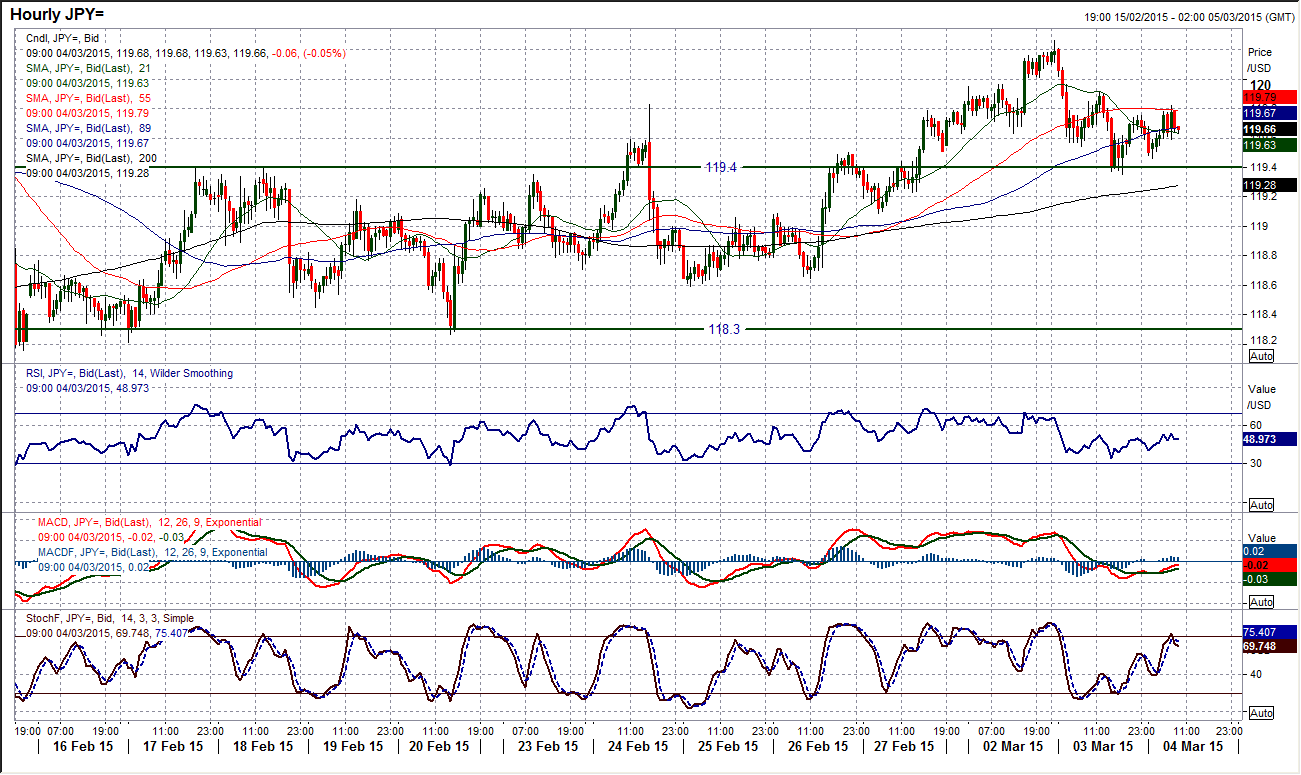
A slight dip back on Dollar/Yen has just taken some of the wind out of the sails of the rally, but for now the move does not seem to have done too much damage. A marginally bearish candlestick is not helpful for the bulls, but the momentum indicators show no real deterioration, whilst the price remains above the rising moving averages. The intraday hourly chart shows us some further insight into the correction yesterday and it is interesting that the support around 119.40 (which had previously been pivotal) held up the decline yesterday. This now becomes the key level to watch for, whilst 119.10 would be a level below which the bulls would have lost control. For now we are seeing an element of consolidation and the bulls are not as strong as they have been previously. However, the hourly momentum indicators are gradually improving once more and if there is a push above 119.90 (a key reaction high in yesterday’s sell-off then we could see a return to test 120.25 and 120.50.
Gold
After a rather turbulent day the bears could come away and say that they probably won the day, but only just. A sharp intraday rally looked to be completely reversing the shooting star at one stage but the selling pressure resumed at $1214.60 and the move lower resumed. However taking a step back and it looks as though the price action is currently rather choppy and this could be indicative of the next day or so before we see the Non-farm Payrolls data which is likely to give some direction. The $1223 resistance remains the key barrier it would seem, but also on the intraday hourly chart it becomes apparent that gold is currently ranging above $1190.90. In ranging markets it becomes possible to use the RSI (in this one use the hourly RSI) as an indicator to buy at oversold and sell at overbought. The medium term trend remains negative and today comes in at $1228.50 but in the meantime the gold price is in ranging phase.
WTI Oil
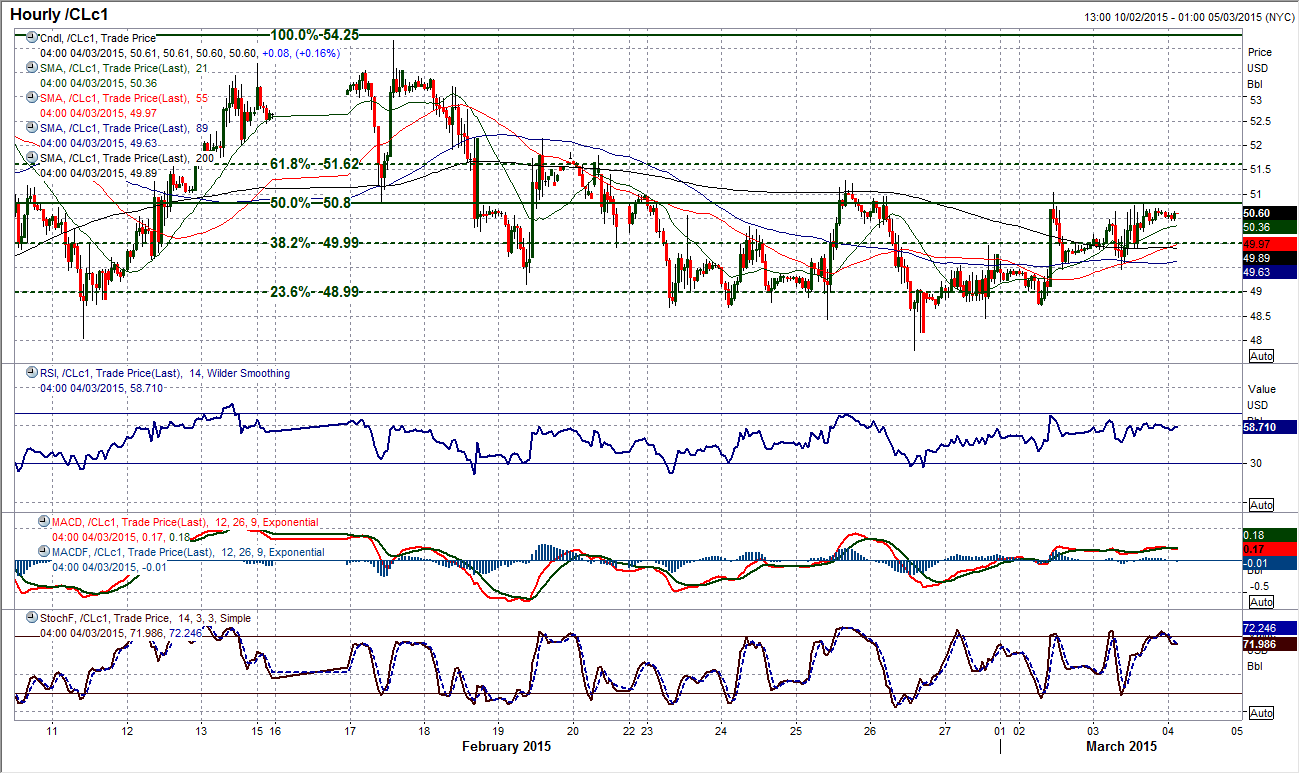
For the risk of being made to look silly, could it be that volatility in oil is beginning to calm down? The past few days have been relatively calm as the price has bounced from above the $47.36 low to maintain the range play. The 21 day moving average may now longer be acting as the basis of support but the daily momentum indicators have become increasingly neutral as the four week range has continued. The intraday hourly chart shows that there is a nearer term range that is forming with the lows coming around $48.70 up towards the reaction highs around $51.00. It is still very difficult to call WTI on an intraday basis as the range continues but there is a potential to use the hourly RSI as a trading range indicator, buying in the low 30s and selling in the high 60s. There will not be a resumption of the trend until the key support $47.36 or resistance at 54.24 are breached.
Note: All information on this page is subject to change. The use of this website constitutes acceptance of our user agreement. Please read our privacy policy and legal disclaimer. Opinions expressed at FXstreet.com are those of the individual authors and do not necessarily represent the opinion of FXstreet.com or its management. Risk Disclosure: Trading foreign exchange on margin carries a high level of risk, and may not be suitable for all investors. The high degree of leverage can work against you as well as for you. Before deciding to invest in foreign exchange you should carefully consider your investment objectives, level of experience, and risk appetite. The possibility exists that you could sustain a loss of some or all of your initial investment and therefore you should not invest money that you cannot afford to lose. You should be aware of all the risks associated with foreign exchange trading, and seek advice from an independent financial advisor if you have any doubts.
Recommended Content
Editors’ Picks
EUR/USD fluctuates near 1.0700 after US data

EUR/USD stays in a consolidation phase at around 1.0700 in the American session on Wednesday. The data from the US showed a strong increase in Durable Goods Orders, supporting the USD and making it difficult for the pair to gain traction.
USD/JPY refreshes 34-year high, attacks 155.00 as intervention risks loom

USD/JPY is renewing a multi-decade high, closing in on 155.00. Traders turn cautious on heightened risks of Japan's FX intervention. Broad US Dollar rebound aids the upside in the major. US Durable Goods data are next on tap.
Gold stays in consolidation above $2,300

Gold finds it difficult to stage a rebound midweek following Monday's sharp decline but manages to hold above $2,300. The benchmark 10-year US Treasury bond yield stays in the green above 4.6% after US data, not allowing the pair to turn north.
Worldcoin looks set for comeback despite Nvidia’s 22% crash Premium

Worldcoin price is in a better position than last week's and shows signs of a potential comeback. This development occurs amid the sharp decline in the valuation of the popular GPU manufacturer Nvidia.
Three fundamentals for the week: US GDP, BoJ and the Fed's favorite inflation gauge stand out Premium

While it is hard to predict when geopolitical news erupts, the level of tension is lower – allowing for key data to have its say. This week's US figures are set to shape the Federal Reserve's decision next week – and the Bank of Japan may struggle to halt the Yen's deterioration.


