Market Overview
The dollar bulls are once again looking to have re-established their control on proceedings. US inflation may have dropped by 0.1% but with core prices still positive, along with strong durable goods orders the dollar has rallied. This has meant after a weeks of consolidation in the forex markets we may now be ready to finally see some direction coming through once more. Equity markets remain positive, albeit in the case of the S&P 500 and the FTSE 100 it is a slow grind. It is only the DAX that has been able to make significant upside as the falling price of oil has weighed down the other indices.
Wall Street closed slightly weaker yesterday with the S&P 500 down 0.2%, whilst Asian markets are once again a little mixed although the Nikkei 225 continues to trade around multi-year highs, although today’s move was all but flat. European markets have opened the day with a slightly corrective outlook as once again the FTSE 100 strives to painstakingly looks to close at an all-time high.
After yesterday’s strong moves for the dollar there is a small degree of unwinding today, with Euro, Sterling and the Yen all slightly positive. In fact, with the oil price showing signs of support overnight, the commodity currencies (Loonie, Kiwi and Aussie) also higher. Traders will be looking out for the German inflation data which is released throughout the morning today. The data culminates at 1300GMT with the countrywide reading, which is expected to stay at -0.5% on the HICP. Today we also have the second reading of US GDP today (Preliminary), which is expected to show a slight dip back to 2.1%.
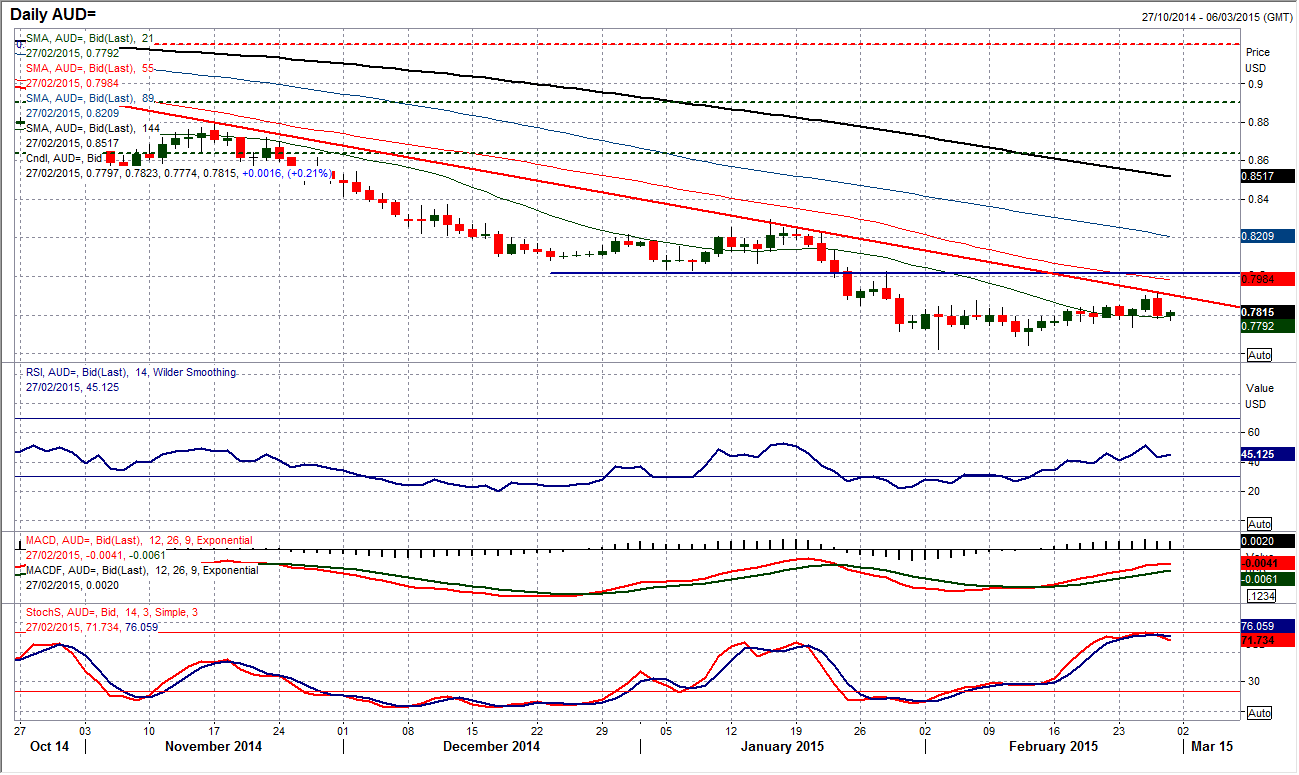
Chart of the Day – AUD/USD
There have been a number of mixed signals of late on the Aussie dollar which need to be cleared up. The upside breakout above 0.7850 resistance was quickly snapped back with the posting of a bearish key one day reversal yesterday. This has put a completely different complexion on what had looked to be an improving chart. Furthermore, this turnaround came in at 0.7780 which once more came at the resistance of the 6 month downtrend. The momentum indicators are subsequently under pressure with the Stochastics beginning to roll over and the RSI and MACD also having their wings clipped. The intraday hourly chart shows a lack of real conviction and one more the range 0.7835/50 could become a pivot level. So, once more we are now waiting to see developments as the improving outlook looks to have been little more than a bear market rally again. We must therefore be looking towards the rallies as a chance to sell.
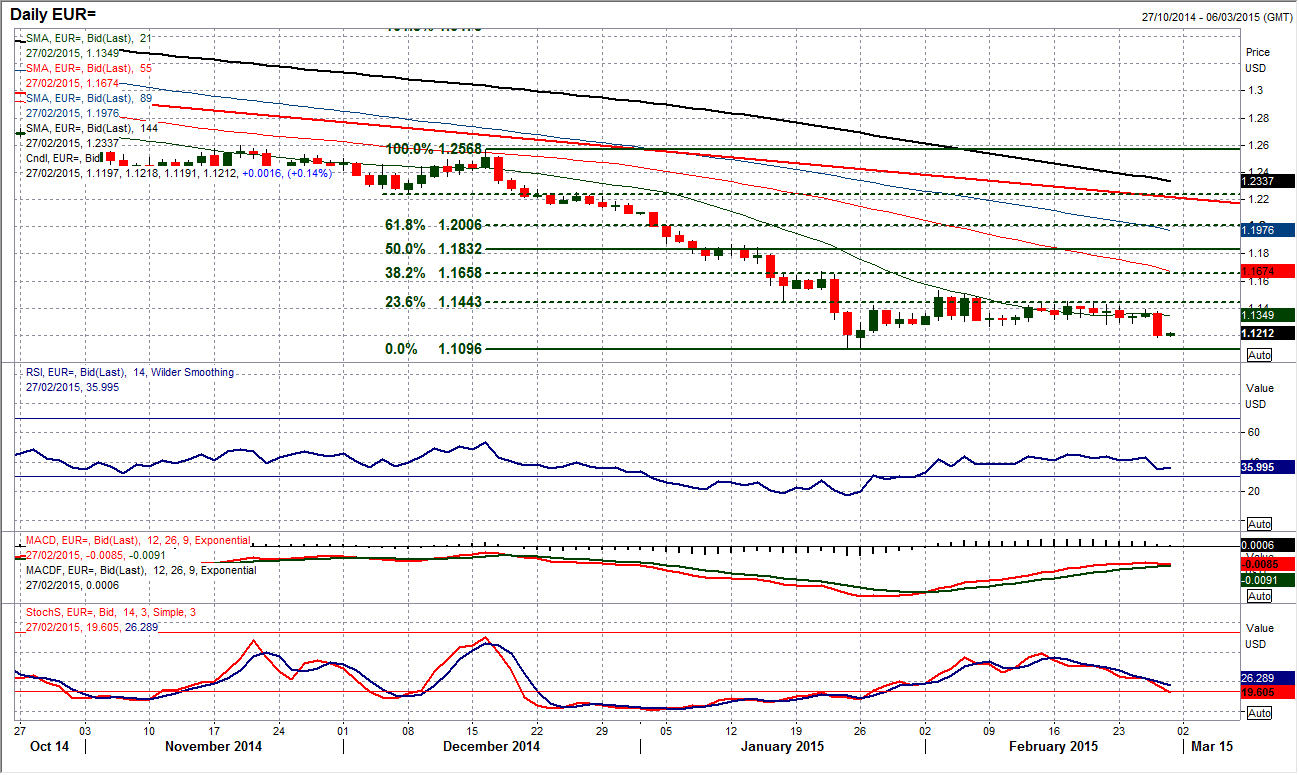
EUR/USD
We saw yesterday for the first time in weeks the concept of some sort of direction in the euro. The technicals have been gradually deteriorating in the past week and the bears seem to be regaining control once more. The momentum indicators are all turning negative again and the pressure is growing to the downside. The break below $1.1260 was also met with a close below and now the next support does not come in until the low at $1.1098. The intraday hourly chart shows A consistently strong decline during yesterday and whilst there might be a small unwinding of some very near term oversold momentum the outlook is certainly now negative. Look to use any rebound as a chance to sell, with the old support around $1.1260 now becoming the new basis of resistance.
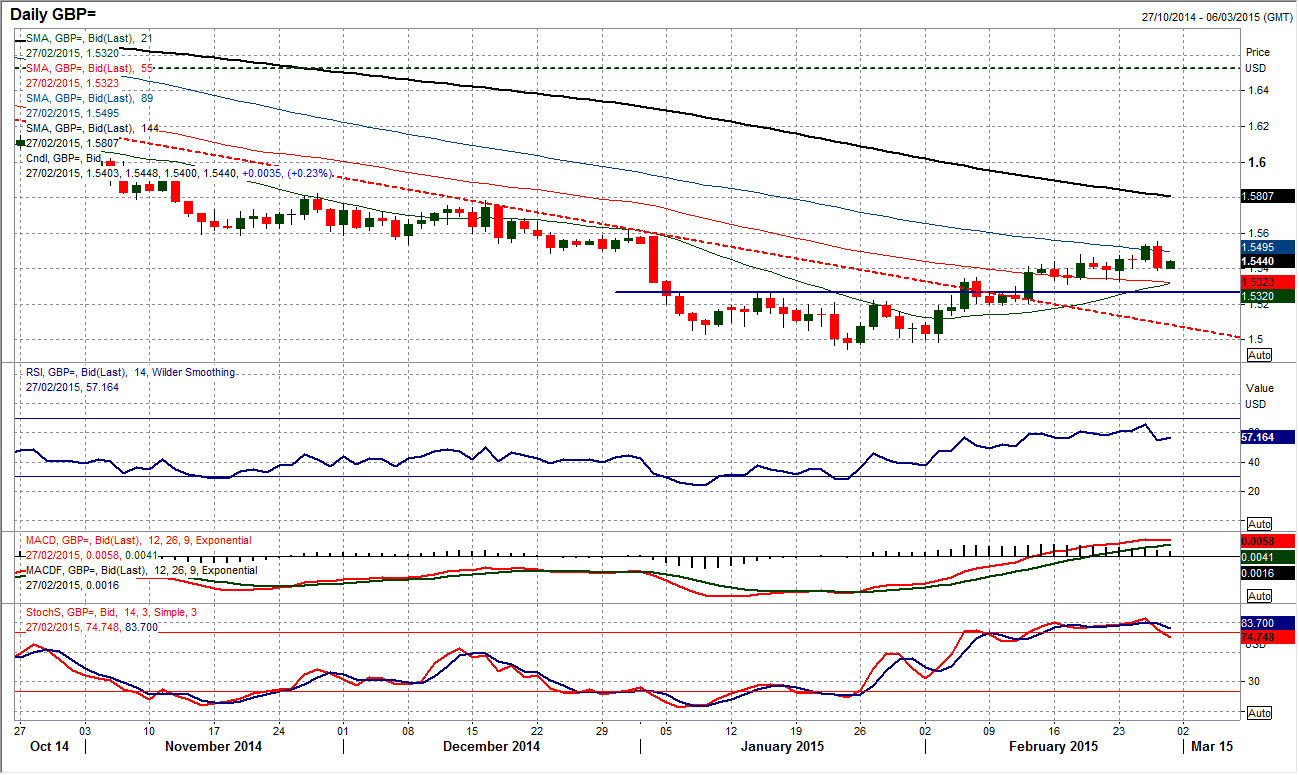
GBP/USD
The first really corrective signal we have seen on Cable as a bearish key one day reversal has been formed from yesterday’s peak at $1.5552 to close below the previous low. Whilst this signal is not terminal signal for the bullish trend, it certainly now poses questions for its sustainability. We must now look for other signals that confirms a potential strengthening of the bearish position. The initial reaction has been positive by the bulls with a small rebound off $1.5390. The momentum indicators are not as positive as they have been but nothing too corrective yet. I continue to see the support at $1.5300 as important and the intraday hourly chart shows that the reaction low at $1.5330 adds further support. A positive close tonight would be a positive response by the bulls but this chart could now be in transition so we need to play this with a little more caution now. A move back above $1.5552 would re-engage the bull control.
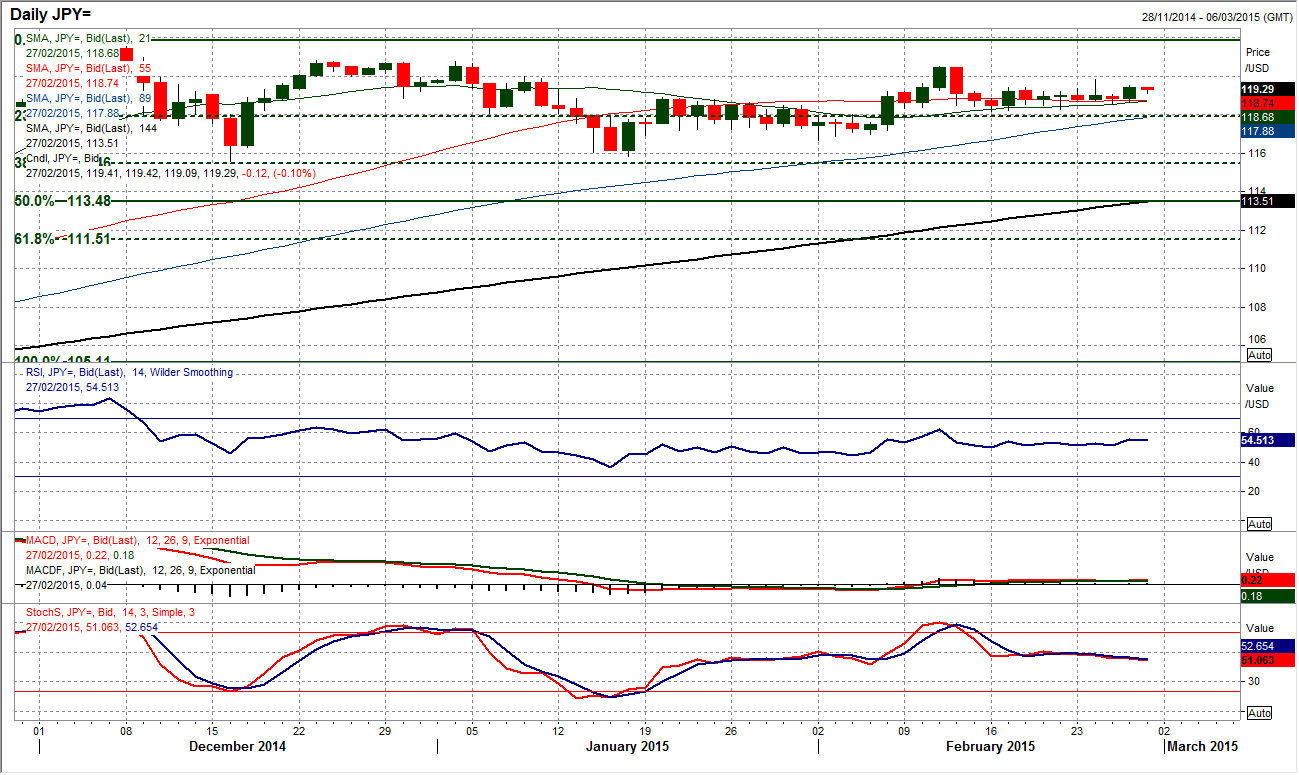
USD/JPY
It has been a choppy few days on Dollar/Yen but there are signs that the dollar bulls are gaining a foothold once more. The failed breakout of Tuesday seems to not done too much damage as a solid positive candle once more has the pair pulling higher above all the moving averages. There is however an anomalous signal with the Stochastics falling away despite the rally on the price, this is something we will have to keep an eye on. The intraday hourly chart shows that there is still much that needs to be done though. There does appear to be some support around 119.10 that has formed over the past couple of days and if the pair can use this as a platform to put further pressure on the 119.50 high then the bulls will be able to continue their improvement. The prospect of a bull recovery remains in play whilst the support at 118.60 is intact.
Gold
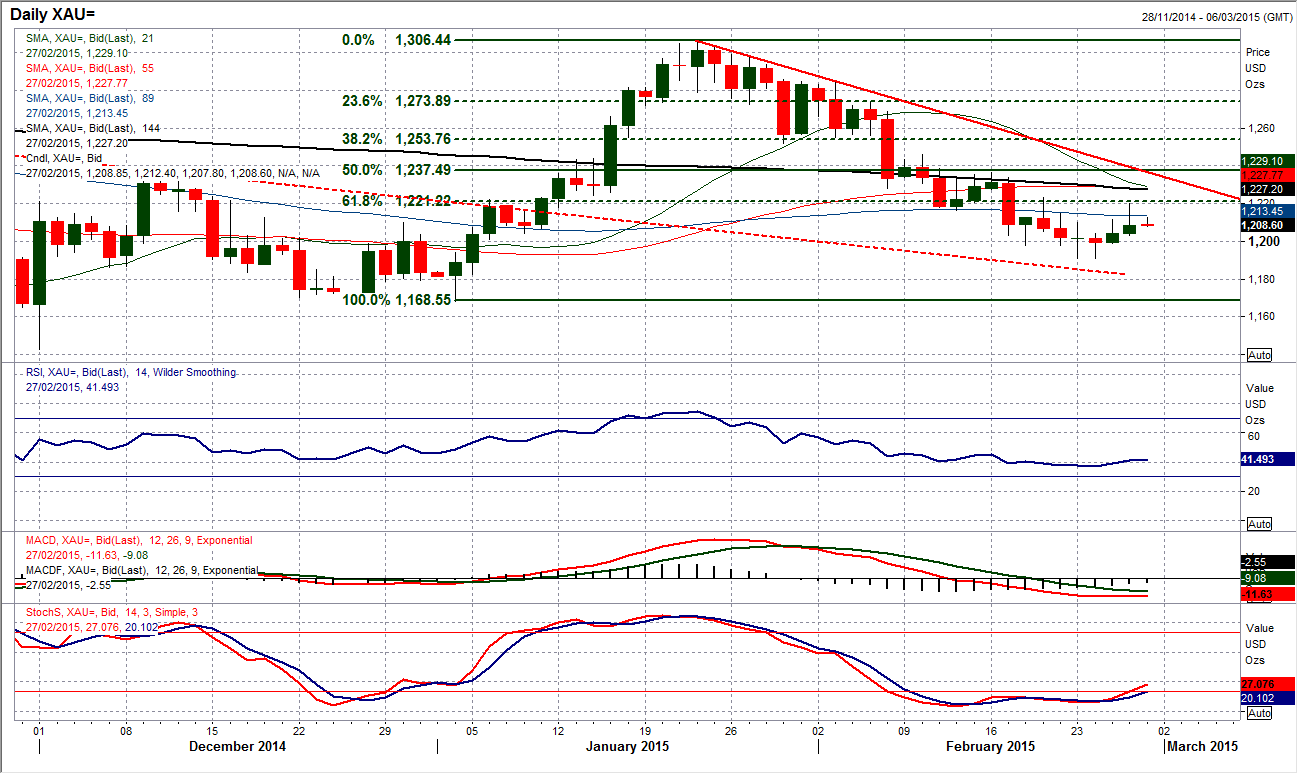
There is an interesting rally playing out on gold at the moment (coming amidst a dollar strengthening). The gold price has left a near term low at $1191 to claw back some of its lost ground. There is still much to do to suggest this is anything more than a bear rally. Yesterday’s peak at $1220 has once more come below the lower reaction high of $1223.10 which needs to be overcome to break the sequence of lower highs and lower lows. The daily chart shows successive positive days although this needs to be caveated with the lack of conviction in the candles of both Wednesday and Thursday which closed below the mid-point of the daily range. The resistance of the medium term downtrend comes in at $1236.50 and for now this is still a countertrend move and I still expect that this move will fizzle out soon with the likely resumption of the selling pressure. For now though perhaps it is best to wait for the sell signals.
WTI Oil
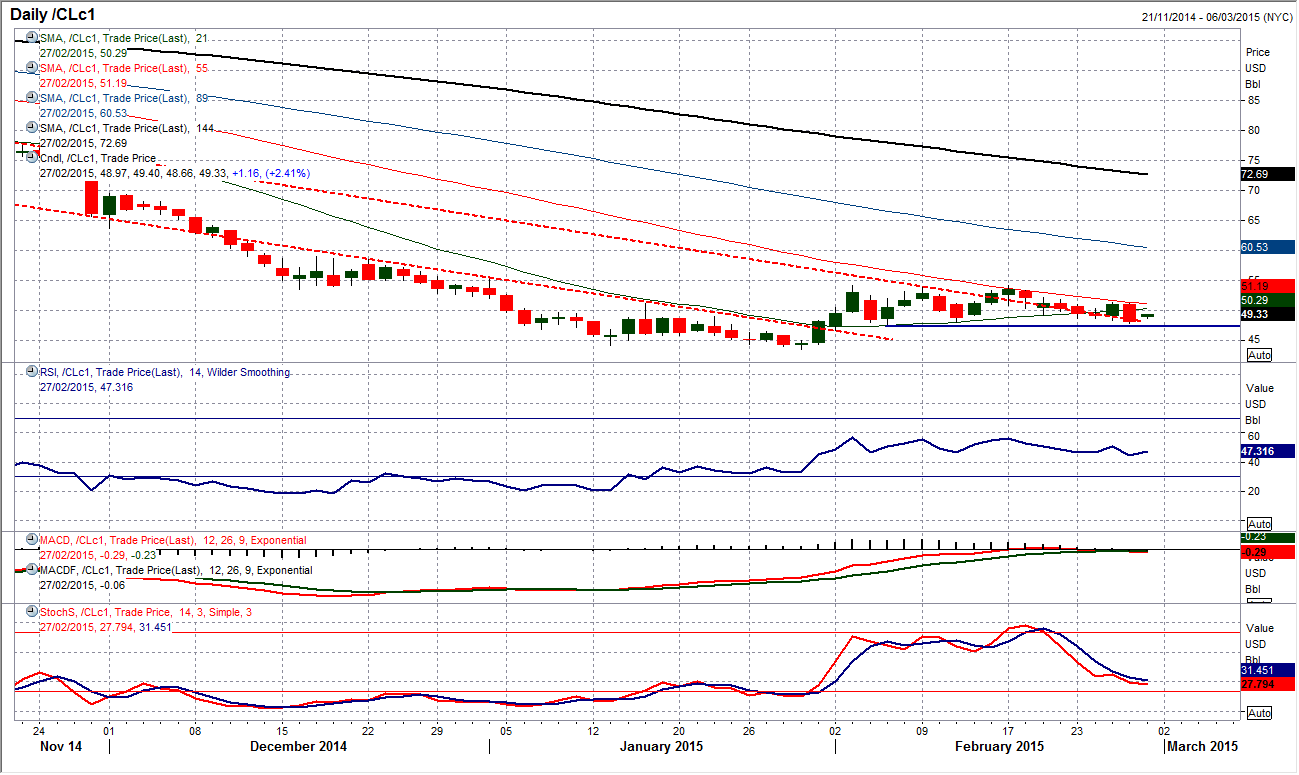
The volatility continues but now it is beginning to do some real damage to the recovery argument. The WTI oil price has been consolidating now for almost 4 weeks but the pressure is building to the downside now. The key low at $47.36 remains intact but momentum is deteriorating, the 21 day moving average which had been a great basis of support, has broken down and it now looks as though the bulls will do well to hold on to support at $47.36. If this is now broken it would re-open the way back towards the low at $43.58. The intraday chart shows a slight element of support has formed at $47.80 last yesterday and this will be seen as an early indicator of sentiment today. Intraday resistance is now $51.28.
Note: All information on this page is subject to change. The use of this website constitutes acceptance of our user agreement. Please read our privacy policy and legal disclaimer. Opinions expressed at FXstreet.com are those of the individual authors and do not necessarily represent the opinion of FXstreet.com or its management. Risk Disclosure: Trading foreign exchange on margin carries a high level of risk, and may not be suitable for all investors. The high degree of leverage can work against you as well as for you. Before deciding to invest in foreign exchange you should carefully consider your investment objectives, level of experience, and risk appetite. The possibility exists that you could sustain a loss of some or all of your initial investment and therefore you should not invest money that you cannot afford to lose. You should be aware of all the risks associated with foreign exchange trading, and seek advice from an independent financial advisor if you have any doubts.
Recommended Content
Editors’ Picks
AUD/USD could extend the recovery to 0.6500 and above

The enhanced risk appetite and the weakening of the Greenback enabled AUD/USD to build on the promising start to the week and trade closer to the key barrier at 0.6500 the figure ahead of key inflation figures in Australia.
EUR/USD now refocuses on the 200-day SMA

EUR/USD extended its positive momentum and rose above the 1.0700 yardstick, driven by the intense PMI-led retracement in the US Dollar as well as a prevailing risk-friendly environment in the FX universe.
Gold struggles around $2,325 despite broad US Dollar’s weakness

Gold reversed its direction and rose to the $2,320 area, erasing a large portion of its daily losses in the process. The benchmark 10-year US Treasury bond yield stays in the red below 4.6% following the weak US PMI data and supports XAU/USD.
Bitcoin price makes run for previous cycle highs as Morgan Stanley pushes BTC ETF exposure

Bitcoin (BTC) price strength continues to grow, three days after the fourth halving. Optimism continues to abound in the market as Bitcoiners envision a reclamation of previous cycle highs.
US versus the Eurozone: Inflation divergence causes monetary desynchronization

Historically there is a very close correlation between changes in US Treasury yields and German Bund yields. This is relevant at the current juncture, considering that the recent hawkish twist in the tone of the Federal Reserve might continue to push US long-term interest rates higher and put upward pressure on bond yields in the Eurozone.
