Market Overview
Greece may well have made an agreement of a 4 month bailout extension on Friday, but it still needs to submit detail of economic reform proposals. Apparently some reforms have been outlined but nothing really with any degree of detail as yet. Apparently the proposal was meant to have been submitted yesterday. A case of “my dog ate my homework” perhaps? However, the markets are quickly moving on to the next driver and that will be the testimony of Janet Yellen today before the Senate Banking Committee. After being caught a touch ahead of the game perhaps in the FOMC meeting minutes, attention will be paid to any language that Yellen uses. Interesting also that the meeting minutes were before the strong payrolls report so this will be the most up-to-date perspective. For example, “patience” will be watched for as a guide as to how the FOMC may act in the next two meetings. Yellen is a steady hand on the tiller and I would not expect any major changes of tack, however the dollar, Treasuries and US equity markets could be reactive to her testimony.
Wall Street was broadly flat last night with the uncertainty of Yellen today and also the lack of progress from the Greek reform proposals. The S&P 500 closed 0.1% lower. Asian markets continue to be mixed to slightly higher, but on low volume. The European markets have started the day slightly lower. The FTSE 100 continues to seek for the strength to breakout to an all-time high. The falling oil price is not going to help.
Forex markets showed a positive dollar move yesterday which has slightly stalled today. This is understandable given the fact that the Fed chairman is speaking today. The announcement of final Eurozone CPI is at 1000GMT and could be one to impact on the euro. The expectation is for a -0.6% which would be in line with the flash data. At the same time, Bank of England Governor Mark Carney is testifying to the Treasury Select Committee on the inflation report. This could have an impact on sterling. The data in the afternoon is the US Consumer Confidence at 1500GMT which is expected to dip back to 99.6 from 102.9, however eyes will be on Yellen’s speech at this time.
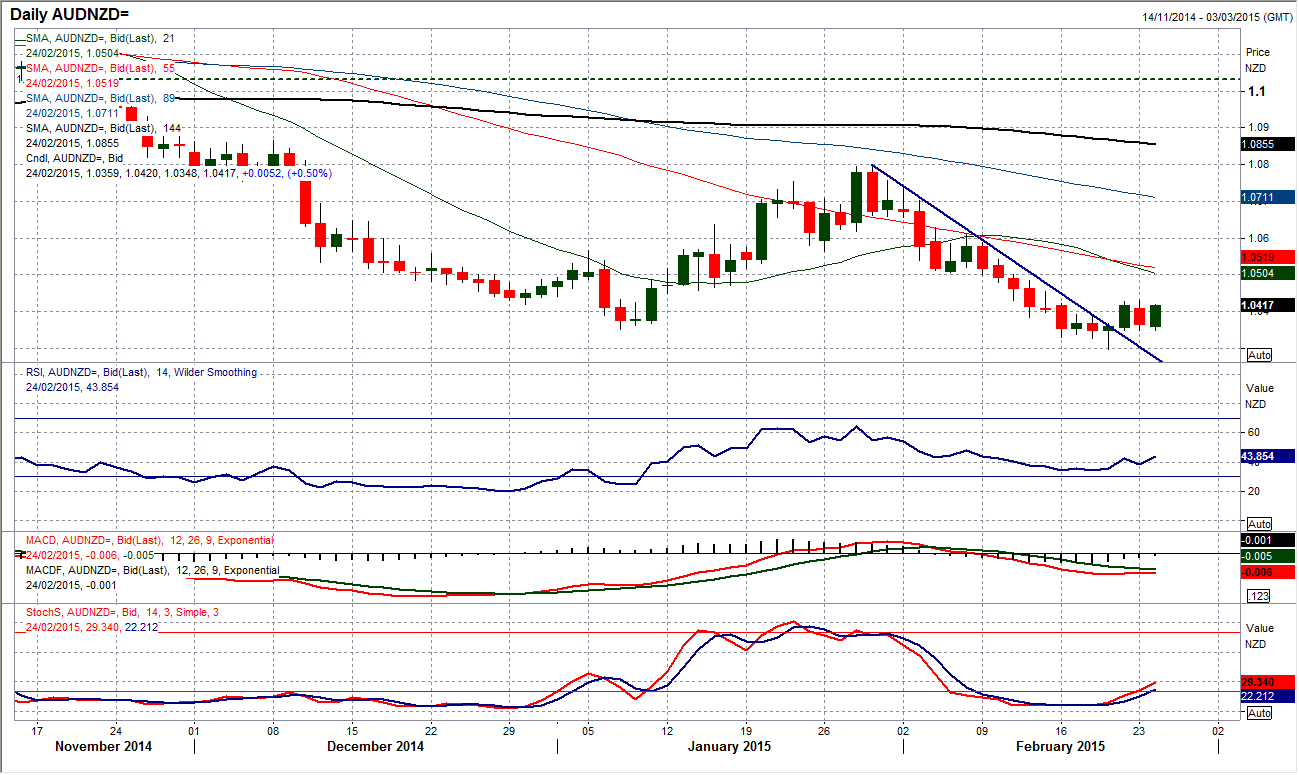
Chart of the Day –AUD/NZD
The Aussie/Kiwi cross has become an interesting pair to watch in the past few days. The Kiwi has performed very well as the oil price has formed support (strong positive correlation) but now the oil price has started to fall and this could impact the Kiwi. Measured against the Aussie dollar, the relationship has started to turn around. The strong Kiwi pulling the Aussie lower is reversing. A bull hammer last week began the turnaround and in the process has gone about breaking a three week downtrend. We have subsequently seen three strong candlesticks form which reflect the tussle that is now forming between the bulls and the bears. Interestingly, the daily Stochastics have today given a confirmed buy signal, whilst the MACD lines are bottoming and the RSI is also now rising. The intraday hourly chart shows there is now the prospect of a higher low at 1.0347 having been left if there is a break back above 1.0430. The key overhead resistance comes in at 1.0500 but there is a definite feeling of an improvement in sentiment for the Aussie against the Kiwi.
EUR/USD
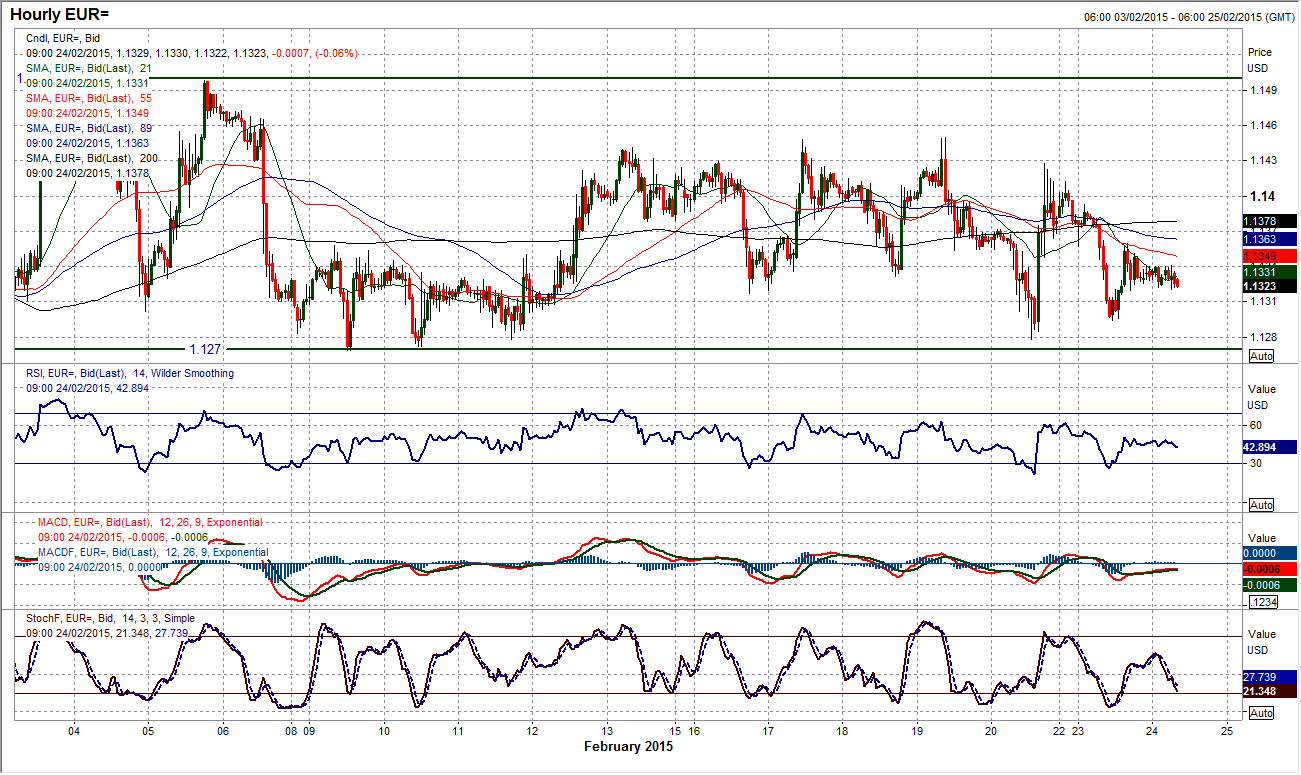
The downside pressure on the euro is just beginning to creep through once more. Although we still have the key support at $1.1260 intact the momentum is beginning to gather. Despite the lack of any significant direction (or bearish candlesticks) there has now been three negative closes in the past four sessions as the euro once again backs away from the resistance of the 23.6% Fibonacci retracement at $1.1443. Having previously shown a consistent improvement in momentum, over the past week the bears have been slowly regaining the control. RSI is now falling and Stochastics are at a 3 week low. The intraday hourly chart does not really show anything specifically negative and the bulls would argue that the support continues to be formed in the band $1.1260//$1.1300, however with key resistance now around $1.1450 there has been a lower high formed around a little pivot level resistance at $1.1360 that has formed over the past few days. It looks as though the euro is shaping for further pressure on the $1.1260 support, below which opens $1.1220 but little real support until the low again at $1.1098.
GBP/USD
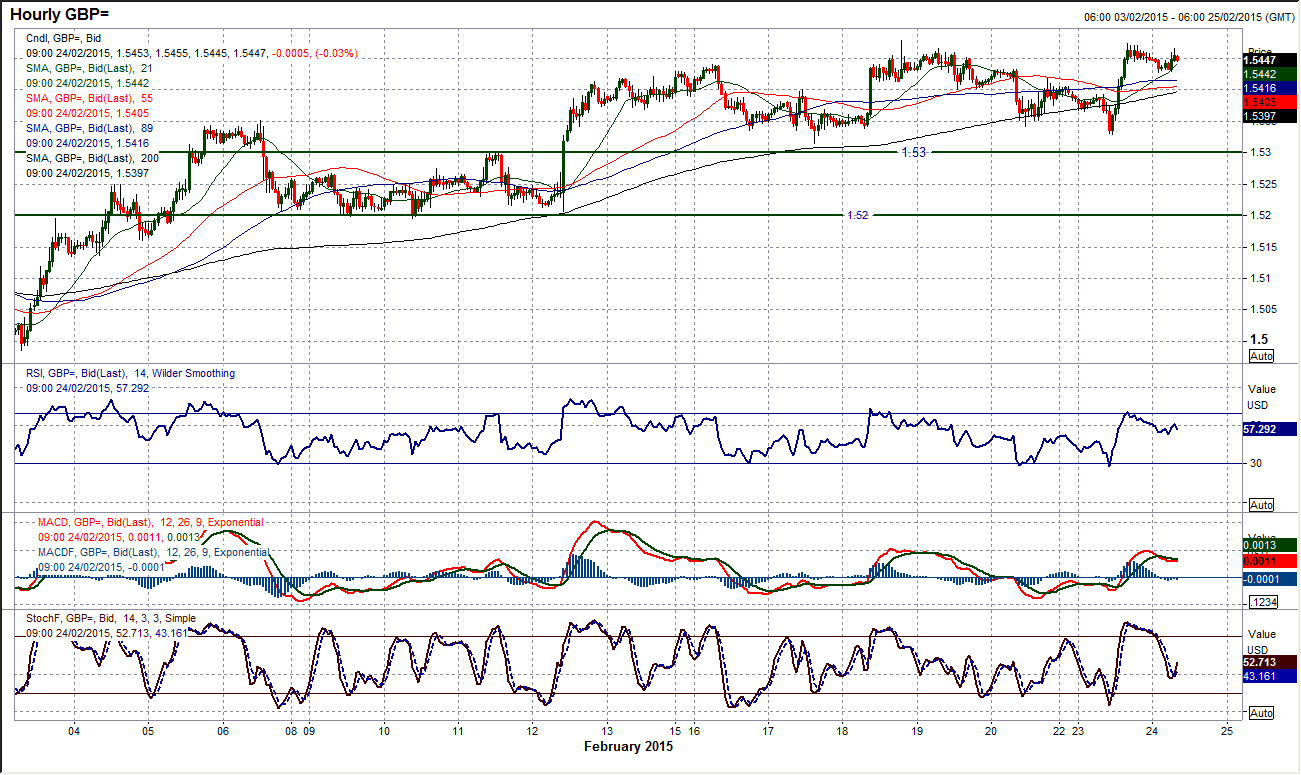
The bulls have been consistent in their support of Cable. After a couple of corrective days, a bullish outside day (a move below the previous low only to rally back to close above the previous high) has been formed which is a positive candle reflecting the appetite to support Cable. Daily momentum indicators are still positive, whilst the rising 21 day moving average which is shadowing the move higher is now at $1.5270. However the bulls still need to not become complacent. The intraday chart shows there was a dip yesterday which went below the 200 hour moving average which has been a good basis of support for the uptrend. The intraday move also went slightly further into the support than was comfortable. I am still of the opinion that whilst Cable trades above $1.5300 the outlook remains positive. There needs to also be a continued move above $1.5485 soon in order to prevent the bull run from becoming stale. The overnight drift lower has been supported and there is a good chance of further gains today.
USD/JPY
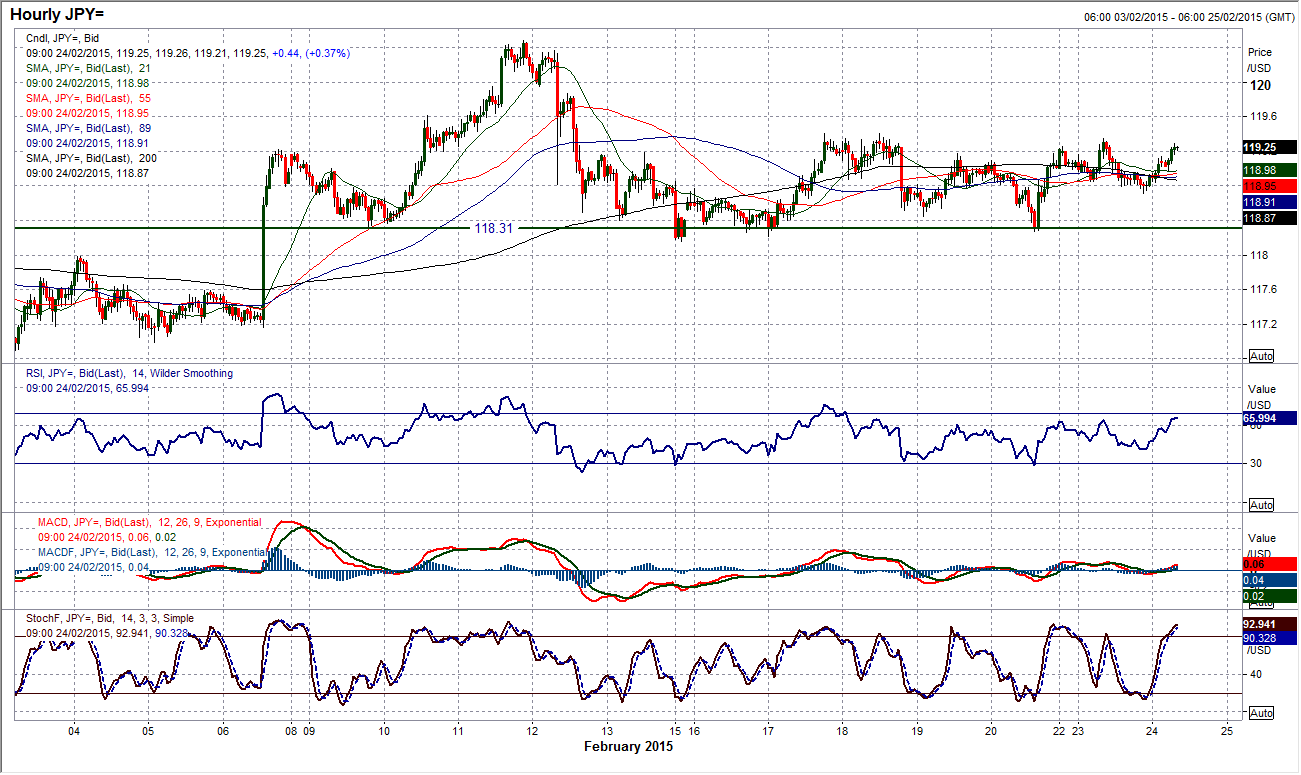
There is still a very marginal positive outlook to the daily chart, with the price trading above the moving averages and momentum just in positive configuration but it is only a very slight one. The intraday hourly chart shows the continued respect being paid to the 118.30 support is encouraging and for now the pressure is far more on the resistance overhead at 119.40. In truth there is a trading range that has formed since the 12th Feb and it would be risky to call the break. However along with support forming at yesterday’s low of 118.70, there are still several signs pointing towards an upside break, with the adding interesting factor that a confirmed upside breakout would exactly imply a target of the recent peak at 120.50.
Gold
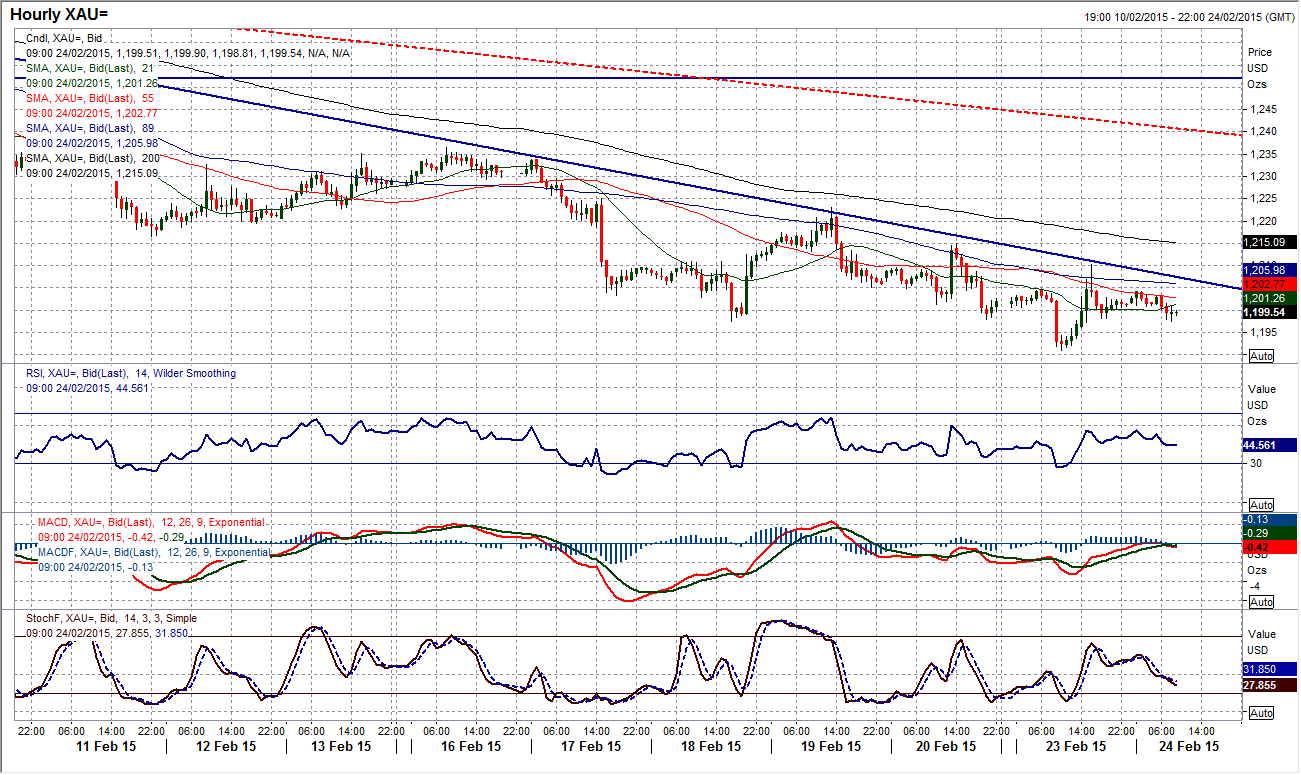
Another big candle yesterday has formed a “long-legged doji” (a neutral candle with the open and close at the same levels in the middle of a big candle range, denoting uncertainty within the prevailing trend). This is not as much of a concern to the bears as the failed hammer was last week and for now I am not anticipating any significant reversal. In any case, the momentum indicators are all falling away still and the trading overnight during Asian hours has once more been negative again. During my videos yesterday I drew in a downtrend on the intraday hourly chart running from the 3rd Feb high across all the recent lower highs. This downtrend capped the bounce yesterday almost to the pip before the sellers resumed control. The configuration of the hourly RSI, MACD and Stochastics also suggest that the rallies are still being seen as a chance to sell. There is now resistance in place at $1210.20 under $1214.90, whilst $1223.10 is now the key reaction high. I expect further downside pressure to retest $1191.00 and then back towards a full retracement at $1168.25 in due course.
WTI Oil
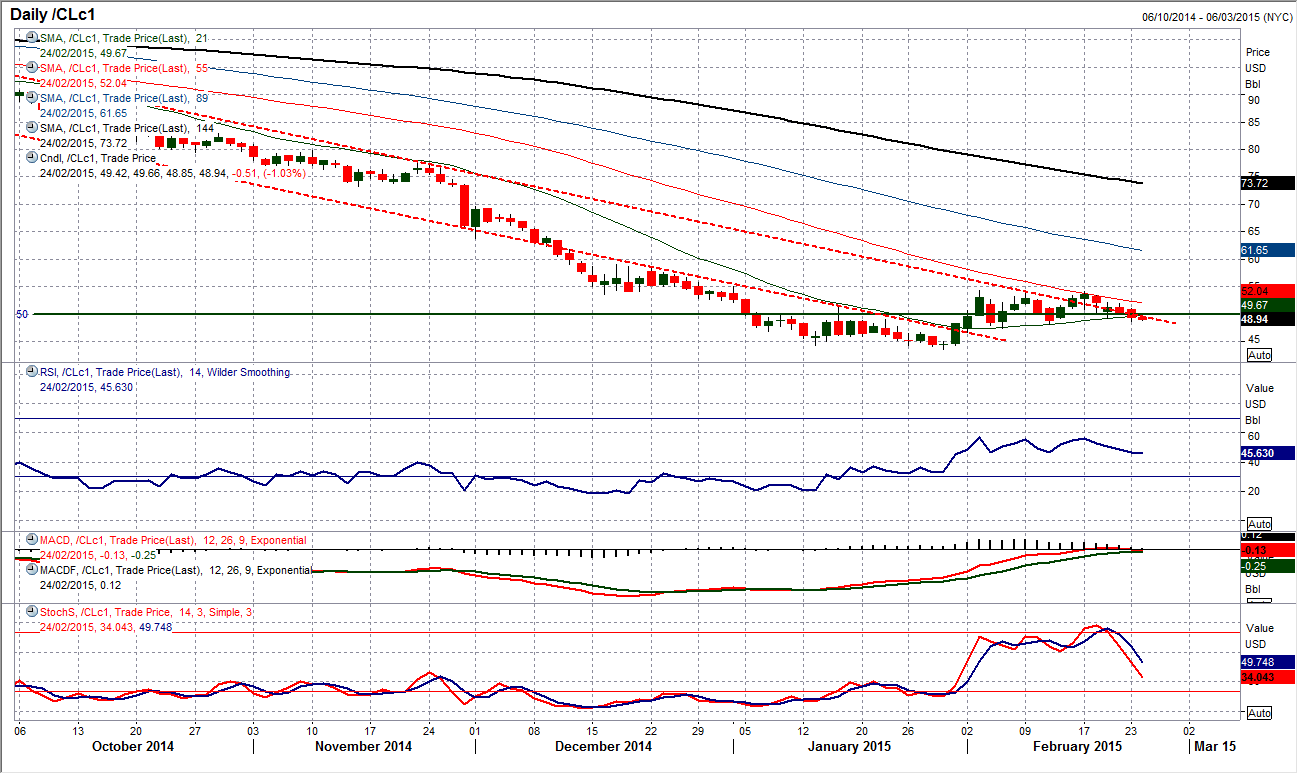
There is a bearish drift that is forming on WTI now. The 21 day moving average (currently $49.68) has picked the last two rising lows during the recent consolidation almost to the pip. However yesterday we started to see the 21 day m/a being broken and this has continued today. The fact that this is happening just as the Stochastics are starting to fall, and the MACD lines are rolling over around the neutral line, is beginning to become a concern for the bulls. The two key lows at $48.05 and $47.36 remain intact for now but the pressure is mounting. The intraday hourly chart shows a series of lower highs and lower lows in the past 4 days, which leaves $51.00 as the key near term resistance now. The hourly RSI has also taken on a more correction (negative) configuration which is consistently falling over below 60 and consistently moving back to or below 30. Yesterday’s low at $48.67 becomes minor support that if it is breached re-opens the pressure on the range lows again.
Note: All information on this page is subject to change. The use of this website constitutes acceptance of our user agreement. Please read our privacy policy and legal disclaimer. Opinions expressed at FXstreet.com are those of the individual authors and do not necessarily represent the opinion of FXstreet.com or its management. Risk Disclosure: Trading foreign exchange on margin carries a high level of risk, and may not be suitable for all investors. The high degree of leverage can work against you as well as for you. Before deciding to invest in foreign exchange you should carefully consider your investment objectives, level of experience, and risk appetite. The possibility exists that you could sustain a loss of some or all of your initial investment and therefore you should not invest money that you cannot afford to lose. You should be aware of all the risks associated with foreign exchange trading, and seek advice from an independent financial advisor if you have any doubts.
Recommended Content
Editors’ Picks
EUR/USD regains traction, recovers above 1.0700

EUR/USD regained its traction and turned positive on the day above 1.0700 in the American session. The US Dollar struggles to preserve its strength after the data from the US showed that the economy grew at a softer pace than expected in Q1.
GBP/USD returns to 1.2500 area in volatile session

GBP/USD reversed its direction and recovered to 1.2500 after falling to the 1.2450 area earlier in the day. Although markets remain risk-averse, the US Dollar struggles to find demand following the disappointing GDP data.
Gold holds around $2,330 after dismal US data

Gold fell below $2,320 in the early American session as US yields shot higher after the data showed a significant increase in the US GDP price deflator in Q1. With safe-haven flows dominating the markets, however, XAU/USD reversed its direction and rose above $2,340.
XRP extends its decline, crypto experts comment on Ripple stablecoin and benefits for XRP Ledger

Ripple extends decline to $0.52 on Thursday, wipes out weekly gains. Crypto expert asks Ripple CTO how the stablecoin will benefit the XRP Ledger and native token XRP.
After the US close, it’s the Tokyo CPI

After the US close, it’s the Tokyo CPI, a reliable indicator of the national number and then the BoJ policy announcement. Tokyo CPI ex food and energy in Japan was a rise to 2.90% in March from 2.50%.
