Market Overview
The wild swings in market sentiment are making trading with any real conviction hard work and positions of anything over a day of duration something of a lottery. The sharp disappointment of first Chinese manufacturing PMIs and then the disappointment of the US ISM Manufacturing as well resulted in a flight into safe havens and out of riskier assets such as equities. The sharp reversal in the oil price is having a part to play too, with WTI over 10% lower from its peak just on Monday. This helped to drive Wall Street sharply lower with the S&P 500 around 3% lower. However there could be the early signs of some consolidation amid the wild swings in market sentiment we have seen recently. Asian markets have been consolidating overnight, unable to find any real direction as Wall Street futures have picked up slightly. This is helping to drive what looks to be a pensive open on the European indices too.
In forex trading there has been a mixed performance from the US dollar so far and it seems as though there is a retracement of some of the moves it saw yesterday. There is dollar strength against the euro and the yen as recent losses have been unwound, however, against the commodity currencies the dollar is slightly weaker. The Aussie is broadly flat which is a slight surprise given that the Australian GDP missed expectations this morning, coming in at +0.2% for the quarter (+0.4% expected). Gold and silver are broadly flat although the oil price is again under selling pressure early in the session.
Traders will be looking out for UK Construction PMI at 0930BST which is expected to improve slightly to 57.5 (from 57.1) but given that the construction industry accounts for around 5% of UK GDP it is unlikely to make too much of an impact on sterling. The US ADP employment report is expected to show 201,000 jobs were added on the private payrolls company in August, which would be better than the 185,000 from the previous month. The Factory Orders at 1500BST will also be keenly watched and are expected to show a month on month growth of 0.9%. US crude oil inventories are at 1530BST and are expected to show no change on stocks after last week’s surprise draw of 5.5m barrels.
Chart of the Day – EUR/GBP
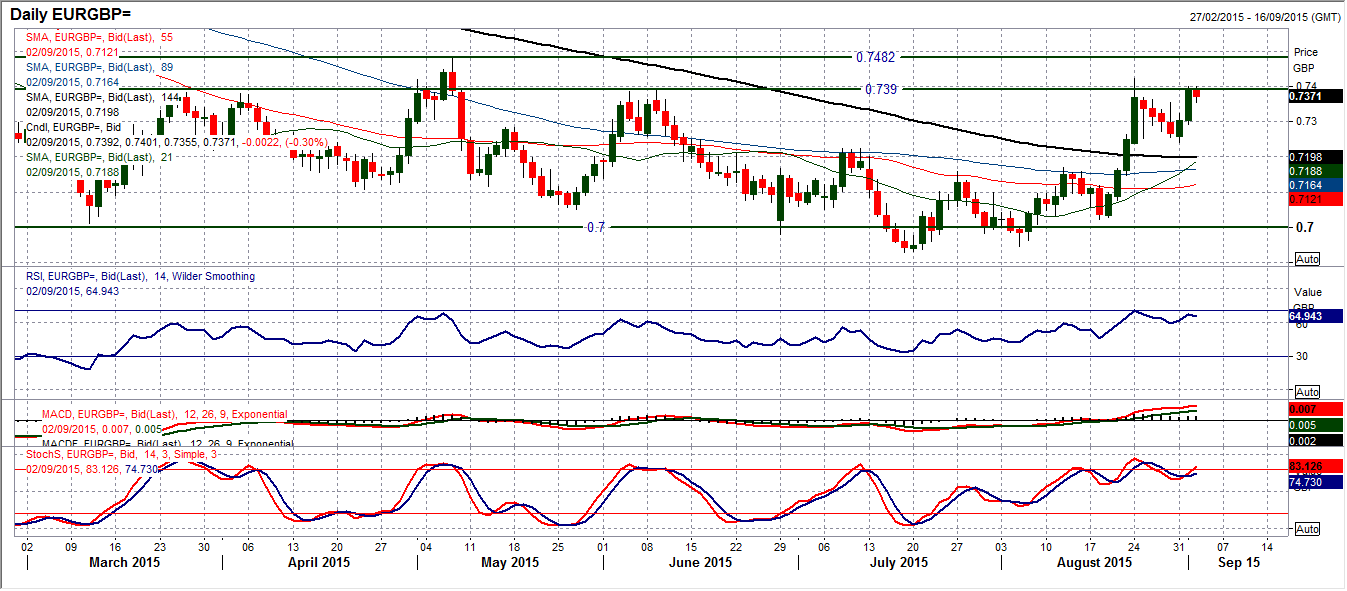
The euro has strengthened significantly in the past couple of weeks as the big carry trade has been unwound. This has meant that the outlook for EUR/GBP has turned far more positive. The rally that moved the pair above the moving averages and resistance at £0.7223 consolidated in the past week to find support and is now looking to break higher again. Following yesterday’s sharp gains, a move above £0.7423 resistance would complete the break which would imply of around 180 pips. However more importantly a breakout would be a near 4 month high and a direct test of the May high at £0.7482. The main stumbling block is that Euro/Sterling is now into the significant band of resistance £0.7390/£0.7480 so it may need a significant effort to achieve a breakout. This will be a real test of the bulls’ credentials. The intraday hourly chart shows momentum is not screaming for a breakout but is still positive. There is near term pivot level support at £0.7300 and a loss of the support would temper the bulls for now.
EUR/USD
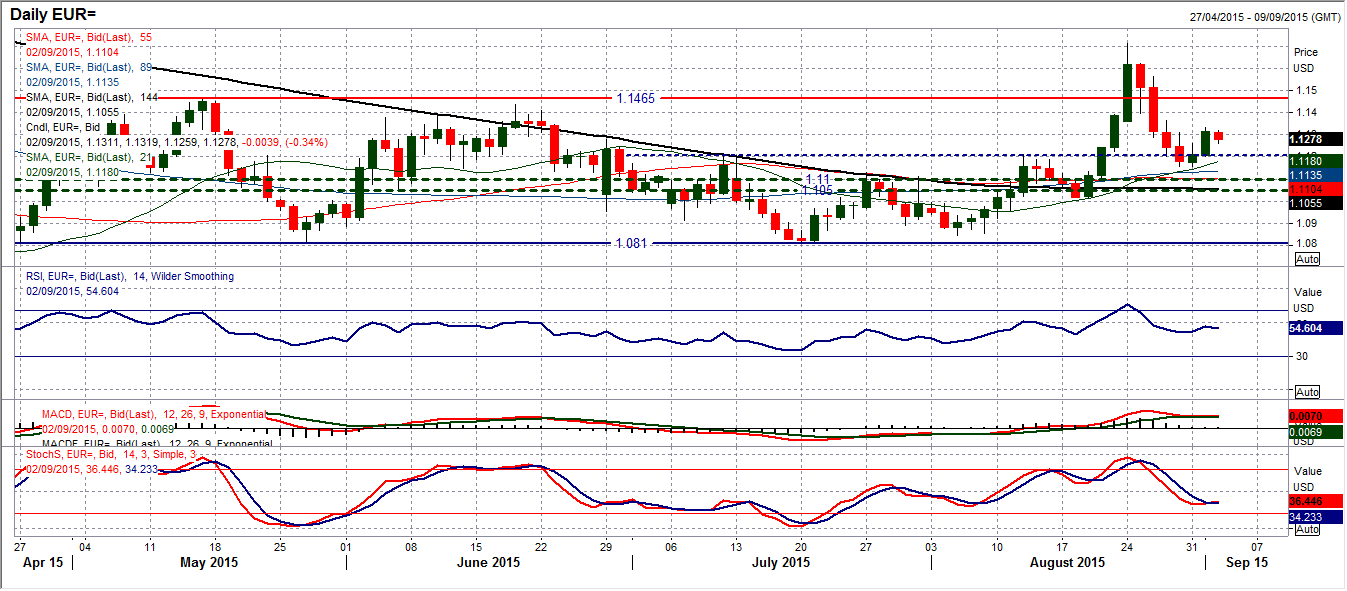
The daily chart of the euro shows that support has been strengthened at $1.1155 by the rebound of the past couple of days. The fact that this move came above the $1.1050/$1.1100 pivot is a positive near to medium term development for the euro but also with the momentum indicators settling into a more neutral configuration the outlook is fairly positive still. The rising 21 day moving average (at $1.1180) has caught the last two corrections and adds to the support. The hourly chart suggests there is more of a consolidation in play which is helping to settle the market after a hugely volatile period for the euro. There is a series of higher lows in place now and the bulls would not want to lose the support of yesterday’s low at $1.1230. There is a mildly positive configuration on the momentum but in truth this still looks to be a consolidation phase. A move above the resistance at $1.1330 would help to drive the market higher though. For now we await the next catalyst.
GBP/USD
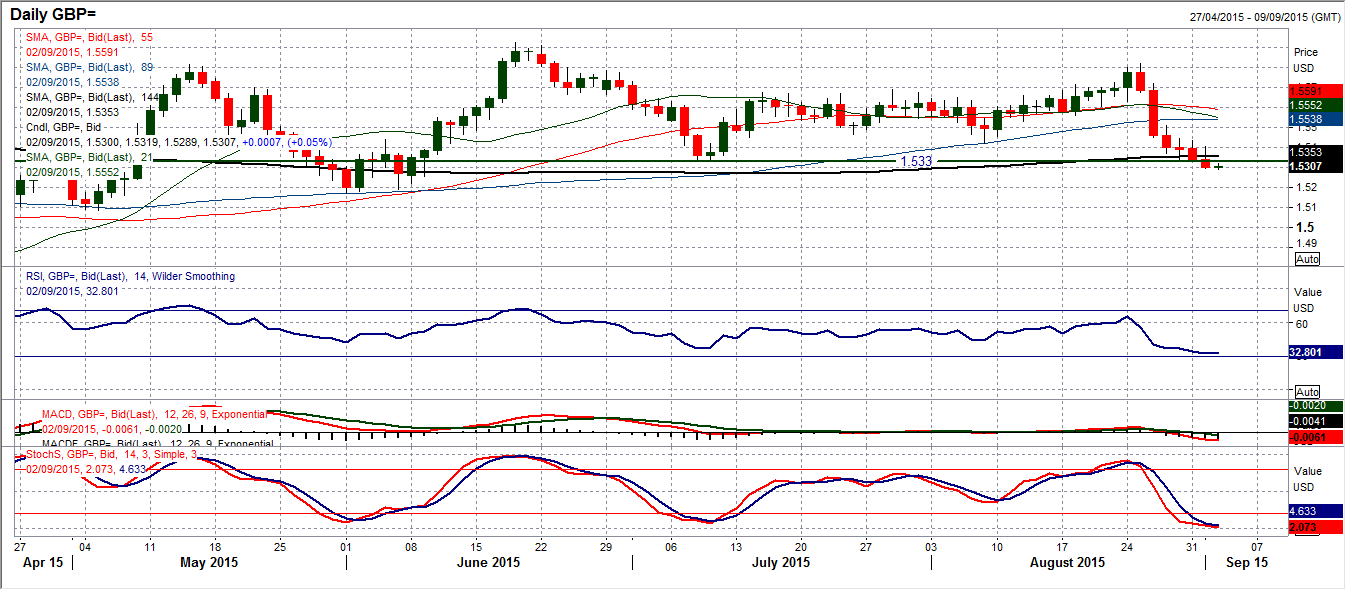
Cable is under pressure near term as the support of the July low at $1.5330 has been breached. The big question is whether this is a decisive breakdown that will result in a decisive trend formation. Although the breakdown of support is certainly not a positive, I will not be turning negative on Cable until the next key low of the June support at $1.5170 has been breached. I am still of the opinion that Cable is a range play and if you look at the momentum indicators they do not have a configuration that would suggest there is an imminent bearish trend about to take hold. With there being a lack of trend (or sideways trend) in recent months that means that the classic extreme signals on the RSI become an opportunity to play the range. The RI is now back into the low 30s whilst the Stochastics are now oversold. This would suggest any signs of support could induce a buy signal. With Cable having traded lower for 6 straight days now, the intraday hourly chart shows a sequence of lower highs in place, the latest at yesterday’s high of $1.5387. For now the trend is lower, but I am also aware that the momentum signals are also into an area where a reversal could be seen, if this range play is to continue.
USD/JPY
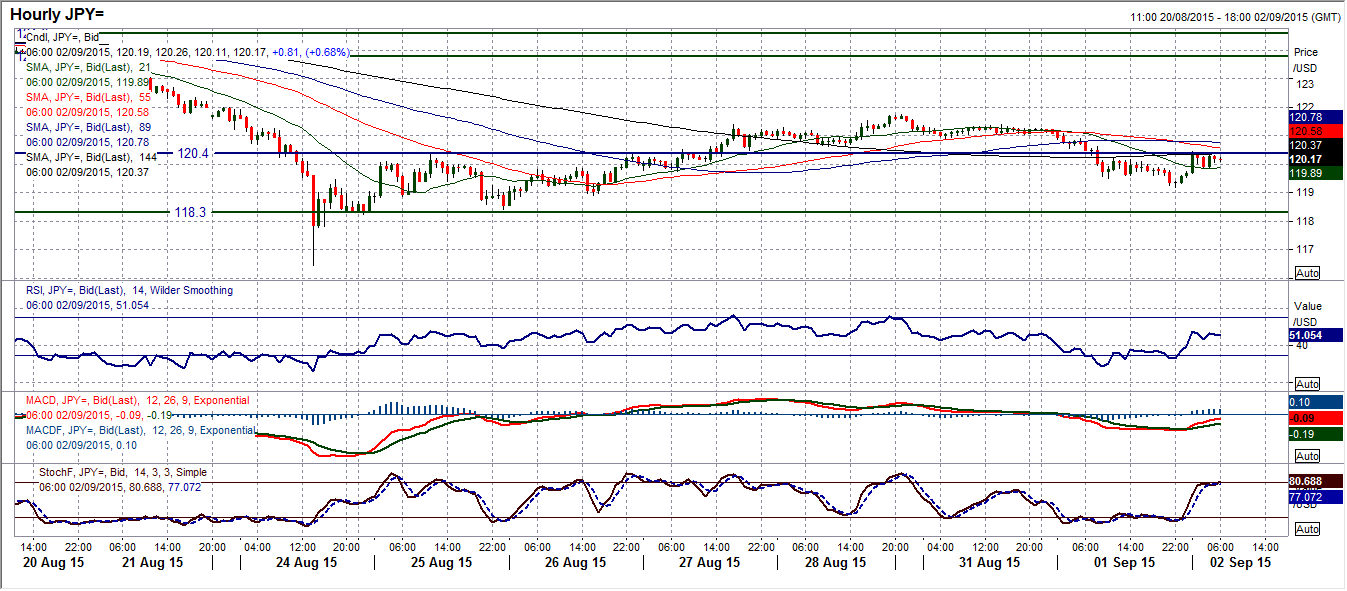
The volatility continues as yesterday’s sharp decline of around 200 pips shows. For a major pair that can be notoriously benign at times, this is a period of significant volatility in the day to day moves. There is still the need for the price to settle down before we can get a realistic outlook of what has happened. The Fibonacci retracements do not appear to be doing much at the moment, but are still useful reference points. The concern on the momentum indicators is that the RSI is in a more bearish configuration, the MACD lines are negative and the Stochastics have turned lower. This all Suggests a bearish bias. On the intraday hourly chart, I talked previously about the range 118.30/120.40 and having broken back into that range, the upper band at 120.40 has again become the basis of resistance near term, despite a bounce overnight. This is a level to be watched today, but the balance of the technical indicators suggesting rallies are being sold into.
Gold
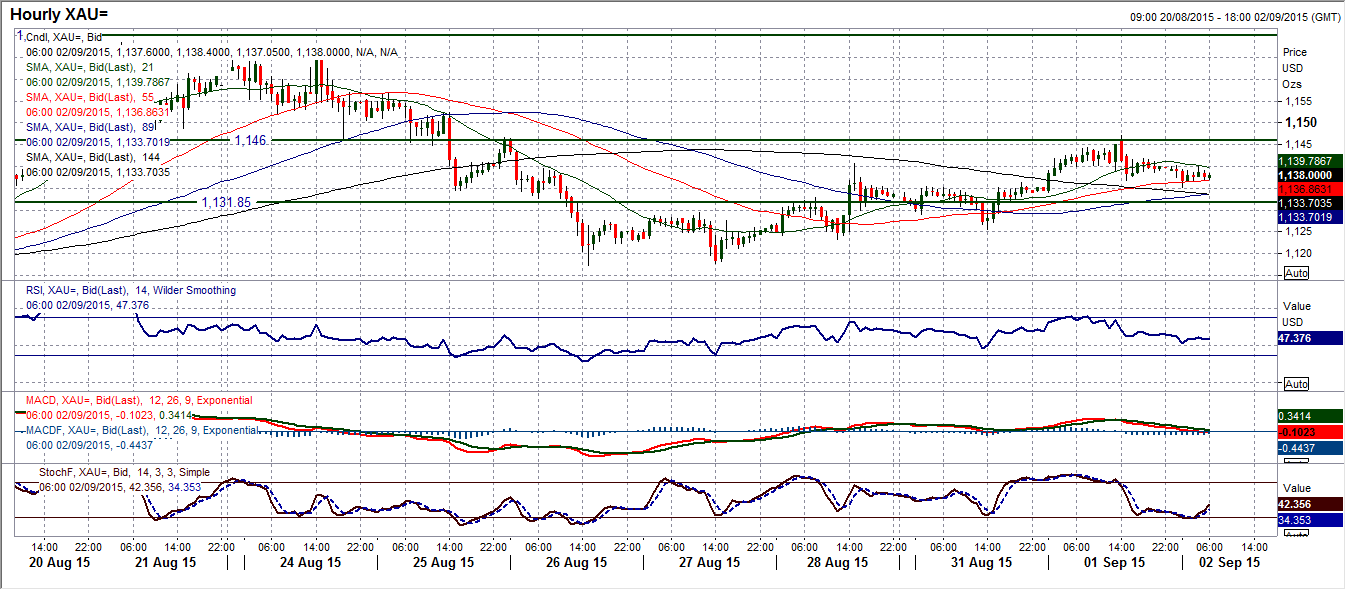
Amidst the volatility of so many other instruments that I look at, it is notable that for the past week, gold has been calmly drifting higher. This comes with a fairly positive candle that was posted yesterday, although closing around the mid-point of the daily range suggests that the bulls were not quite as strong as they could have been. Looking at the momentum indicators though this is in keeping with an outlook that is mildly positive without any exuberance. This is also reflected on the hourly intraday chart where the hourly momentum is now comfortably positive and has unwound in the past day and is now looking to use this slight drift back from $1147.20 as a chance to buy. I spoke yesterday in my videos about the minor support around $1135/$1136 and this is where the drift has retreated to and is now looking to push higher. The near term bulls would remain in control until a breach of $1125.50 support.
WTI Oil
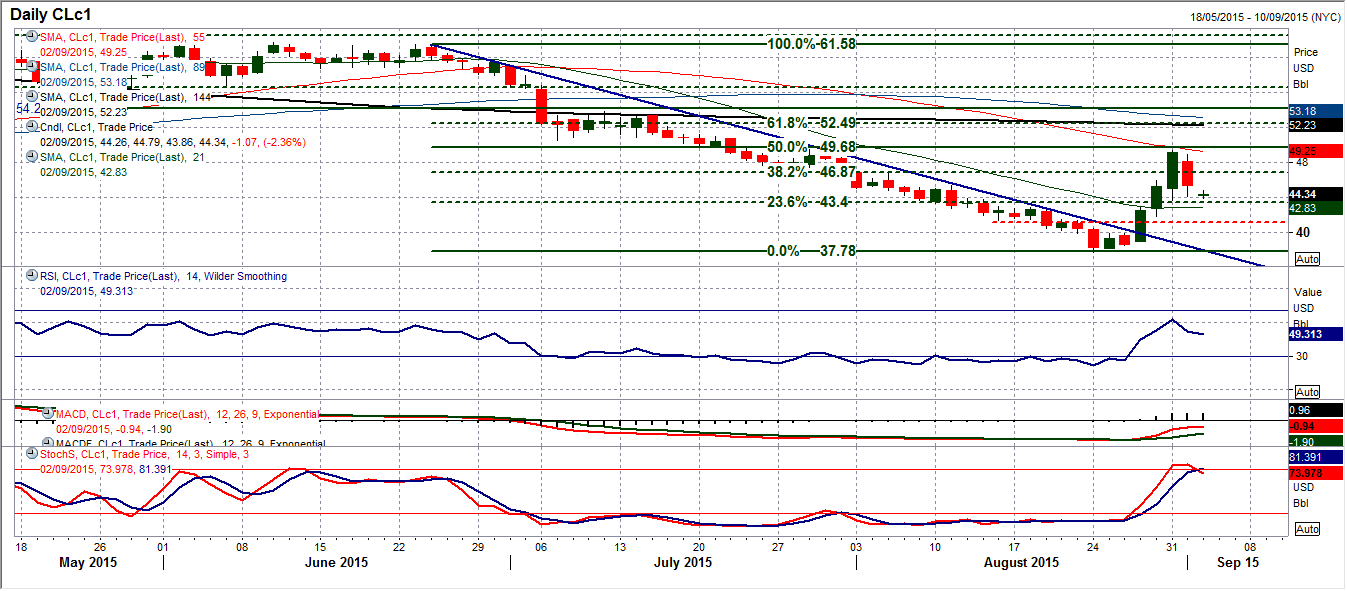
Although the rally seems to have come to an end, the incredible trading days just continue. The chart of WTI has posted a huge negative candle that all but wiped out the near 9% gains from Monday. The volatility in this chart makes trading with any conviction an incredibly difficult activity. I have tried to use the Fibonacci retracements as a guide but as yet there seems to be little regard given to them, as the 38.2% retracement of the $61.57/$37.75 bear run at $46.87 has been broken. As yet the big bull rebound of last week has not been lost. A breach of Monday’s low at $43.60 would seriously question whether the bulls have lost control or now, whilst the added support of the 23.6% Fib retracement at $43.40 would be confirmation for me. With the incredible volatility of the past week though, anything seems to be possible on WTI right now.
Note: All information on this page is subject to change. The use of this website constitutes acceptance of our user agreement. Please read our privacy policy and legal disclaimer. Opinions expressed at FXstreet.com are those of the individual authors and do not necessarily represent the opinion of FXstreet.com or its management. Risk Disclosure: Trading foreign exchange on margin carries a high level of risk, and may not be suitable for all investors. The high degree of leverage can work against you as well as for you. Before deciding to invest in foreign exchange you should carefully consider your investment objectives, level of experience, and risk appetite. The possibility exists that you could sustain a loss of some or all of your initial investment and therefore you should not invest money that you cannot afford to lose. You should be aware of all the risks associated with foreign exchange trading, and seek advice from an independent financial advisor if you have any doubts.
Recommended Content
Editors’ Picks
EUR/USD holds gains near 1.0650 amid risk reset

EUR/USD is holding onto its recovery mode near 1.0650 in European trading on Friday. A recovery in risk sentiment is helping the pair, as the safe-haven US Dollar pares gains. Earlier today, reports of an Israeli strike inside Iran spooked markets.
GBP/USD recovers toward 1.2450 after UK Retail Sales data

GBP/USD is rebounding toward 1.2450 in early Europe on Friday, having tested 1.2400 after the UK Retail Sales volumes stagnated again in March, The pair recovers in tandem with risk sentiment, as traders take account of the likely Israel's missile strikes on Iran.
Gold price defends gains below $2,400 as geopolitical risks linger

Gold price is trading below $2,400 in European trading on Friday, holding its retreat from a fresh five-day high of $2,418. Despite the pullback, Gold price remains on track to book the fifth weekly gain in a row, supported by lingering Middle East geopolitical risks.
Bitcoin Weekly Forecast: BTC post-halving rally could be partially priced in Premium

Bitcoin price shows no signs of directional bias while it holds above $60,000. The fourth BTC halving is partially priced in, according to Deutsche Bank’s research.
Geopolitics once again take centre stage, as UK Retail Sales wither

Nearly a week to the day when Iran sent drones and missiles into Israel, Israel has retaliated and sent a missile into Iran. The initial reports caused a large uptick in the oil price.
