Market Overview
Japanese Prime Minister Shinzo Abe put his neck on the line and has survived with a renewed mandate to implement Abenomics. However the market reaction has not been especially favourable in Japan, with the yen strengthening, and the Nikkei 225 subsequently trading lower. Some of the pressure can be considered to be exogenous as the continued weakness in the oil price has equity market investors increasingly spooked. With Wall Street closing sharply lower on Friday, the European trading session has begun under mild downside pressure.
In forex trading there is still some slight negativity for the US dollar today with sterling and especially the yen trading stronger. In fact, only the Aussie dollar is trading weaker against the greenback, potentially with an on-going terrorist/hostage situation taking its toll.
There is not a huge amount of economic data to drive the markets today (although the rest of the week is dense with releases). The US industrial production is releases at 14:15GMT which is expected to improve to 0.8% for the month (-0.1% last), whilst the capacity utilization is also set to increase strongly to 79.4 (from 78.9) which would be positive for the dollar as the Federal Reserve would look at this with regard to potentially being a hawkish signal for tightening.
Chart of the Day – EUR/JPY
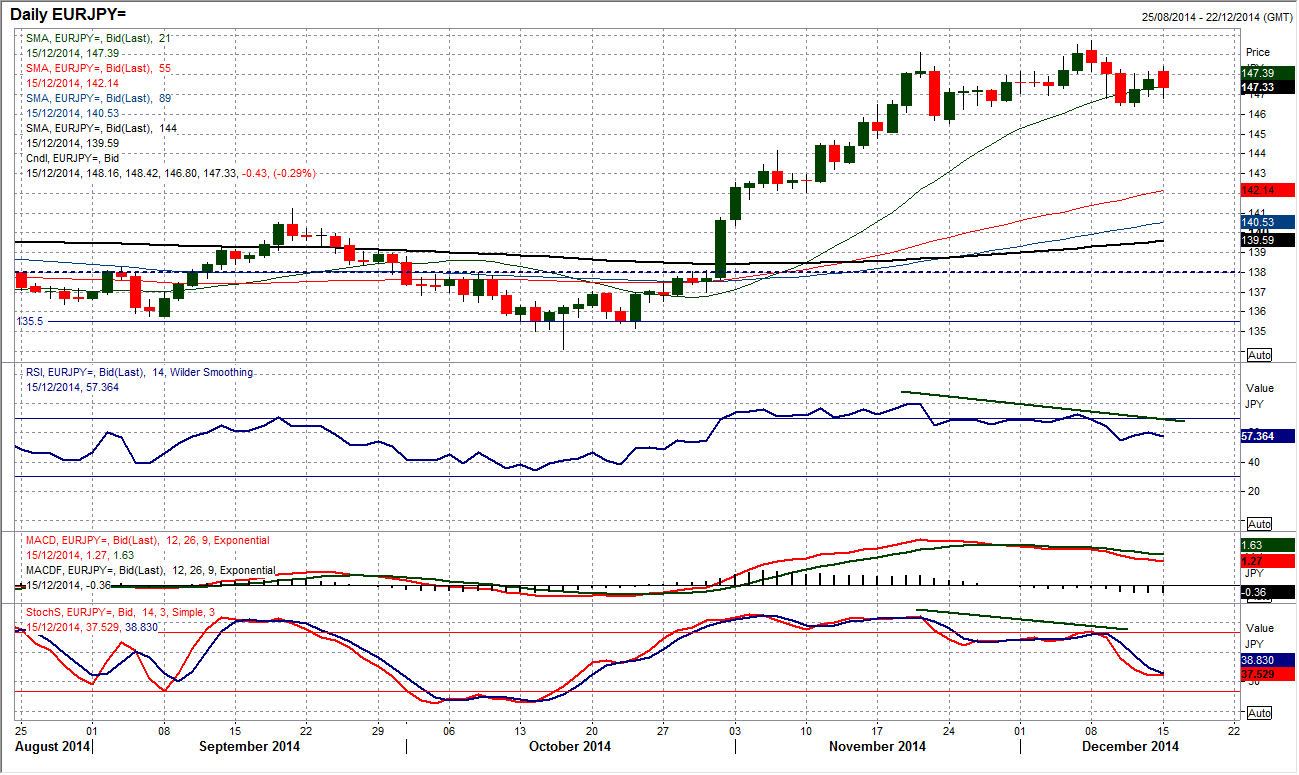
The positive outlook on Euro/Yen is now being seriously threatened and the run higher from 134.11 which has so far hit 149.72 could be set for a correction. There has been no explicit sell signal on the price yet (although the number of bearish candles are mounting). However it is more the momentum indicators giving a series of sell signals. A bearish divergence with a failure swing on the RSI is a strong signal, as is the similar signal on the Stochastics and a bearish crossover on the MACD. No key higher reaction low has been breached yet, with 145.55 the key near term support. The intraday hourly chart shows a broken 5 week uptrend in the past few days and a move below 146.40 would put pressure on the key support. Hourly moving averages have flattened off to reflect a near term consolidation, but there is still a slight downside bias to hourly momentum to compound the deterioration in the daily chart. Near term resistance is now at 148.42.
EUR/USD
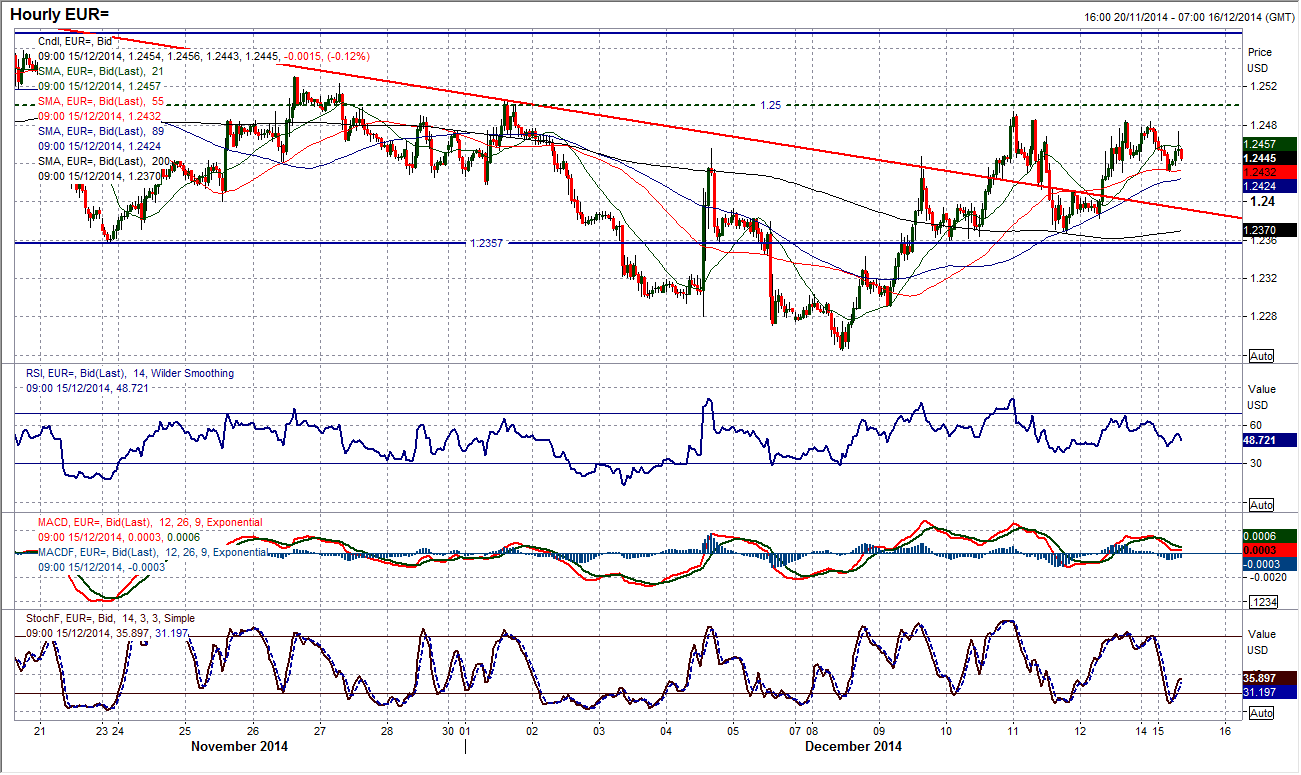
There has been a change in outlook for the euro in the last few days, however, the big question is whether this improvement can turn into something more sustainable. As yet nothing too significant has been achieved other than a break of the medium term downtrend, with the euro having been trading with higher daily lows now for the past four completed sessions. Friday’s low was at $1.2382. However, there needs to be a break of a key reaction high within the old downtrend for the improvement to be considered as something more than a sideways consolidation. The Reaction high at $1.2531 is therefore the first key level. Until then the momentum indicators have improved but again, are still in a medium term bearish configuration and could easily be considered as negative again if the outlook deteriorates. The intraday hourly chart shows the improving near term picture, however there is the pivot level at $1.2500 that is still a barrier. A key low is now in place at $1.2368.
GBP/USD
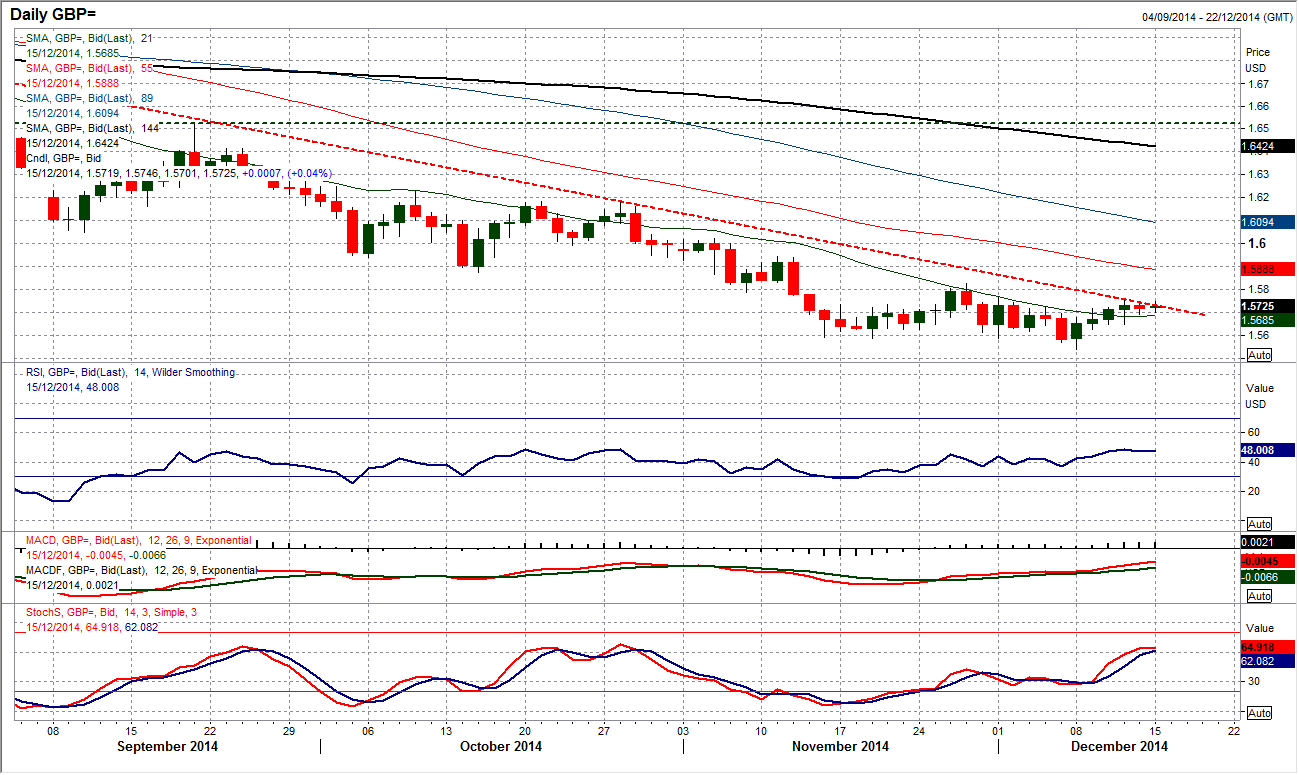
Cable is in a similar sort of position as the euro, however without the broken downtrend. A sequence of four straight higher daily lows has improved the outlook but very little has actually been achieved yet. The equivalent reaction high that sterling needs to breach is at $1.5825 for the bulls to be in control of the near to medium term outlook. Momentum has improved but is still in a position where it can be considered as just unwinding a bearish configuration. Zooming out slightly on the intraday hourly chart and it picks up a consolidation range period in place over the past month. So we now look for signals to suggest whether this range will resolve to the downside (still most likely as it would continue the trend) of form a base pattern. Hourly momentum over the past week has been positive but is potentially running out of steam with a failure to breach resistance at $1.5756. Very near term a consolidation has formed between $1.5692 and $1.5745. If the low is breached then the momentum could quickly dissipate and Cable could test $1.5645 which is the near term key support now.
USD/JPY
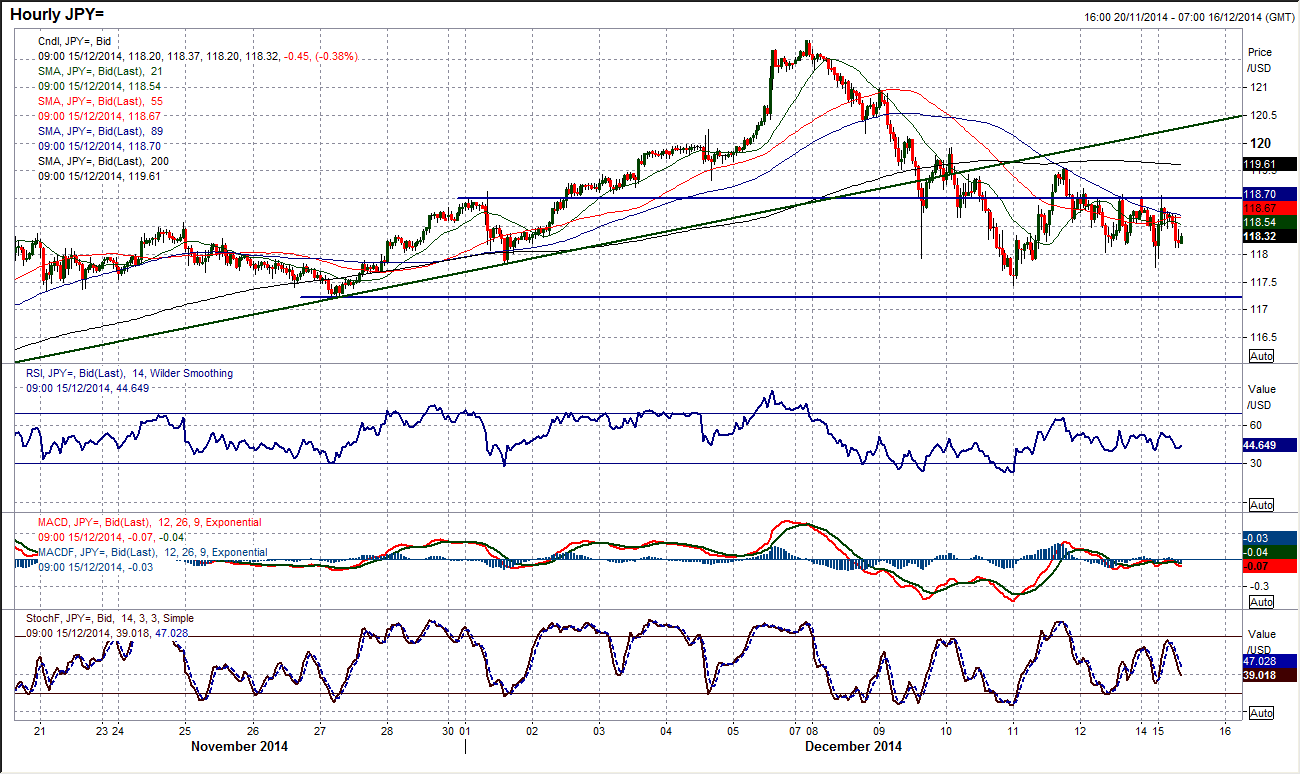
Once more, as with the euro, the strength of the yen has broken a key trendline but not breached a key reaction price level. The 117.22 support is key as this is the first important higher low of the old uptrend (which broke last week). Momentum indicators are now deteriorating near term but, again, could simply be unwinding the bullish configuration. The 117.22 support takes on added importance on Dollar/Yen as it protects what could now be a head and shoulders top, with a breach implying further correction and a likely retracement back towards the 100% Fibonacci projection level again at 113.77. The intraday hourly chart shows that in the past couple of days 119.00 has become a basis of resistance as an element of consolidation has crept in. However, the re-election of Prime Minister Shinzo Abe has done little to improve the outlook so far and the threat of correction continues to loom large. There is a minor element of support at 117.76.
Gold
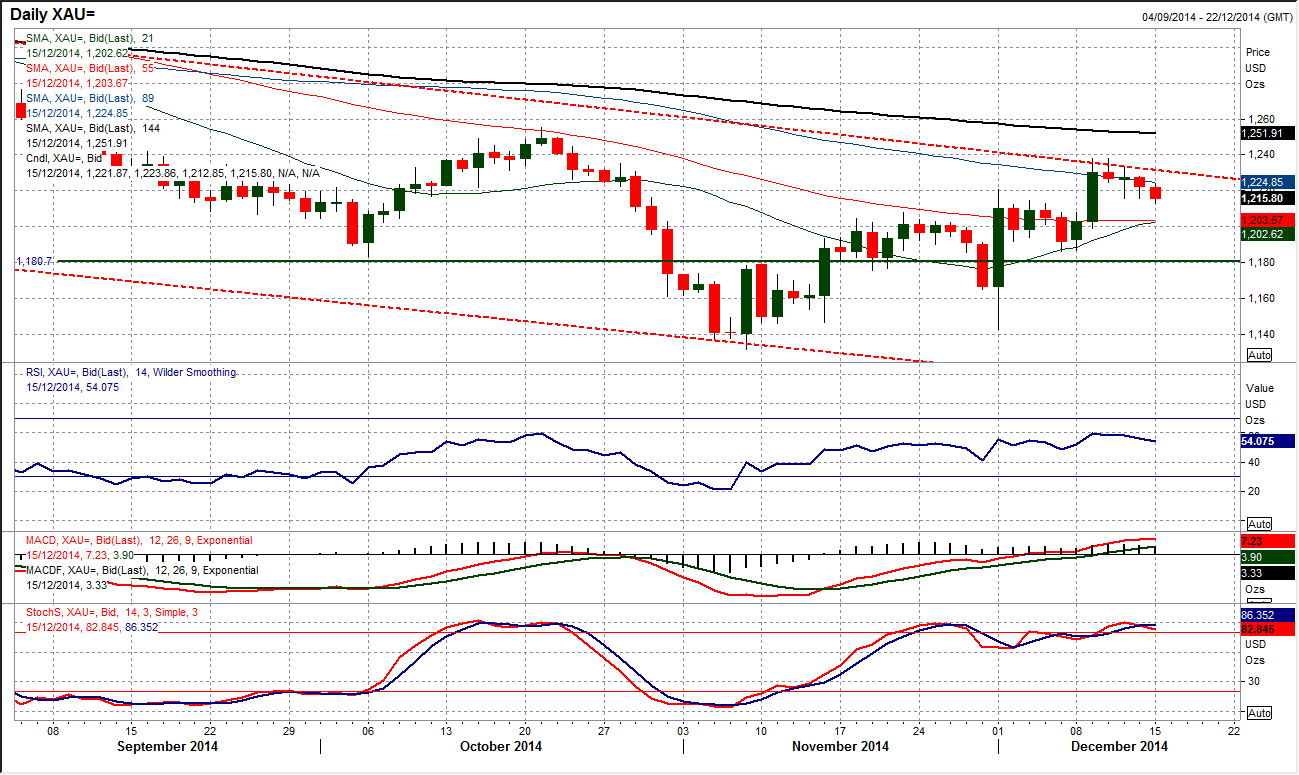
In the past few days there has been a slight drift lower, which is a very similar price reaction to the previous spike higher two weeks ago. However, consolidation is now coming at the resistance of the key downtrend that dates back to 2012. This suggests there are two conflicting time horizons impacting the price now and makes it difficult to call. I am still of the belief that the medium/long term bears are in control until a breach of the key October high at $1255.20 and until that is seen this could be simply a bear market rally. The near term outlook has just hit some consolidation with a drift lower on the intraday hourly chart which shows a hugging of the falling 55 hour moving average now and a reaction high at $1231.30 in place. There is the support of the old breakout levels now being tested, with the psychological $1200 support also back in play, however the near term rebound is still in play until a breach of support at $1186.10.
WTI Oil
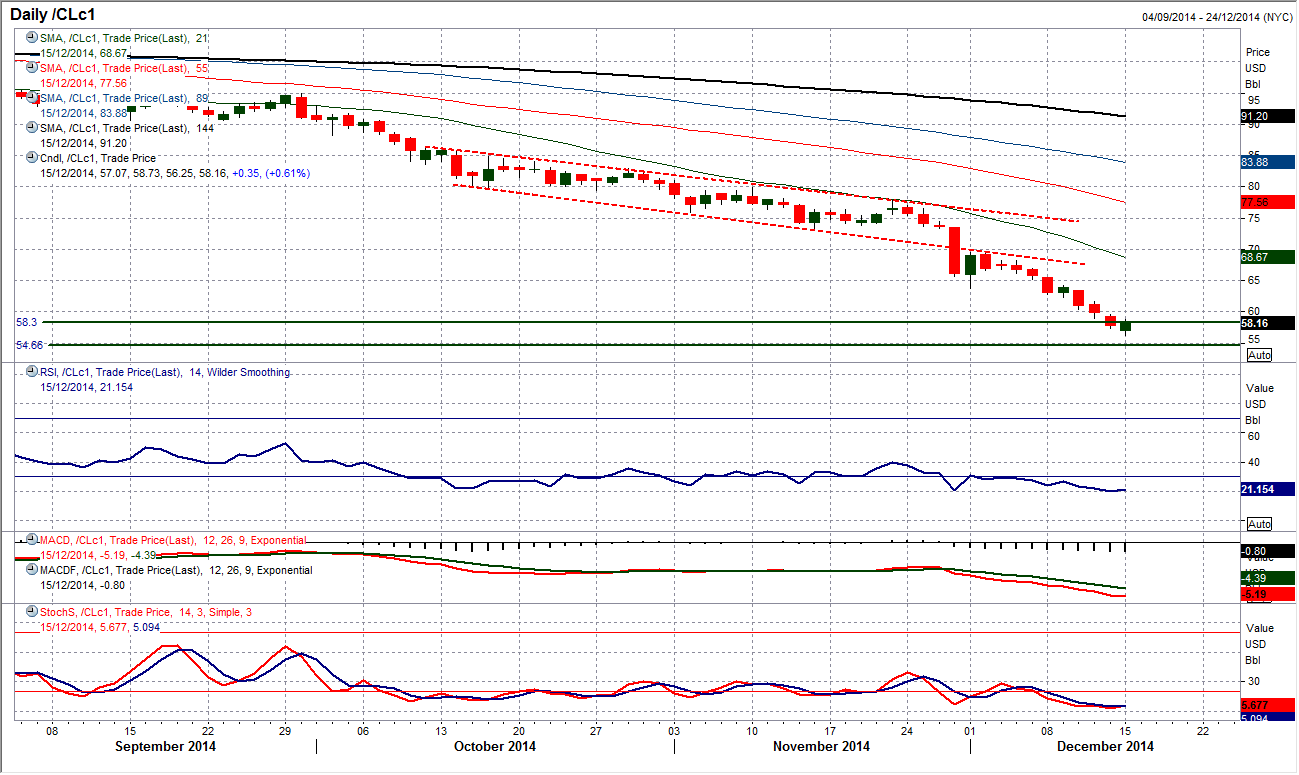
Even though the oil price has made a slight intraday rebound, taking a step back, the outlook for WTI remains awful. The series of bearish candlesticks continues but the RSI has moved to its lowest level since June 2012 (when it bottomed at 16). There is also a feeling that with sentiment so strongly against the oil price it is difficult to see where a low can come in. Support from 2009 is doing little to stop the selling pressure, with $58.30 breached on Friday opening $54.66 and subsequently below there at $50.50. It is unwise to fight trends like these and as the old adage goes, “never try to catch a falling knife”. With 7 successive lower highs and lower lows, use any intraday bounces as a chance to sell. That would suggest that Friday’s high at $59.53 is now the key near term resistance.
Note: All information on this page is subject to change. The use of this website constitutes acceptance of our user agreement. Please read our privacy policy and legal disclaimer. Opinions expressed at FXstreet.com are those of the individual authors and do not necessarily represent the opinion of FXstreet.com or its management. Risk Disclosure: Trading foreign exchange on margin carries a high level of risk, and may not be suitable for all investors. The high degree of leverage can work against you as well as for you. Before deciding to invest in foreign exchange you should carefully consider your investment objectives, level of experience, and risk appetite. The possibility exists that you could sustain a loss of some or all of your initial investment and therefore you should not invest money that you cannot afford to lose. You should be aware of all the risks associated with foreign exchange trading, and seek advice from an independent financial advisor if you have any doubts.
Recommended Content
Editors’ Picks
How will US Dollar react to Q1 GDP data? – LIVE

The US' GDP is forecast to grow at an annual rate of 2.5% in the first quarter of the year. The US Dollar struggles to find demand as investors stay on the sidelines, while waiting to assess the impact of the US economic performance on the Fed rate outlook.
EUR/USD holds gains above 1.0700, as key US data loom

EUR/USD holds gains above 1.0700 in the European session on Thursday. Renewed US Dollar weakness offsets the risk-off market environment, supporting the pair ahead of the key US GDP and PCE inflation data.
GBP/USD extends recovery above 1.2500, awaits US GDP data

GBP/USD is catching a fresh bid wave, rising above 1.2500 in European trading on Thursday. The US Dollar resumes its corrective downside, as traders resort to repositioning ahead of the high-impact US advance GDP data for the first quarter.
Gold price edges higher amid weaker USD and softer risk tone, focus remains on US GDP

Gold price (XAU/USD) attracts some dip-buying in the vicinity of the $2,300 mark on Thursday and for now, seems to have snapped a three-day losing streak, though the upside potential seems limited.
XRP extends its decline, crypto experts comment on Ripple stablecoin and benefits for XRP Ledger

Ripple extends decline to $0.52 on Thursday, wipes out weekly gains. Crypto expert asks Ripple CTO how the stablecoin will benefit the XRP Ledger and native token XRP.
