Market Overview
After four straight days of considerable gains on Wall Street that has already retraced to the 61.8% Fibonacci level of the sell-off, the S&P 500 has undergone a near term correction with a fall of around 0.7%. The minor sell-off was attributed to a reduction in risk appetite amid a terrorist attack in the Canadian capital, however could also have been due to some minor profit-taking too after such a strong run. The overnight news has been that the Chinese HSBC Flash Manufacturing PMI has come in slightly better than expected at 50.4 and above the 50.2 from last month. The Asian markets were mixed to slightly lower overnight with the Nikkei around 0.4% lower. The European indices are taking their cue from Wall Street and have opened the day lower.
In forex trading there is little real movement to speak of, although the Kiwi dollar is under pressure again after New Zealand CPI inflation unexpectedly fell back to 1.0% (1.2% had been expected). This will add pressure on the Reserve Bank of New Zealand which has already turned more dovish in its monetary policy.
There is a fair bit of economic data due today. The flash manufacturing PMIs for the Eurozone are released through the early morning and could drive the euro lower if they show sign of deterioration. The UK retail sales are announced at 09:30BST with a slide to 3.4% (from 4.5% year on year expected. In the US there is weekly jobless claims at 13:30BST which are expected to climb slightly to 281k from last week’s record low of 264k. There is also the US flash manufacturing PMI is due at 14:45BST and is expected to dip slightly to 57.0 (from 57.5).
Chart of the Day – Silver
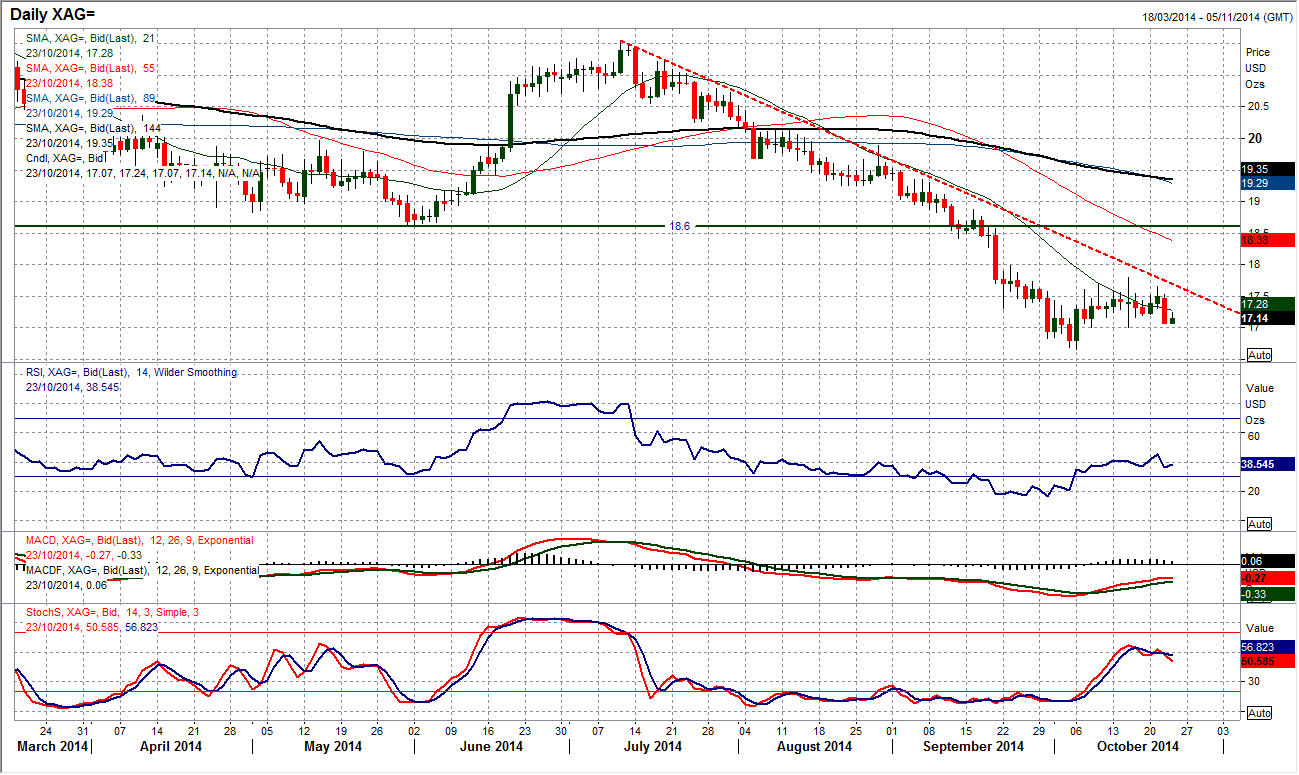
When you consider the rebound that we have seen in gold recently, the performance of silver has been incredibly disappointing. Whilst Gold has recently breached the key resistance of the old June low, silver is still trading over 7% below this resistance. The price remains in the big downtrend since mid-July and is showing little sign of any real buying pressure that would drive a recovery. The price has been stuck in a consolidation for the past three weeks between $17.00/$17.80. The momentum indicators remain in bearish configuration and the RSI has just turned lower from the mid-40s which is an area where bear market rallies have tended to fall over. Interestingly the Bollinger Bands are increasingly tight (a condition that is often seen prior to a strong breakout). The technical indicators suggest that the break will be to the downside. Below $17.00 opens a retest of the key low at $16.66. Above $17.80 would help to breach the downtrend.
EUR/USD
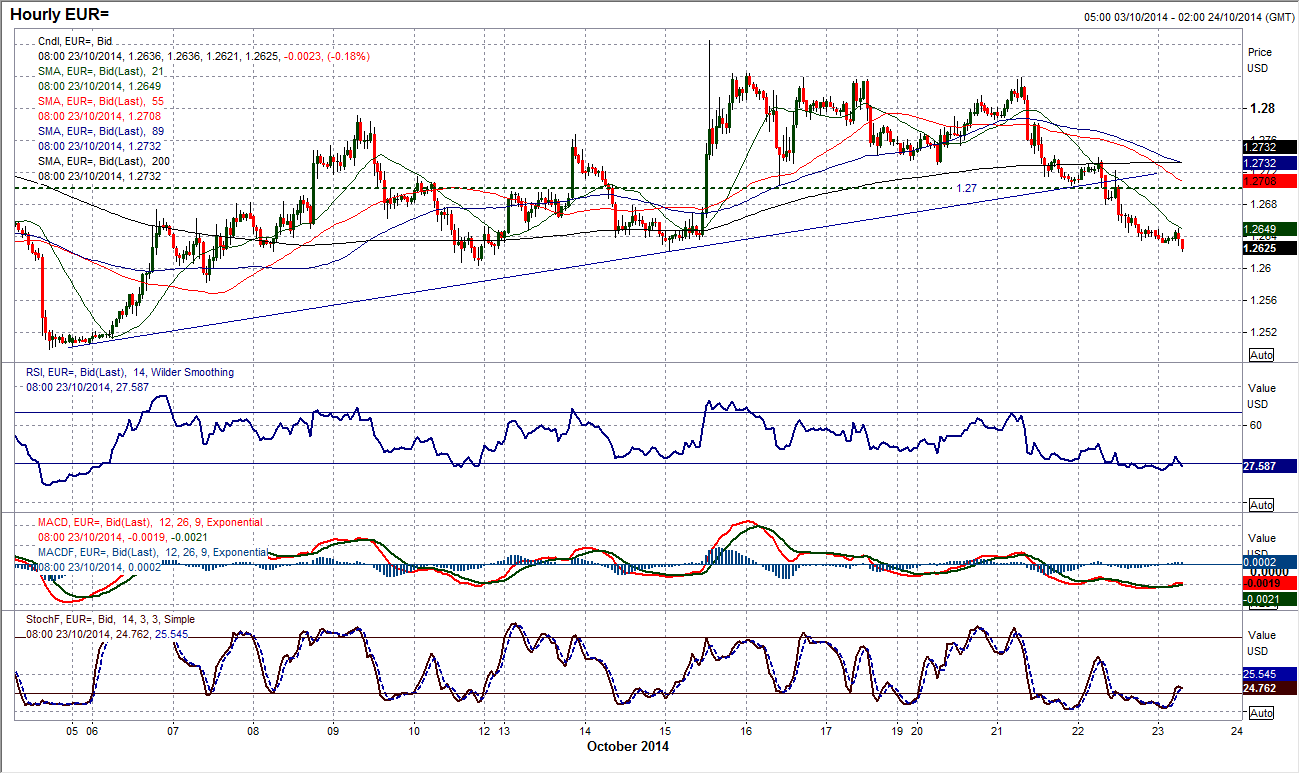
The outlook for the euro is under pressure once more. With the key near term pivot level around $1.2700 being breached yesterday the momentum of the two week recovery has lost impetus. This is confirmed with the Stochastics that are once more in decline, whilst both the RSI and MACD lines have rolled over too. The confirmation of the end os the recovery will now come until the next key support at $1.2604 is breached but this looks set to come under imminent pressure. The intraday hourly chart shows the broken uptrend and also hourly moving averages all in decline and hourly momentum also in weak configuration. The old pivot of $1.2700 becomes the new resistance. The initial support at $1.2623 is doing a job near term but expect any strength to be sold into now. Below $1.2604 opens the recent multi-month low at $1.2500.
GBP/USD
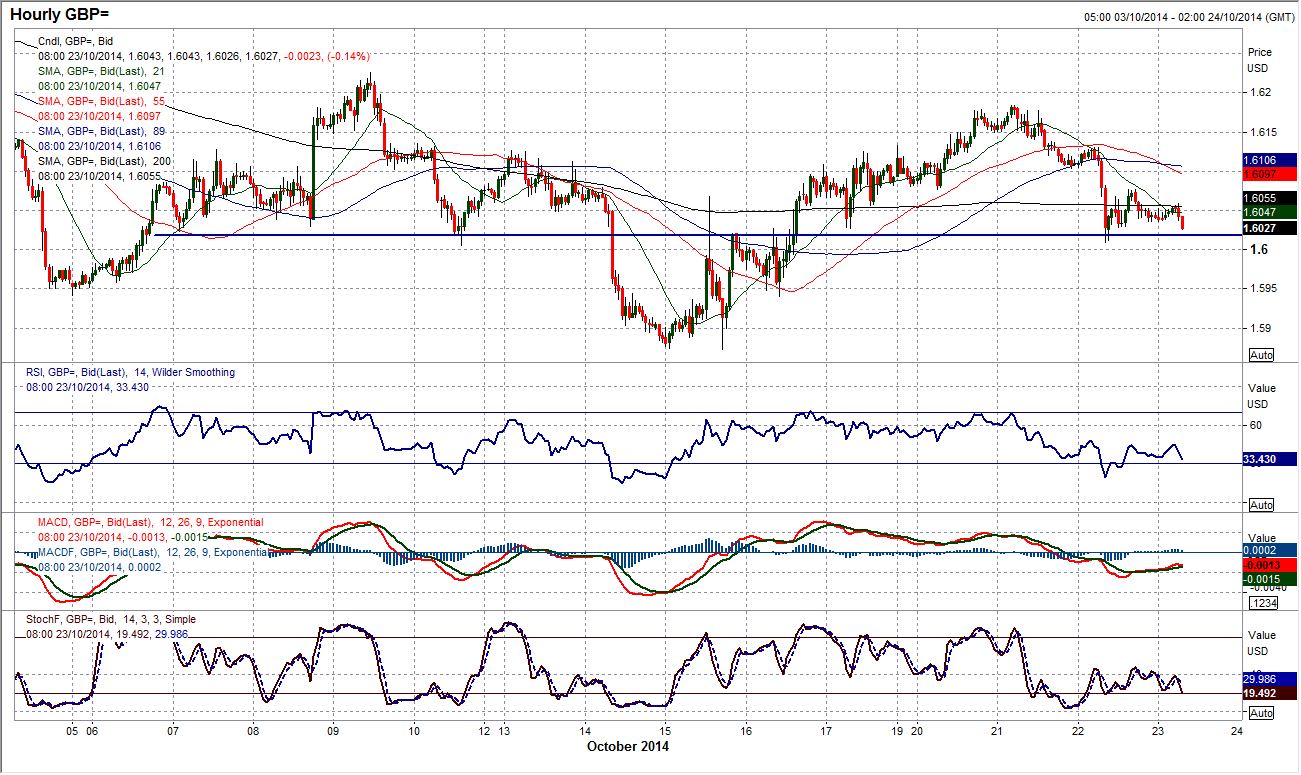
After two strongly negative days the bears look to have resumed control. However they are not having it entirely their own way was the support at $1.6020, which is seen best on the intraday hourly chart, is holding. However, interestingly, the bounce from the support has now started to find resistance around the previous support at $1.6080. This would suggest that rallies are being sold into now and that we can expect further pressure on the $1.6020 support in due course. Furthermore, if there is a breach of the support it would also complete a near term top pattern that would imply a target of the recent low at $1.5874. Looking back on the daily chart this all adds up too with the bears in control and momentum indicators rolling over once more (especially the Stochastics). It would need a move above resistance at $1.6130 to negate the selling pressure.
USD/JPY
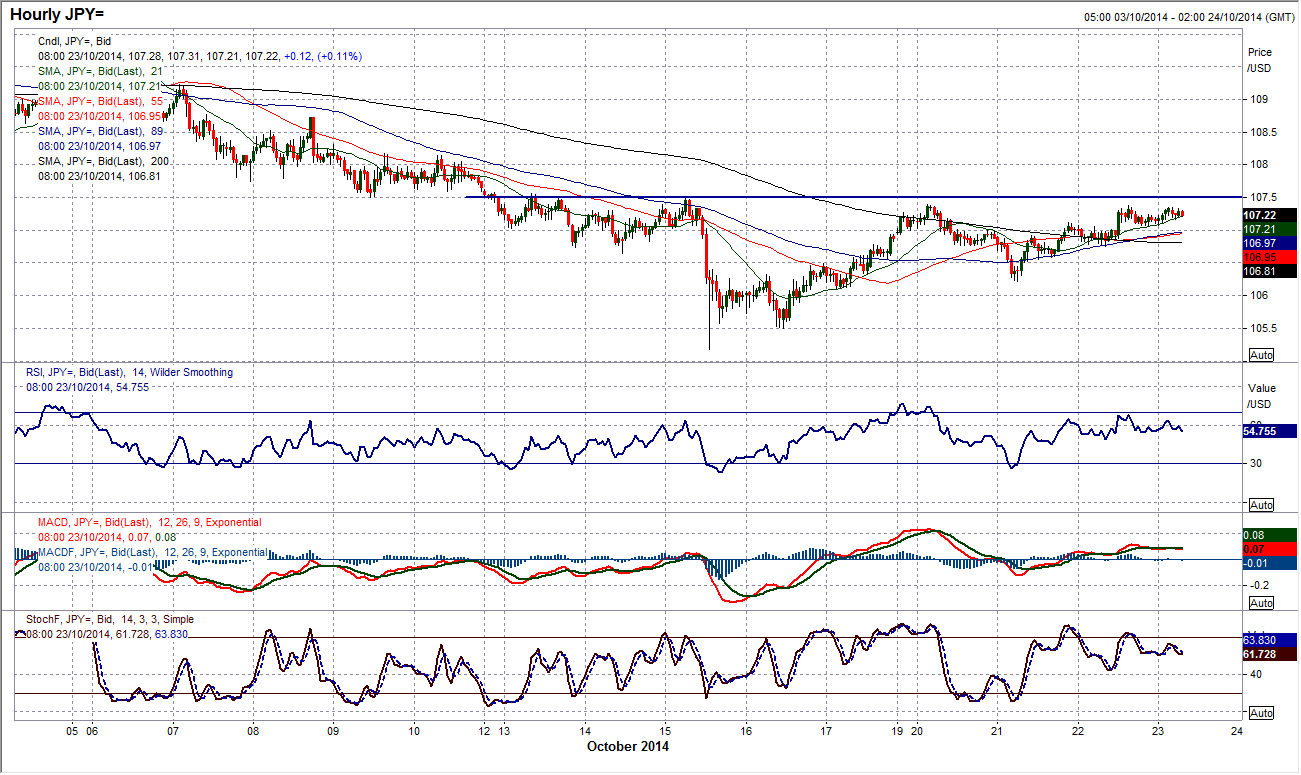
The series of neutral candlestick formations over the past three days reflects the state of uncertainty on Dollar/Yen. This is also shown in the increasingly neutral set of daily momentum studies, with the RSI at 50, MACD lines neutral and Stochastics losing upside momentum. The rate needs to breach the reaction high at 107.50 which is the key near/medium term resistance. A consistent failure to do so will begin to question how strong the dollar bulls actually are. Despite this there is still a slight bull bias to the intraday chart over the past few days with the rate creeping higher, but the key break is yet to be seen. I would like to turn bullish and my expectation is that there will be an upside break, however Dollar/Yen has been pulled back and forth over the past few days and it would not be a good idea to front-run a breakout. For now I wait for confirmation. Initial support is at 106.75 with 106.22 the key near term support.
Gold
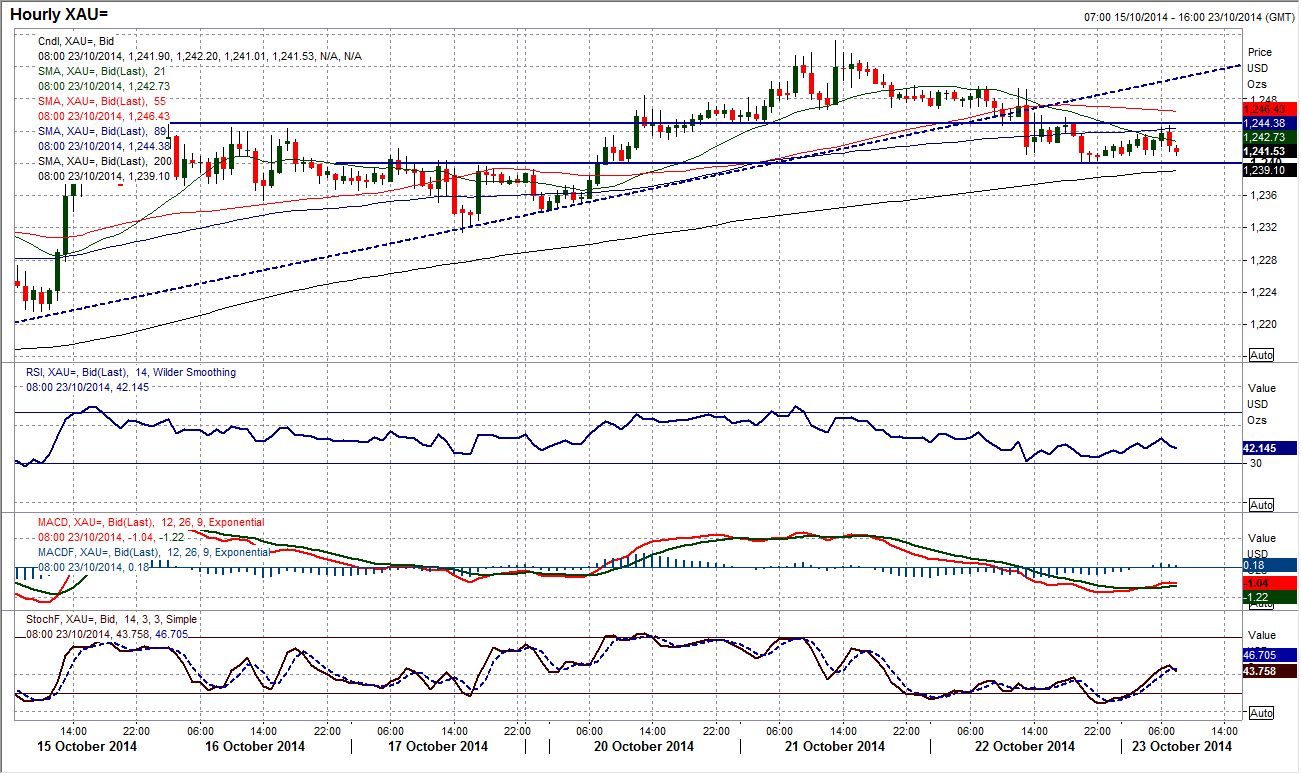
The rally in the gold price may have slowed slightly but the rebound remains on track. Having achieved the closing break above $1240.60 which suggests the medium term bulls are gaining control, yesterday saw the first test of this control. However a correction has come back to close almost bang on the new support and the price looks to be looking to use this as a low. The intraday chart shows that although the uptrend since the $1183.50 low has been breached, this could just be a consolidation back into the support band $1240/$1245 which could prove to be another chance to buy. The intraday hourly momentum indicators have turned up with the bounce off $1240.60 and look ready to pick up again. A move back above $1247 would regain the upside initiative for a retest of the recent high at $1255.20 and on towards $1260/$1280. The medium term positive outlook would remain in force until a breach of the support of the reaction low at $1231.50.
WTI Oil
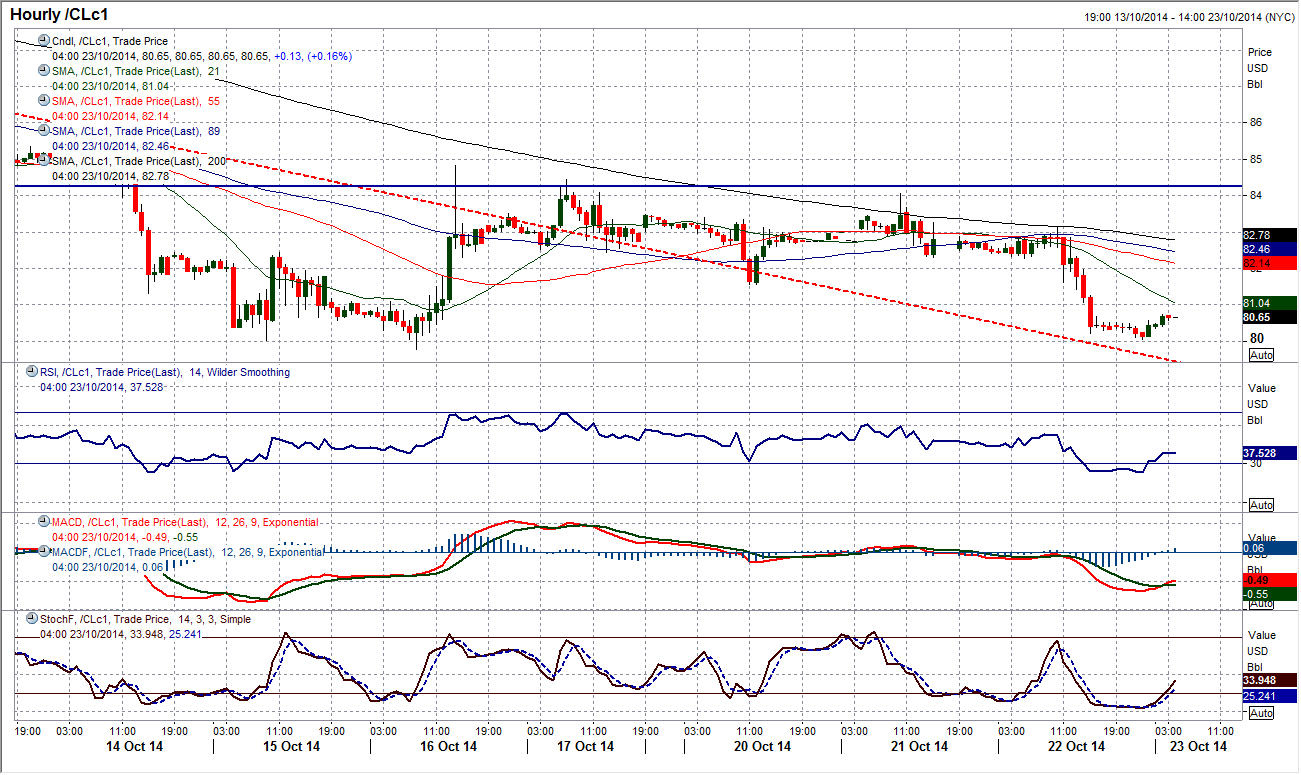
Yesterday afternoon’s sell-off has dealt the prospect of a technical rally a serious blow. However, interestingly, for the third time in the past four days, the upside of the old big three week downtrend is being used as the basis of support. Once more the price is back to $80 which is a key level of support because the one time in this bear phase that $80 has been breached it was done so on a spike with an instant rebound. If WTI begins to consistently trade sub $80 over a number of hours this would suggest a level of acceptance of the break and open further downside, with the daily chart showing the next key support at $7.28. However, for now the support is holding, as hourly momentum begins to improve again. Near term resistance comes in at $81.56 and around $83. Today could be pivotal for the prospects of the oil price.
Note: All information on this page is subject to change. The use of this website constitutes acceptance of our user agreement. Please read our privacy policy and legal disclaimer. Opinions expressed at FXstreet.com are those of the individual authors and do not necessarily represent the opinion of FXstreet.com or its management. Risk Disclosure: Trading foreign exchange on margin carries a high level of risk, and may not be suitable for all investors. The high degree of leverage can work against you as well as for you. Before deciding to invest in foreign exchange you should carefully consider your investment objectives, level of experience, and risk appetite. The possibility exists that you could sustain a loss of some or all of your initial investment and therefore you should not invest money that you cannot afford to lose. You should be aware of all the risks associated with foreign exchange trading, and seek advice from an independent financial advisor if you have any doubts.
Recommended Content
Editors’ Picks
EUR/USD clings to gains near 1.0700, awaits key US data

EUR/USD clings to gains near the 1.0700 level in early Europe on Thursday. Renewed US Dollar weakness offsets the risk-off market environment, supporting the pair ahead of the key US GDP and PCE inflation data.
USD/JPY keeps pushing higher, eyes 156.00 ahead of US GDP data

USD/JPY keeps breaking into its highest chart territory since June of 1990 early Thursday, recapturing 155.50 for the first time in 34 years as the Japanese Yen remains vulnerable, despite looming intervention risks. The focus shifts to Thursday's US GDP report and the BoJ decision on Friday.
Gold closes below key $2,318 support, US GDP holds the key

Gold price is breathing a sigh of relief early Thursday after testing offers near $2,315 once again. Broad risk-aversion seems to be helping Gold find a floor, as traders refrain from placing any fresh directional bets on the bright metal ahead of the preliminary reading of the US first-quarter GDP due later on Thursday.
Injective price weakness persists despite over 5.9 million INJ tokens burned

Injective price is trading with a bearish bias, stuck in the lower section of the market range. The bearish outlook abounds despite the network's deflationary efforts to pump the price.
Meta takes a guidance slide amidst the battle between yields and earnings

Meta's disappointing outlook cast doubt on whether the market's enthusiasm for artificial intelligence. Investors now brace for significant macroeconomic challenges ahead, particularly with the release of first-quarter GDP data.
