Market Overview
Whether it was a bit of end of month/end of quarter window dressing, the early gains on Wall Street were lost into the close, leaving the S&P 500 down 0.3% on little newsflow. With the pro-democracy protests in Hong Kong reaching a fifth day this is also beginning to drain on sentiment. Although the official Chinese manufacturing PMI reading held flat from last month’s 51.1 this could not prevent a slide in the Nikkei 225 of 0.5%. The weak performance is also filtering into the European session which is also trading lower in early exchanges.
In forex trading, the dollar is once more making gains against all the major currencies with the exception of the Swiss franc. Notably, the Aussie and Kiwi dollars are again coming under significant pressure after disappointing Australian retail sales.
Traders will be looking towards the raft of manufacturing PMI data from all over Europe and the US today. The European releases are through the early morning culminating in the Eurozone data at 09:00BST which is expected to remain flat at 50.0. The UK’s manufacturing PMI at 09:30BST and expectation is for a slight improvement to 52.7 (from 52.5) which might then help to support Cable. Into the US session the initial focus will be on the ADP employment report at 13:15BST which is expected to remain around flat at 205,000 (was 204,000 last month). However, the main event will be the ISM manufacturing PMI at 15:00BST which is expected to just fall slightly to 58.5 (form 59.0 last month).
Chart of the Day – EUR/JPY
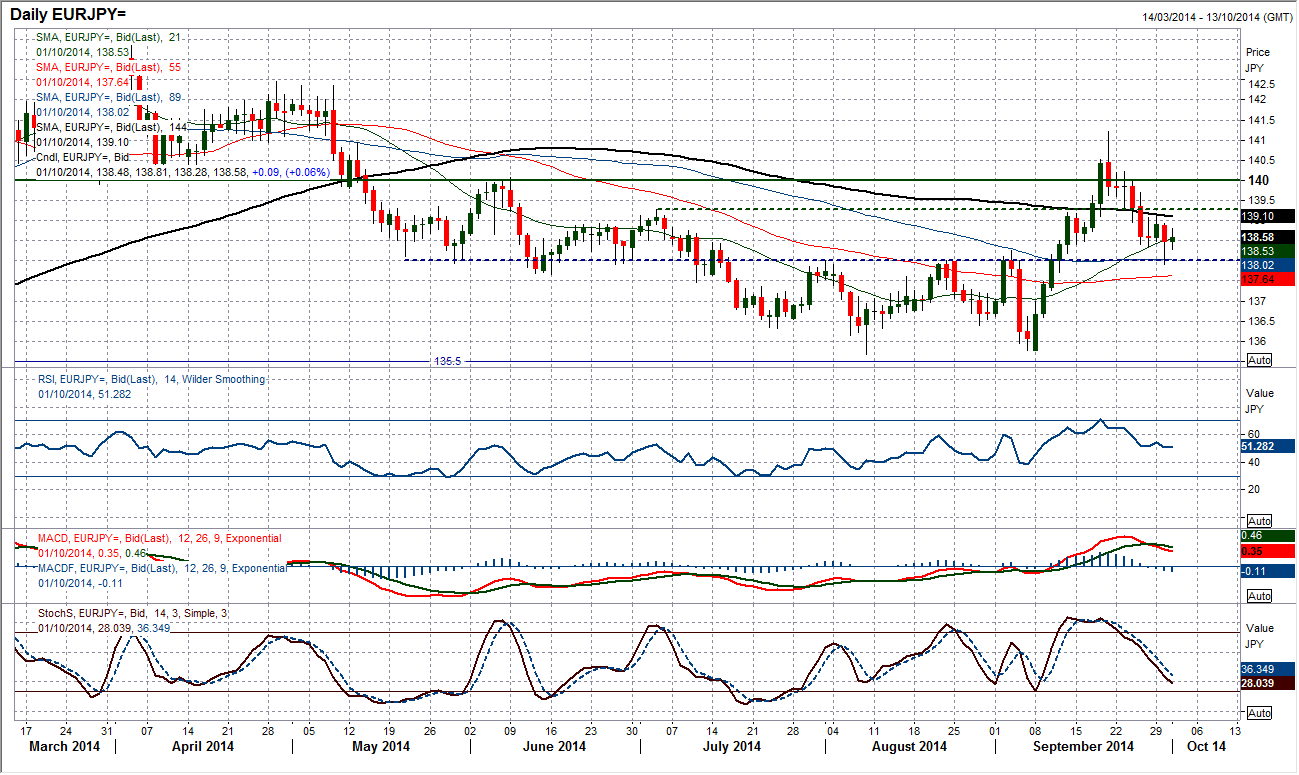
I focused on Euro/Yen last week talking about the rate topping out and suggesting a reversal back towards the key 138.00 breakout support, and this is exactly what was seen yesterday. However the support has initially held, however it could come under further scrutiny over the coming days. The outlook for the chart is now neutral with longer term moving averages basically flat and downtrends having been broken. The support at 138.00 is now key as a consistent move below will suggest that the key low around 135.50 could be tested again. The concern is that the momentum indicators are in reverse with the MACD lines having recently given a bearish crossover which suggests the downside pressure is beginning to mount. The intraday chart shows that old support has turned new resistance around 139.00 and with a recent sequence of lower highs the key support around 138.00 could be tested again.
EUR/USD
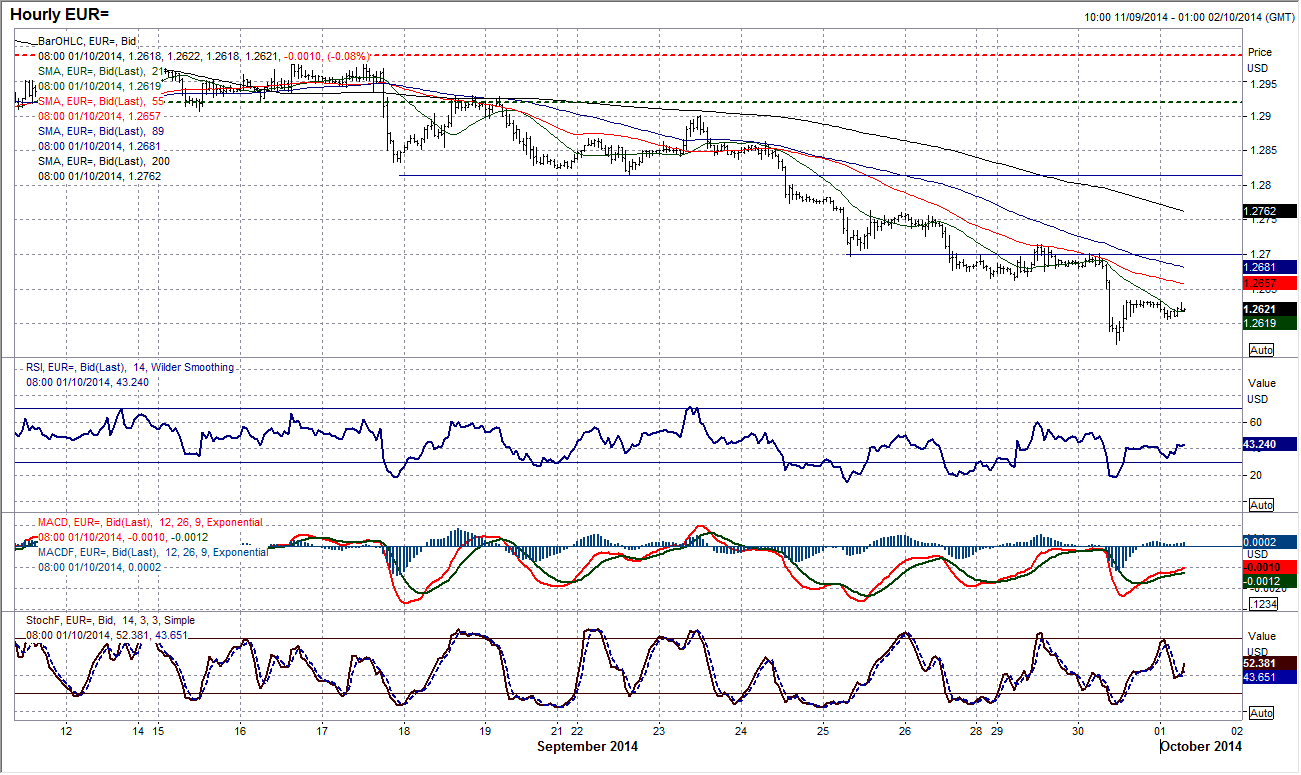
The selling the euro has just seemingly become an incredible one-way bet and as things stand this move is showing little signs of reversing. It does make writing a new comment every day a difficult task, but such is the force of the bearish pressure that the euro continues to dive. That is now five straight days of lower highs and lower lows on the daily ranges, whilst momentum indicators have just become firmly entrenched in negative configuration. I have spoken at length about the intraday chart showing consolidations followed by the next sell-off and once more that is what was seen yesterday. The initial resistance comes now at $1.2660 which was not only an intraday support from two days ago but also the key November 2012 low. With no key old reaction lows really to speak of until $1.2040 the next minor support comes in at $1.2500. Tier 1 economic data could provide us with some volatility, but selling into the rallies remains the strategy.
GBP/USD
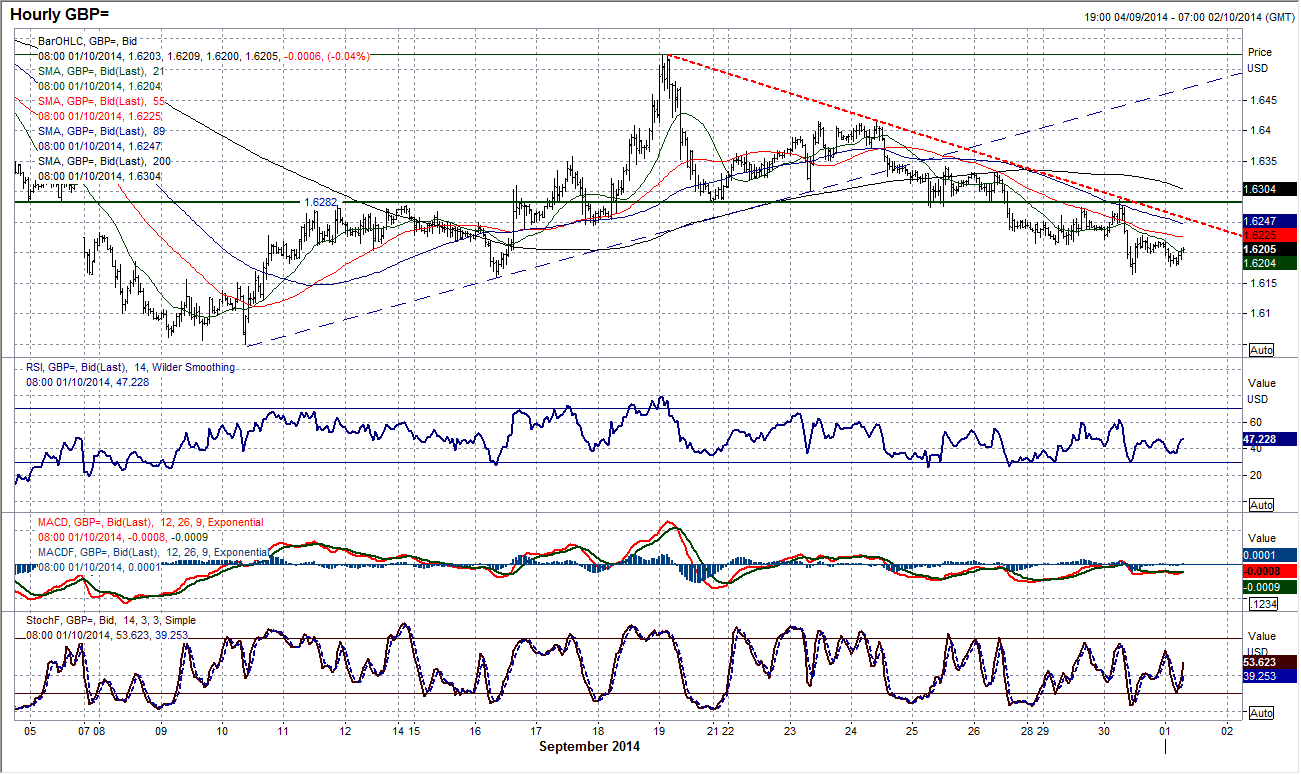
It would appear as though the sellers are beginning to really put the pressure one. Although an initial test of the key reaction low at $1.6160 survived yesterday, the bearish pressure of a new downtrend on the hourly intraday chart suggests a further test of $1.6160 again today. The intraday chart also shows that the old support has become the immediate resistance band $1.6215/30, whilst the key near term resistance remains the old support around $1.6280. The daily momentum indicators are all now back into deterioration mode and if the support at $1.6160 gives way there could be a quick retracement back to the key low at $1.6050.
USD/JPY
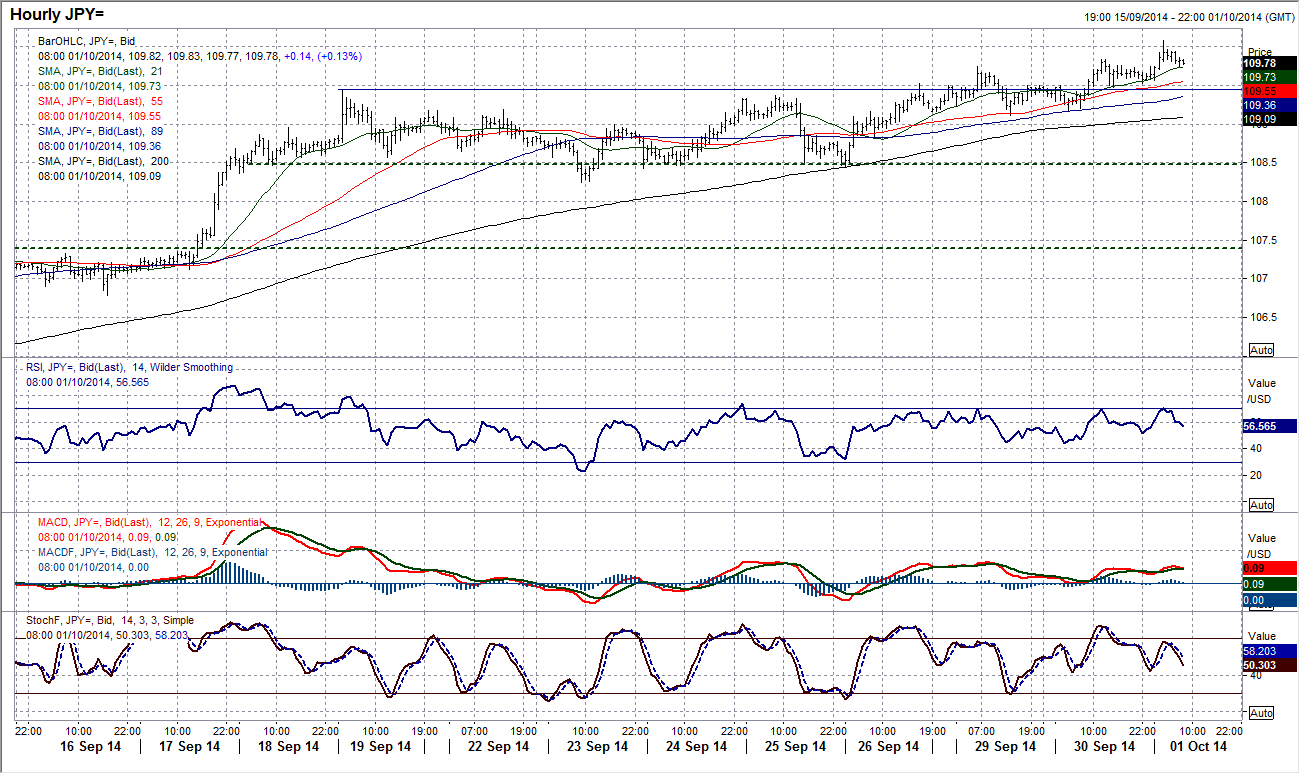
Following the break higher from the consolidation band, it would appear as though the bulls are back in control for the test of 110.65 once more. The suggestions early yesterday that the bulls were beginning to run out of steam seem to have been put to bed as overnight the rate has hit above 110 for the first time since August 2008. Momentum indicators remain positive and the way is open for further upside. The intraday hourly chart shows positive momentum indicators, whilst the old breakout at 109.45 has provided the basis of support overnight, with further support coming at 109.10. With any signs of a near term correction extinguished, expect further gains in due course.
Gold
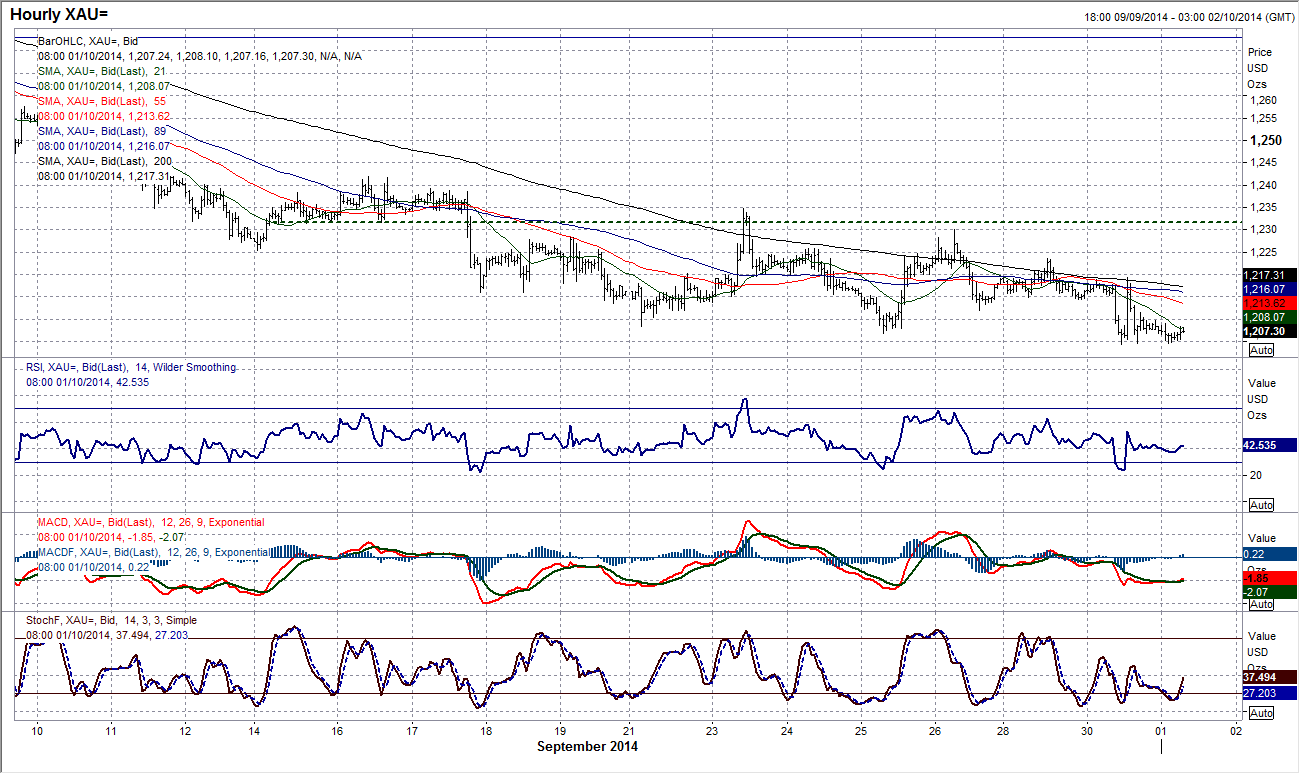
With the decline now running into a fourth straight day the $1200 mark is within sniffing distance. However, taking a medium/longer term view, $1200 is an obvious test, with the key December low at $1184.50 now almost equally as likely. Momentum indicators are deeply bearish and have recently turned lower again to reflect the weakness of the past few days. The opportunities to sell seem to be merely intraday rebounds now as the sellers remain in control. Yesterday’s spike higher (on reports that Russia was ready to impose capital controls, reports that were subsequently denied) has left a lower high at $1219.46, which was below the $1223.50 previous high, whilst the daily chart also shows the lower highs posted over the past two weeks providing resistance at $1230 and $1234.80. There is subsequently plenty of overhead supply to prevent any technical buying from gaining any momentum. Continue to sell into a rebound for further downside.
WTI Oil
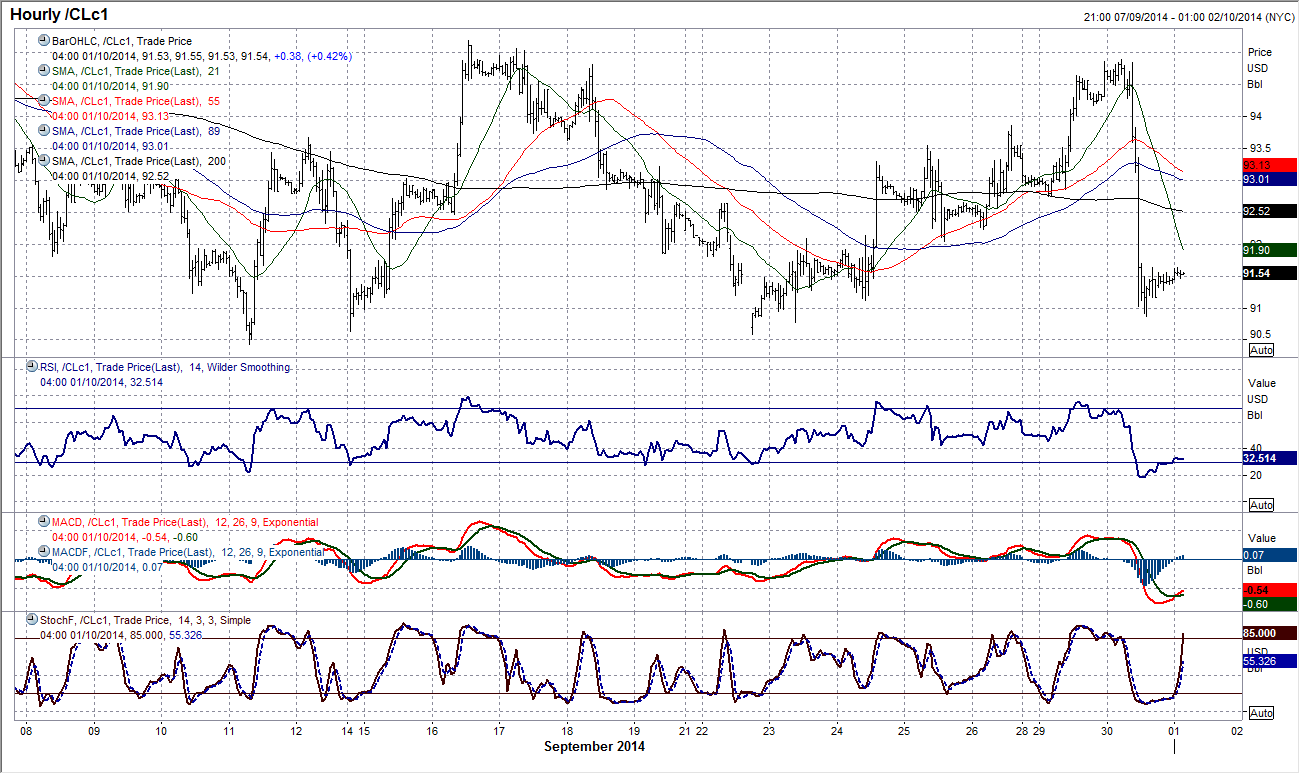
Yesterday’s sharp decline which saw WTI oil fall by over $4 at one stage, has seen the prospect of a recovery completely blown out of the water again. I said yesterday that this was a key moment for WTI oil and if it failed under the resistance at $95.19 then the outlook would simply continue down the lines of selling into strength. With a reversal at $94.90, the intraday hourly chart shows that the sequence of higher lows over the past week has been broken following the break below Monday’s low at $92.75 and the subsequent next low at $92.05. This suggests that the sellers have once more gained control and downside to retest the recent September lows at $90.58 and $90.43 can be expected. The problem is that with momentum indicators having unwound oversold momentum to renew downside potential, the sellers have the bit between their teeth. If there is a breach of $90.43 and subsequently the psychological $90 support, there is little support until the 2012 low at $85.61. Selling into strength continues to be the best way to play WTI. Initial intraday resistance at $92.05.
Note: All information on this page is subject to change. The use of this website constitutes acceptance of our user agreement. Please read our privacy policy and legal disclaimer. Opinions expressed at FXstreet.com are those of the individual authors and do not necessarily represent the opinion of FXstreet.com or its management. Risk Disclosure: Trading foreign exchange on margin carries a high level of risk, and may not be suitable for all investors. The high degree of leverage can work against you as well as for you. Before deciding to invest in foreign exchange you should carefully consider your investment objectives, level of experience, and risk appetite. The possibility exists that you could sustain a loss of some or all of your initial investment and therefore you should not invest money that you cannot afford to lose. You should be aware of all the risks associated with foreign exchange trading, and seek advice from an independent financial advisor if you have any doubts.
Recommended Content
Editors’ Picks
AUD/USD failed just ahead of the 200-day SMA

Finally, AUD/USD managed to break above the 0.6500 barrier on Wednesday, extending the weekly recovery, although its advance faltered just ahead of the 0.6530 region, where the key 200-day SMA sits.
EUR/USD met some decent resistance above 1.0700

EUR/USD remained unable to gather extra upside traction and surpass the 1.0700 hurdle in a convincing fashion on Wednesday, instead giving away part of the weekly gains against the backdrop of a decent bounce in the Dollar.
Gold keeps consolidating ahead of US first-tier figures

Gold finds it difficult to stage a rebound midweek following Monday's sharp decline but manages to hold above $2,300. The benchmark 10-year US Treasury bond yield stays in the green above 4.6% after US data, not allowing the pair to turn north.
Bitcoin price could be primed for correction as bearish activity grows near $66K area

Bitcoin (BTC) price managed to maintain a northbound trajectory after the April 20 halving, despite bold assertions by analysts that the event would be a “sell the news” situation. However, after four days of strength, the tables could be turning as a dark cloud now hovers above BTC price.
Bank of Japan's predicament: The BOJ is trapped

In this special edition of TradeGATEHub Live Trading, we're joined by guest speaker Tavi @TaviCosta, who shares his insights on the Bank of Japan's current predicament, stating, 'The BOJ is Trapped.'
