Market Overview
Investors appear to be cautious as we begin a trading day that has a range of driving factors. Firstly, investors must ascertain the potential impact of further sanctions on Russia. Then, add into the mix the next batch of data which will show how the economic malaise in the Eurozone is developing. Furthermore, with volumes light (exacerbated by the US being on Labor Day public holiday) this means that there could be some price spikes. Wall Street closed positively on Friday and this outlook has remained through a mildly positive Asian session. The Chinese PMI data was slightly disappointing with a small miss of expectations as the official data fell to 51.1 (51.2 expected) with the HSBC PMI falling to a 3 month low at 50.2. European markets are mixed to slightly lower in early trading.
Quite how investors will be viewing the events over the weekend regarding comments by Russian President Putin will be difficult to gauge. Apparent evidence is mounting of Russian involvement in the pro-separatist movement in eastern Ukraine, whilst Putin has talked about negotiations over “statehood”, which were later denied by his spokesperson. However the EU summit over the weekend also discussed the imposition of further sanctions too. So do investors flee into safe haven assets once more? Not yet, if the early moves are anything to go by. However this is another day where staying close to news flow would be advisable.
In forex trading, the dollar is under a little bit of pressure, with sterling showing strength, as are the dollars of Canada, Australia and New Zealand. The raft of PMI data out today (not including the US which is tomorrow due to Labor Day) includes the Eurozone numbers which are released throughout the early morning, whilst the UK manufacturing PMI is at 09:30BST and is expected to show a slight slide to 55.1 (from 55.4).
Chart of the Day – Silver
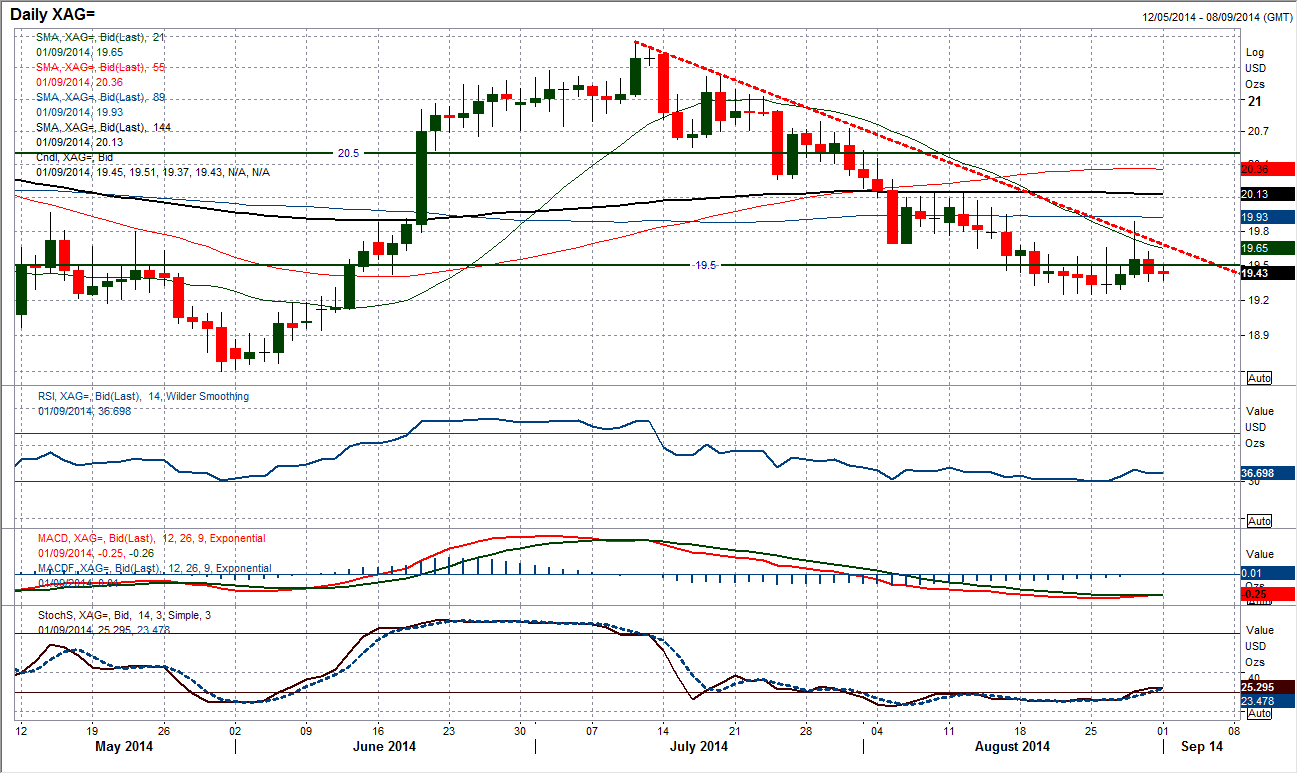
The price has been trending lower for the past 7 weeks as intermittent periods of consolidation have all ended with the next leg lower. Last week there was a spike higher that threatened to abort this trend, but a sequence of lower highs and lower lows was never really even threatened and it seems as though the price is preparing for the next leg lower again. The intraday hourly chart shows a band of resistance $19.50/$19.70 which is now being seen as a chance to sell. The hourly momentum indicators are a bit of a mixed bag but are still a net drag lower on the price. Expect further pressure on the $19.25 recent lows as the downtrend continues to pull the price towards testing the key May lows at $18.60.
EUR/USD
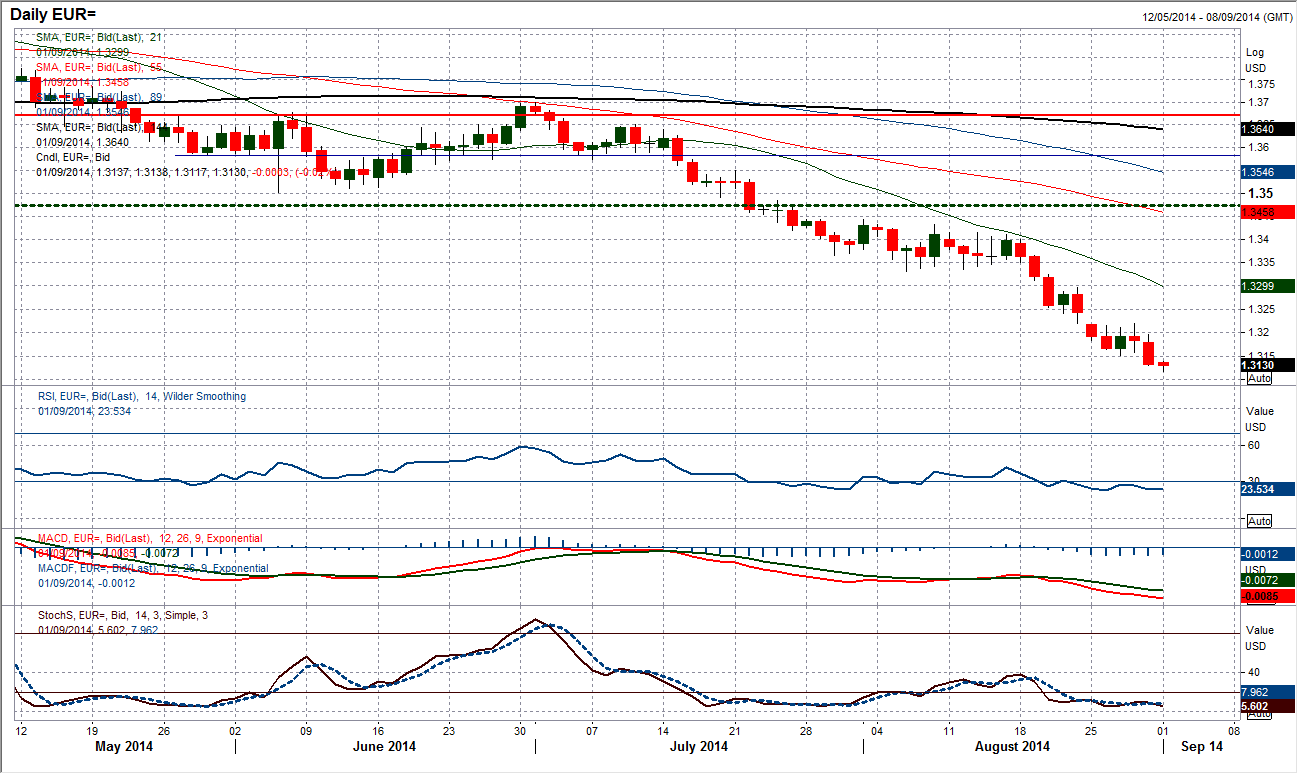
It seems to be the same old story for the euro as we move into a new week. A consolidation that had been building through the end of last week simply once again broke to the downside and the euro has continued its path towards the key September 2013 low at $1.3103, ultimately on its way towards $1.3000. There is little or no technical sign of any impending rally, with all momentum indicators still incredibly weak. On the intraday hourly chart, the minor support that had been building at $1.3160 now becomes the new resistance. The selling pressure is not precipitous and there do tend to be intraday rebounds of maybe 30 to 40 pips that can be used as a chance to sell. The resistance built up at $1.3220 remains the key near term barrier for a recovery.
GBP/USD
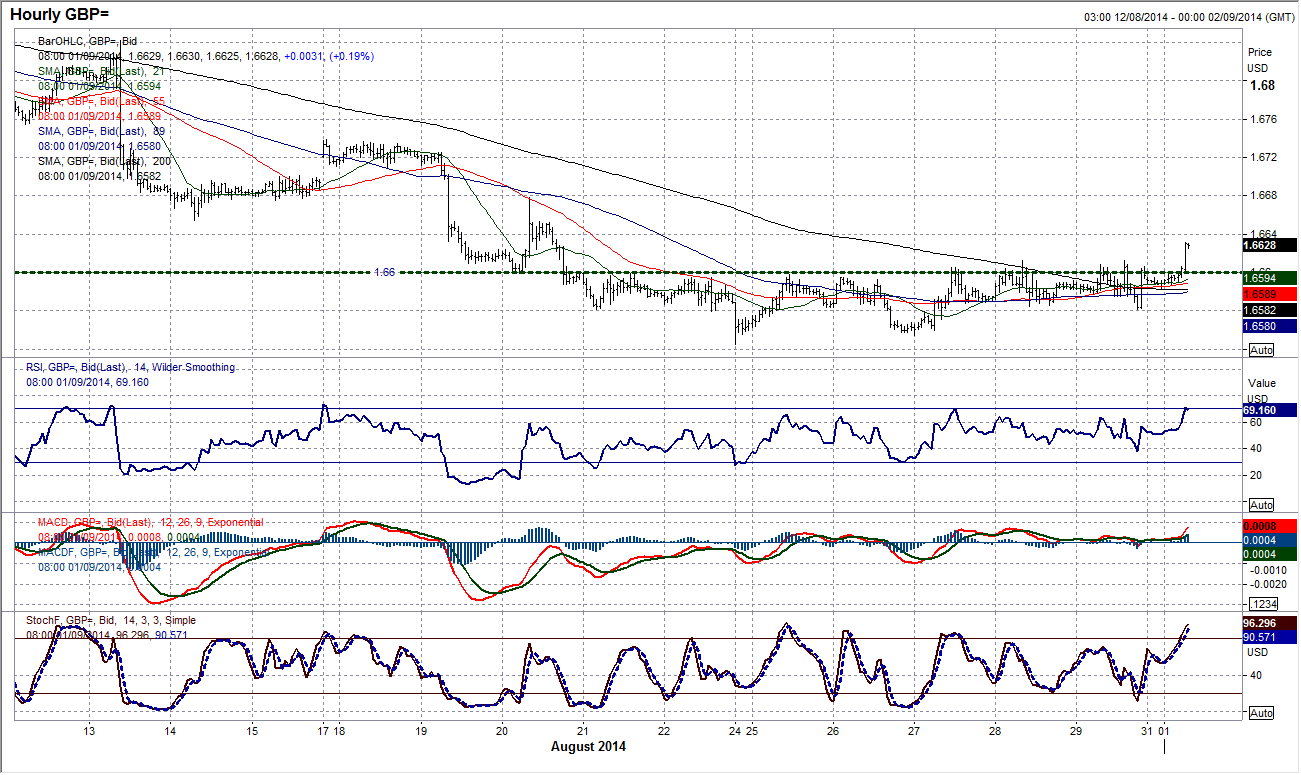
Whilst there has been a continued sell-off on the euro, this has not been the case with sterling. Cable shows an interesting tussle that has developed between the bulls and the bears, with the battle line drawn at the $1.6600 resistance. This resistance has broadly been what has been holding the bulls at bay now for the past 8 days. To add extra spice, the resistance of the 7 week downtrend is at $1.6625 and is starting to come under serious scrutiny. Furthermore, we have also seen three positive days in a row at the end of last week, something which has not been seen on Cable since early July and before the downtrend began. The intraday hourly chart shows the resistance very well and a confirmed move above $1.6600 would complete a base pattern and imply $1.6675 initially. The prospects of a near term recovery are improving and with the downtrend fast approaching, the next couple of days will be very important as failure now would suggest a retest of the $1.6525 low.
USD/JPY
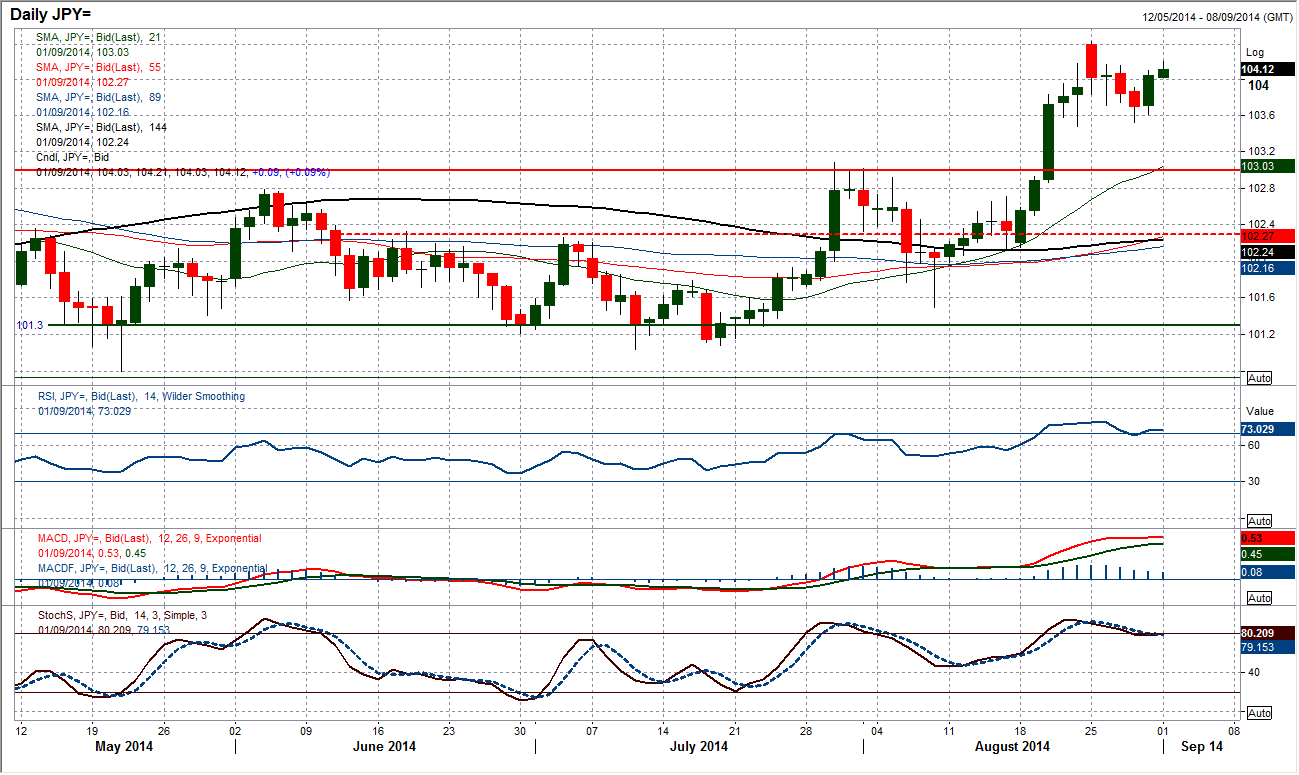
I have written often about the near term importance of the support around 103.50 and the prospect of a key low being left. Well it seems as though this was a level the bulls were looking at as well, because once more Dollar/Yen has picked up and started to move higher, leaving a low at 103.53. The move is back above 104.00 again and looks to be gathering momentum for a retest of the recent rally high at 104.43. Momentum indicators remain strong and the outlook looks good for a retest of the high. Above 104.43 would re-open the levels last seen in December and January around 105.00. The intraday hourly chart shows a pivot level has formed around 103.80 which the bulls will be keen to now maintain support above and therefore protect the support that is building up around 103.50. The positive outlook would change on a break below 103.50.
Gold
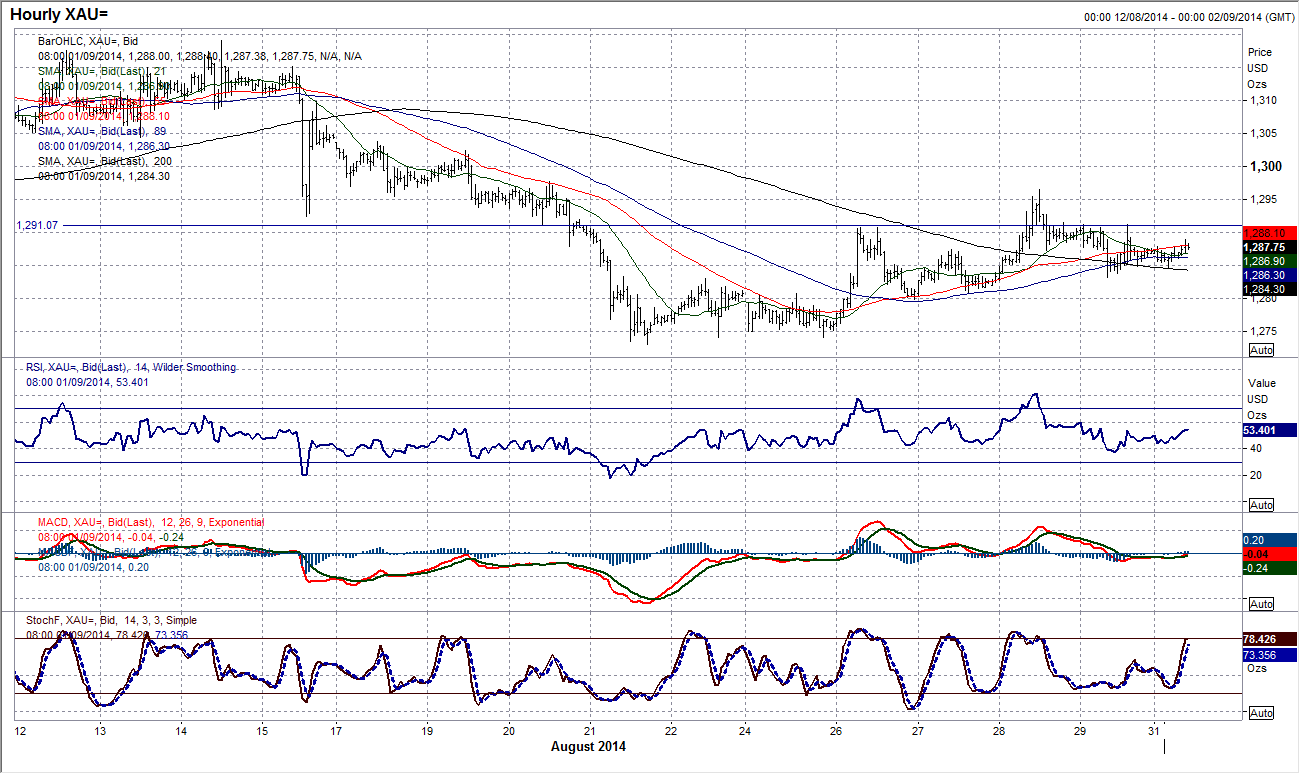
I still maintain the view that this chart is in the process of building for another lower high. It is possible that the next lower high has already been formed at $1296.50, but with the exogenous factors that impact on the gold chart (i.e. geopolitical risk) I would remain cautious. Technical factors alone suggest there could be a rally into the band $1300/$1310 still before the medium to longer term negative forces begin to drag the price lower again to retest the recent low at $1273. The intraday hourly chart shows higher lows being left over the past few days and the latest is at $1283.16, which the recovery bulls will be keen to hold on to now. The big caveat to the whole outlook is the geopolitical risk and “war premium” that the conflict in eastern Ukraine adds. A perceived flare up today (quite possible) could result in a sizeable jump (although the spikes have become far less severe in recent weeks). It would need a breach of $1322.60 to change the outlook though.
Note: All information on this page is subject to change. The use of this website constitutes acceptance of our user agreement. Please read our privacy policy and legal disclaimer. Opinions expressed at FXstreet.com are those of the individual authors and do not necessarily represent the opinion of FXstreet.com or its management. Risk Disclosure: Trading foreign exchange on margin carries a high level of risk, and may not be suitable for all investors. The high degree of leverage can work against you as well as for you. Before deciding to invest in foreign exchange you should carefully consider your investment objectives, level of experience, and risk appetite. The possibility exists that you could sustain a loss of some or all of your initial investment and therefore you should not invest money that you cannot afford to lose. You should be aware of all the risks associated with foreign exchange trading, and seek advice from an independent financial advisor if you have any doubts.
Recommended Content
Editors’ Picks
AUD/USD remained bid above 0.6500

AUD/USD extended further its bullish performance, advancing for the fourth session in a row on Thursday, although a sustainable breakout of the key 200-day SMA at 0.6526 still remain elusive.
EUR/USD faces a minor resistance near at 1.0750

EUR/USD quickly left behind Wednesday’s small downtick and resumed its uptrend north of 1.0700 the figure, always on the back of the persistent sell-off in the US Dollar ahead of key PCE data on Friday.
Gold holds around $2,330 after dismal US data

Gold fell below $2,320 in the early American session as US yields shot higher after the data showed a significant increase in the US GDP price deflator in Q1. With safe-haven flows dominating the markets, however, XAU/USD reversed its direction and rose above $2,340.
Bitcoin price continues to get rejected from $65K resistance as SEC delays decision on spot BTC ETF options

Bitcoin (BTC) price has markets in disarray, provoking a broader market crash as it slumped to the $62,000 range on Thursday. Meanwhile, reverberations from spot BTC exchange-traded funds (ETFs) continue to influence the market.
US economy: slower growth with stronger inflation

The dollar strengthened, and stocks fell after statistical data from the US. The focus was on the preliminary estimate of GDP for the first quarter. Annualised quarterly growth came in at just 1.6%, down from the 2.5% and 3.4% previously forecast.
