Market Overview
There was no one single factor at play behind yesterday’s equity markets sell-off. Concerns over the impact that geopolitics with Russia will have on corporate earnings, a Eurozone inflation slowdown, Argentina going into selective default and an increase in the US Employment Cost Index, all had a part to play in a flight out of equities. Wall Street had a terrible day. The S&P 500 fell the most since early April, whilst the Dow Jones Industrial Average shed over 300 points and is now negative for the year. A spike higher in the VIX Index from 13.33 to 16.95 is now at the highest since April and suggests that traders are now jumping into options to protect themselves from downside risk.
With this all in mind, Asian markets have been fairly calm with a lack of precipitous selling pressure and that has been helped by the announcement of the Chinese Manufacturing PMI data. The official government reading improved from the flash reading of 51.0 up to 51.7 (and was above expectations of 51.4) which suggests that the government mini-stimulus measures are having the desired effect. Also, despite slightly missed expectations, the HSBC PMI at 51.7 was confirmed at an 18 month high. This could be a stabilising factor during the early European trading. Despite the sell-off late into the US close, European markets are trading only slightly weaker early on. Markets tend to settle throughout the morning in front of Non-farm Payrolls too.
Forex trading continues to show a dollar bias today, albeit rather a tepid strength. Traders will be focusing on a raft of data throughout the day. The Eurozone PMIs are announced through the morning, whilst the UK manufacturing PMI is at 09:30BST and is expected to drift slightly off to 57.2 (from 57.5). The US ISM Manufacturing PMI is at 15:00BST and is expected to improve slightly from 55.3 to 56.0.
However, undoubtedly the event of the day is Non-farm Payrolls at 13:30BST. The expectation is for a drop from 288,000 to 230,000. The ADP employment report has been a pretty good indicator in recent months and on Wednesday came in at 218,000. Traders will also be looking out for other elements to the payrolls report, such as unemployment (forecast at 6.1%), the average hourly earnings and also the participation rate. These all play into what the Fed will be looking out for. It is likely to be another volatile Payrolls Friday.
Chart of the Day – S&P 500
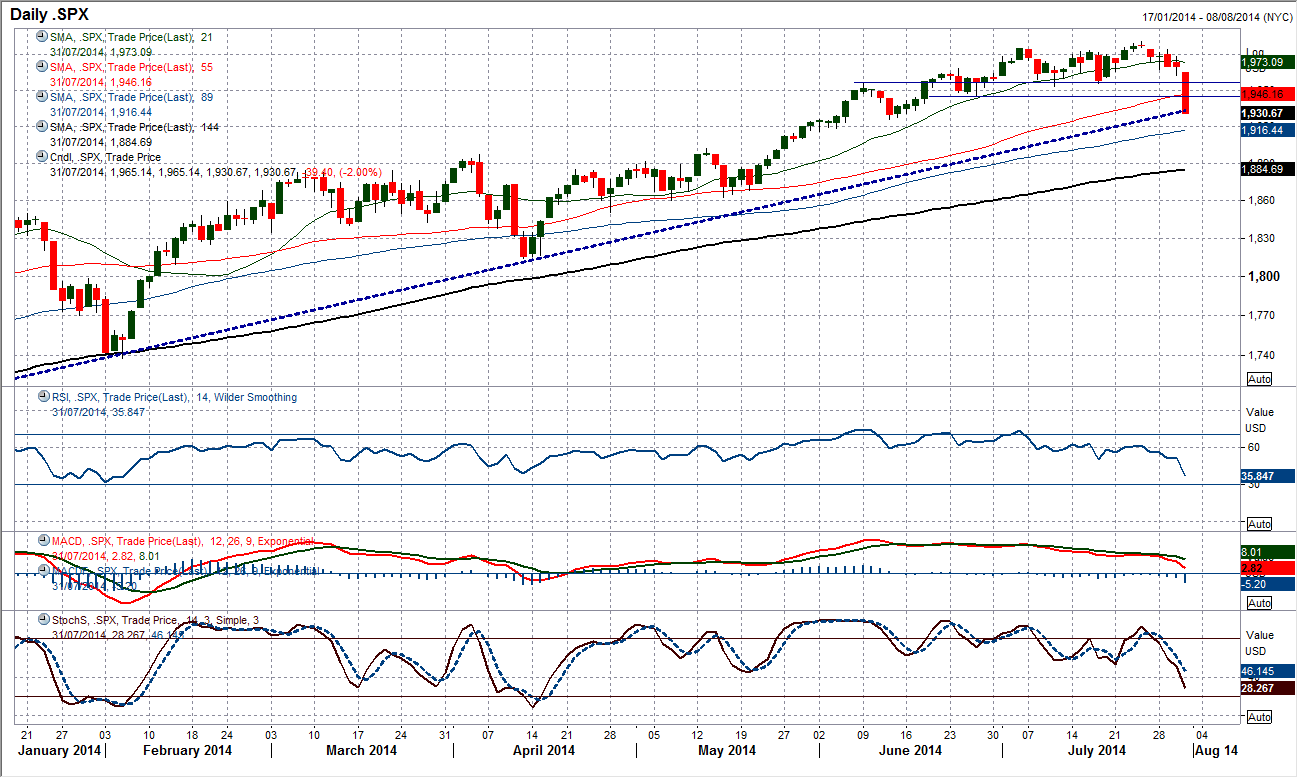
When the bears hit, they sure hit hard. What a day yesterday for Wall Street! There is a saying in the markets that you take the stairs up but the elevator back down again. After the slow drift higher where volatility was low and the bulls were calmly pushing higher, the selling pressure has told and the S&P 500 has seen its biggest down-day since 10th April. The big question is whether this is a blip and a buying opportunity or whether it is actually the start of a larger correction. I am not going to get overly excited about the selling quite yet although today’s reaction could be interesting. The downside has so far just unwound back to the primary uptrend which has been in place since November 2012. Momentum indicators have clearly taken a hit but are still OK on a longer term perspective. The 144 day moving average is the key longer term indicator of support and that does not come in until 1885. The next support comes in at 1925 which is the mid-June reaction low. Breaching all the support between 1945/1955 now means that this becomes the near term resistance for a recovery.
EUR/USD
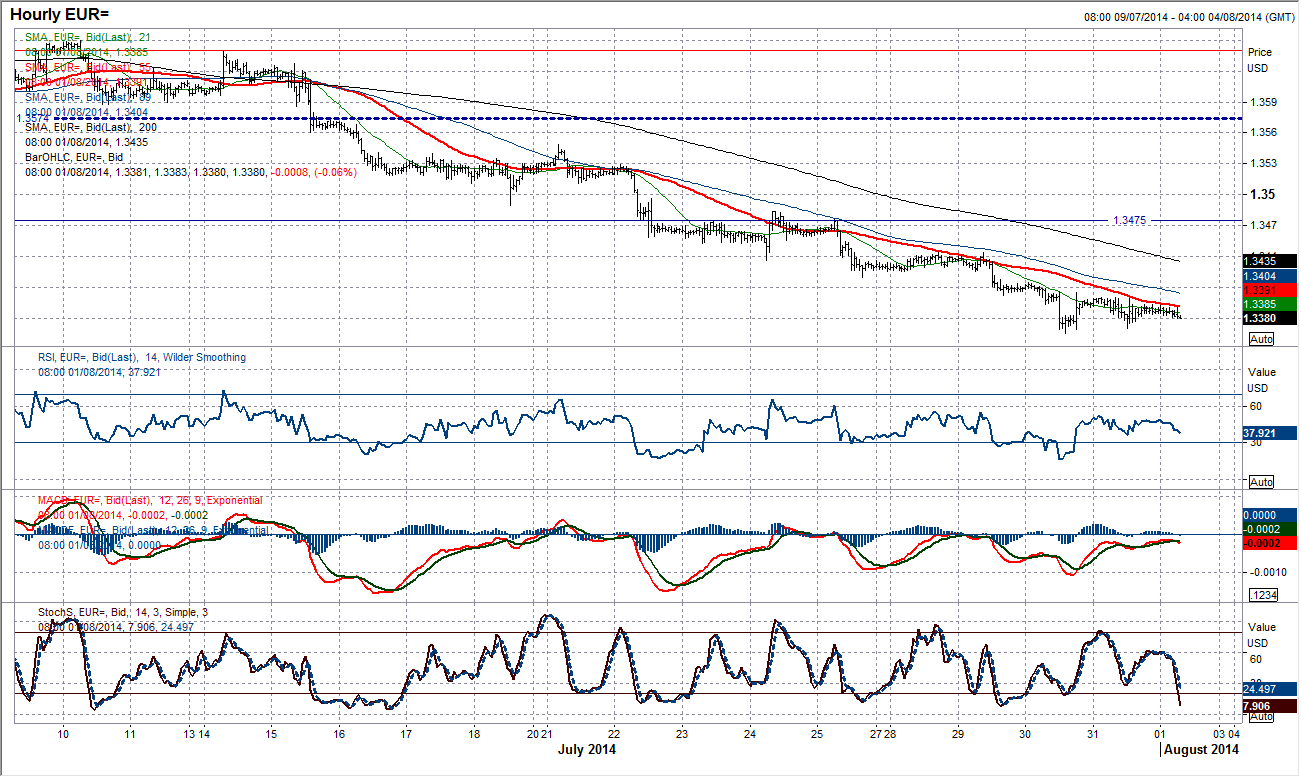
Taken in isolation, yesterday’s slight drift lower on the euro could be considered to be just another day. However, in light of the significant sell-off on equity markets, much of which was driven by increased expectation of Fed tightening, in fact the lack of downside pressure on the euro could be a significant event. Yesterday was an “inside day” which means a lack of conviction with the prevailing trend. The euro has been sold off almost indiscriminately in the past few weeks, but it is now looking rather stretched to the downside. The RSI is at 23 now and is the lowest since June 2012, furthermore the implied target from the April/May double top has been reached. Watching the intraday chart could give the first signs of a reversal now. The falling 89 hour moving average has been a good basis of resistance during the decline and comes in now at $1.3406. If the euro starts to trade above this is could be an early sign that the selling pressure is abating (for now) and a technical rally is due. The issue today is that there are so many huge fundamental events (PMIs, Non-farm Payrolls) that we could be in for a volatile day which could give false signals. As ever at the moment, any short positions should remain close to stops. A move below $1.3365 would continue the downside, but I believe we are edging closer to a rally now.
GBP/USD
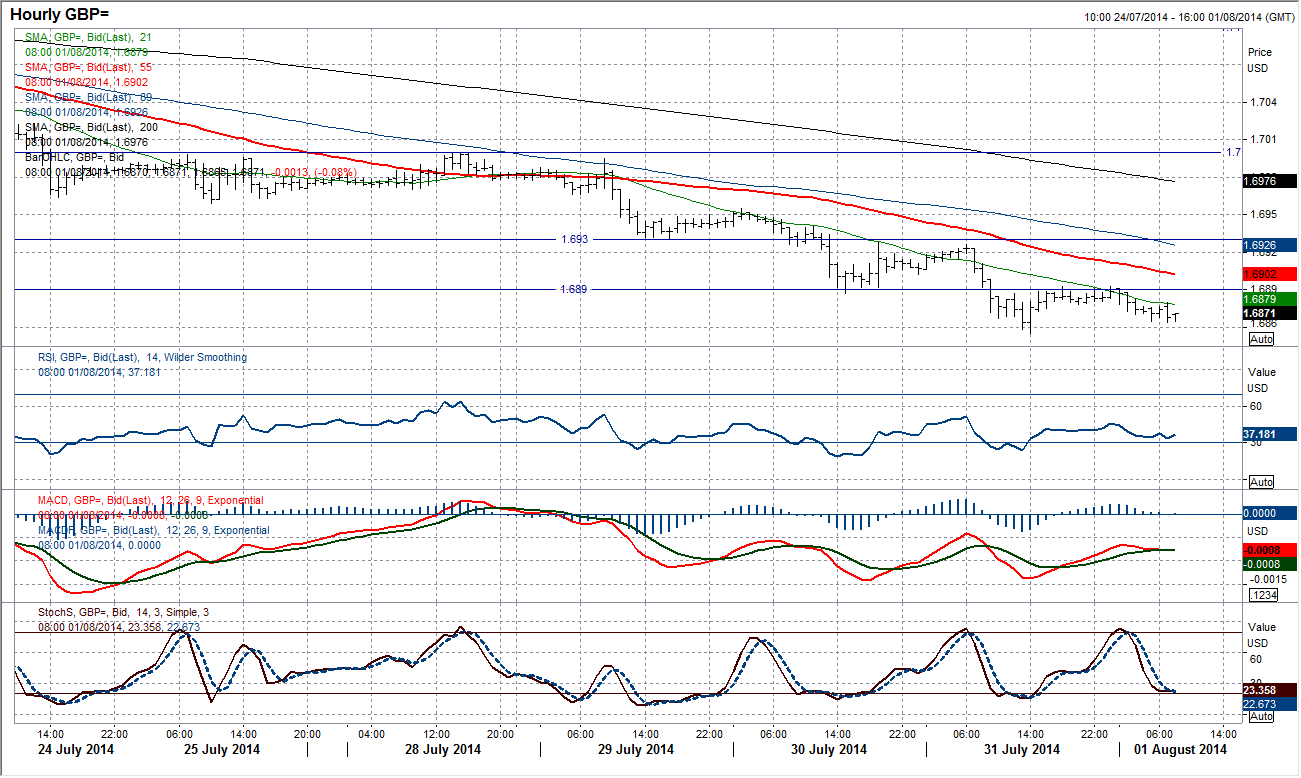
With this correction now well over 300 pips in under 3 weeks, I have been looking for a buy signal around the 89 day moving average for the past few days. Yesterday’s price action saw a dip below the 89 day ma and this move has continued today with Cable under further pressure. I have said that I would need to reassess my outlook on Cable if this indicator which has been an excellent basis for the medium term corrections during 2014 began to break down. I am now on the brink of changing my longer term outlook on Cable (away from sterling bullish). Momentum indicators look increasingly weak, with RSI now below 30, Stochastics very weak and MACD lines dropping below neutral. There is a significant amount of economic data due today that could mean it is a volatile day, but if Cable were to close now below yesterday’s low of $1.6855 this would be confirmation for me that the dollar bulls have scuppered the control of the sterling bulls. A retest of $1.6800 would ensue. The intraday chart shows the prospect of a recovery is far above with the falling 89 hour moving average (the basis of resistance throughout the past two weeks) up at $1.6928.
USD/JPY
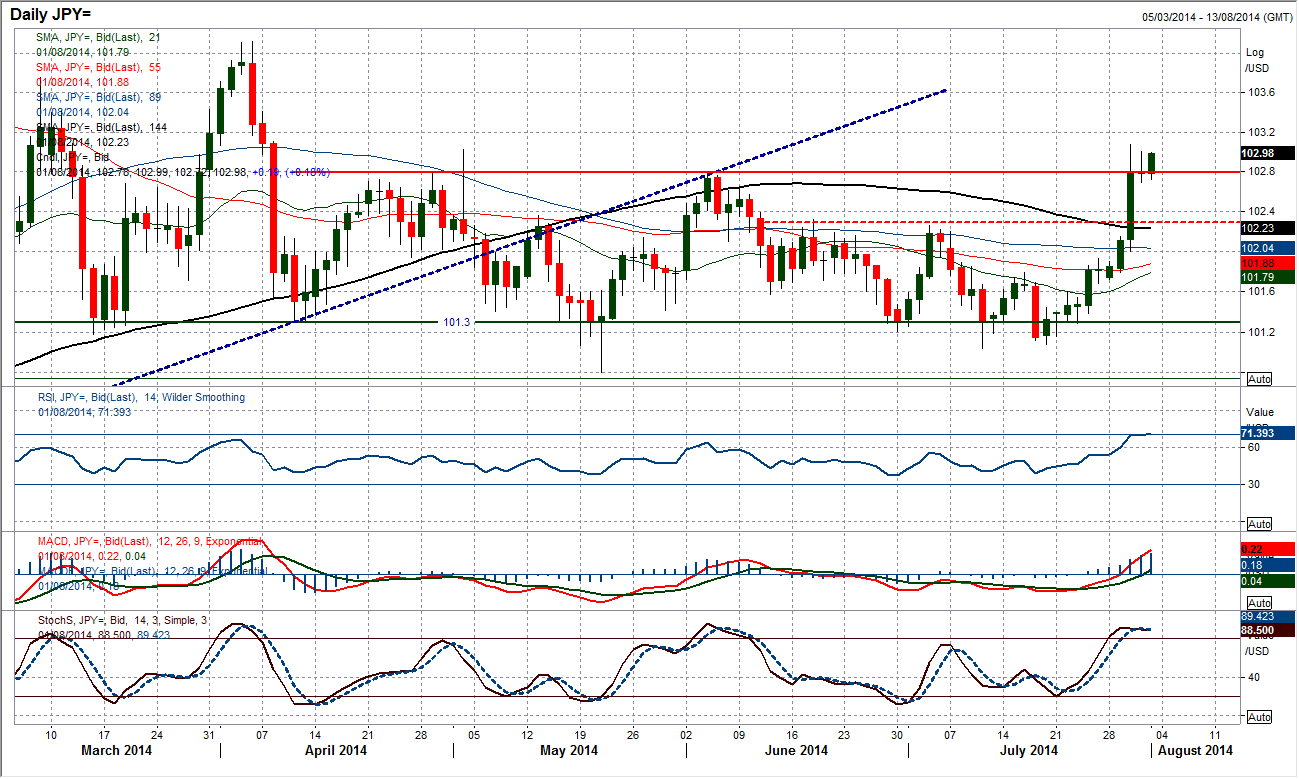
Interestingly from the perspective of dollar strength seen over the past few days, yesterday’s price action would have been viewed as a disappointment. An inside day (not entirely surprising given the magnitude of the previous session), but also another close around 102.80. I have said previously about the importance given to the pivot level of 102.80 in the past few months and again it has proved to be the case. Asian trading today has been positive for the dollar again so it will be interesting to see what the reaction is today and whether there is a repeat of yesterday’s waning of dollar strength as the day goes on. The RSI is up at over 70 still (suggesting a stretched move) and also the entire of yesterday’s session was outside the 2.0 Bollinger Bands (which again implies a stretched move). I believe therefore that immediate upside potential is limited and the prospect of a correction if not a consolidation is quite high. The first real support is not until 102.30. A breach and close above 103.08 would re-open the upside.
Gold
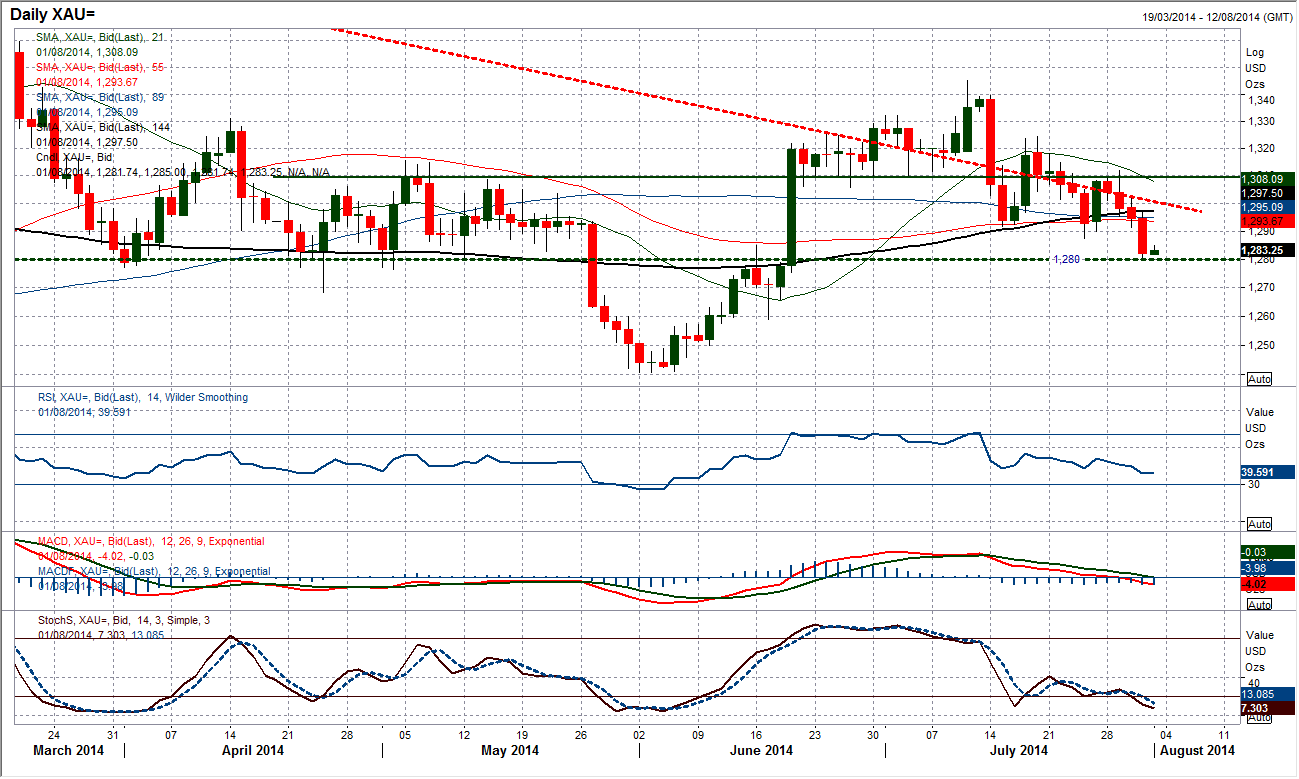
I believe that the gold bulls are now on the ropes and will have to fight hard to hold on to any prospect of a long term recovery now. The strength of the dollar is beginning to tell and yesterday’s decisive close below $1290 has piled the pressure on. Now the key pivot level at $1280 is all that stands in the way of a correction to test the reaction lows at $1258.85 and $1240.60. Crucially now, the 144 day moving average has been decisively broken and momentum indicators are falling away again. Today’s volatile trading day (due to the manufacturing PMIs and Non-farm Payrolls) could be telling. An instant close back above $1290 which is now an area of resistance would be encouraging, but the way things are shaping up, there would need to be a push above the reaction high at $1312.10 to prevent the three week decline from continuing.
Note: All information on this page is subject to change. The use of this website constitutes acceptance of our user agreement. Please read our privacy policy and legal disclaimer. Opinions expressed at FXstreet.com are those of the individual authors and do not necessarily represent the opinion of FXstreet.com or its management. Risk Disclosure: Trading foreign exchange on margin carries a high level of risk, and may not be suitable for all investors. The high degree of leverage can work against you as well as for you. Before deciding to invest in foreign exchange you should carefully consider your investment objectives, level of experience, and risk appetite. The possibility exists that you could sustain a loss of some or all of your initial investment and therefore you should not invest money that you cannot afford to lose. You should be aware of all the risks associated with foreign exchange trading, and seek advice from an independent financial advisor if you have any doubts.
Recommended Content
Editors’ Picks
AUD/USD posts gain, yet dive below 0.6500 amid Aussie CPI, ahead of US GDP

The Aussie Dollar finished Wednesday’s session with decent gains of 0.15% against the US Dollar, yet it retreated from weekly highs of 0.6529, which it hit after a hotter-than-expected inflation report. As the Asian session begins, the AUD/USD trades around 0.6495.
USD/JPY finds its highest bids since 1990, approaches 156.00

USD/JPY broke into its highest chart territory since June of 1990 on Wednesday, peaking near 155.40 for the first time in 34 years as the Japanese Yen continues to tumble across the broad FX market.
Gold stays firm amid higher US yields as traders await US GDP data

Gold recovers from recent losses, buoyed by market interest despite a stronger US Dollar and higher US Treasury yields. De-escalation of Middle East tensions contributed to increased market stability, denting the appetite for Gold buying.
Ethereum suffers slight pullback, Hong Kong spot ETH ETFs to begin trading on April 30

Ethereum suffered a brief decline on Wednesday afternoon despite increased accumulation from whales. This follows Ethereum restaking protocol Renzo restaked ETH crashing from its 1:1 peg with ETH and increased activities surrounding spot Ethereum ETFs.
Dow Jones Industrial Average hesitates on Wednesday as markets wait for key US data

The DJIA stumbled on Wednesday, falling from recent highs near 38,550.00 as investors ease off of Tuesday’s risk appetite. The index recovered as US data continues to vex financial markets that remain overwhelmingly focused on rate cuts from the US Fed.
