Market Overview
As continues to be the case, Russia never seems to be far away from the top of the list of concerns for investors. Yesterday, President Obama suggested that tougher sanctions were being considered should Russia move to escalate issues in eastern Ukraine. Wall Street markets closed lower and Asian markets were subsequently mixed. Equity investors will also need to factor in the news that US bank, Citigroup failed the Federal Reserve’s stress tests, which could make traders nervous today. European markets are set for a tough start to the trading day.
Volatility in forex trading could increase throughout the day. Sterling traders will be watching for UK Retail Sales which are announced at 09:30GMT, after which focus will then turn to the final reading of US Q4 2013 GDP at 12:30GMT, forecast at an annualised 2.7%. Then, late this evening the attention will be on Japanese inflation (at 23:30GMT) which could have significant implications for Dollar/Yen tomorrow.
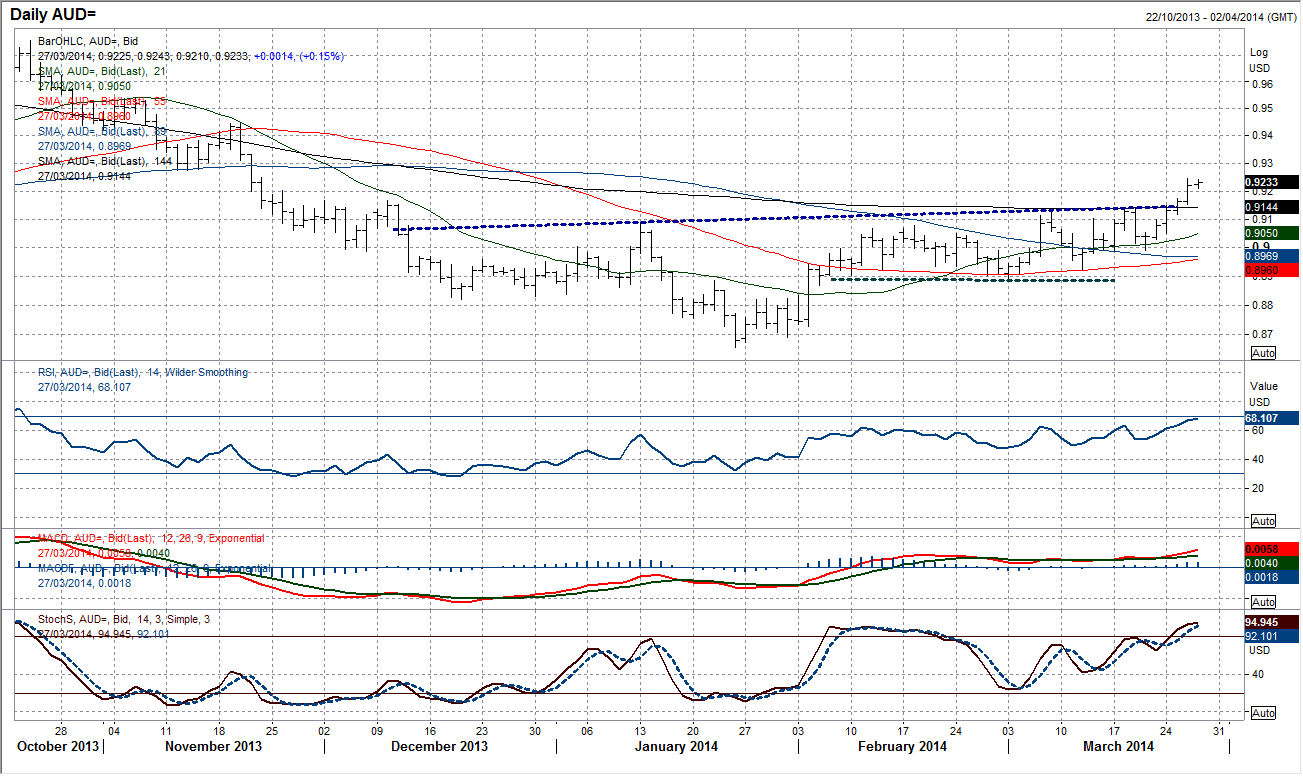
Chart of the Day – AUD/USD
For the past few months the Aussie dollar has been busy rebuilding some crushing underperformance in 2013. However, yesterday’s sharp move higher completed a second daily close above the key resistance at 0.9140. This completes a large base pattern and opens for further recovery which puts the November highs at 0.9447 and 0.9542 well within range. Momentum indicators look strong and any pullback towards the 0.9140 breakout support is a chance to buy. Technical indicators on the intraday hourly chart are equally as strong and the rate is currently being supported by the 21 hour moving average at 0.9229. Initial price support arrives at 0.9210, with the key support on the hourly chart at 0.9150.
EUR/USD
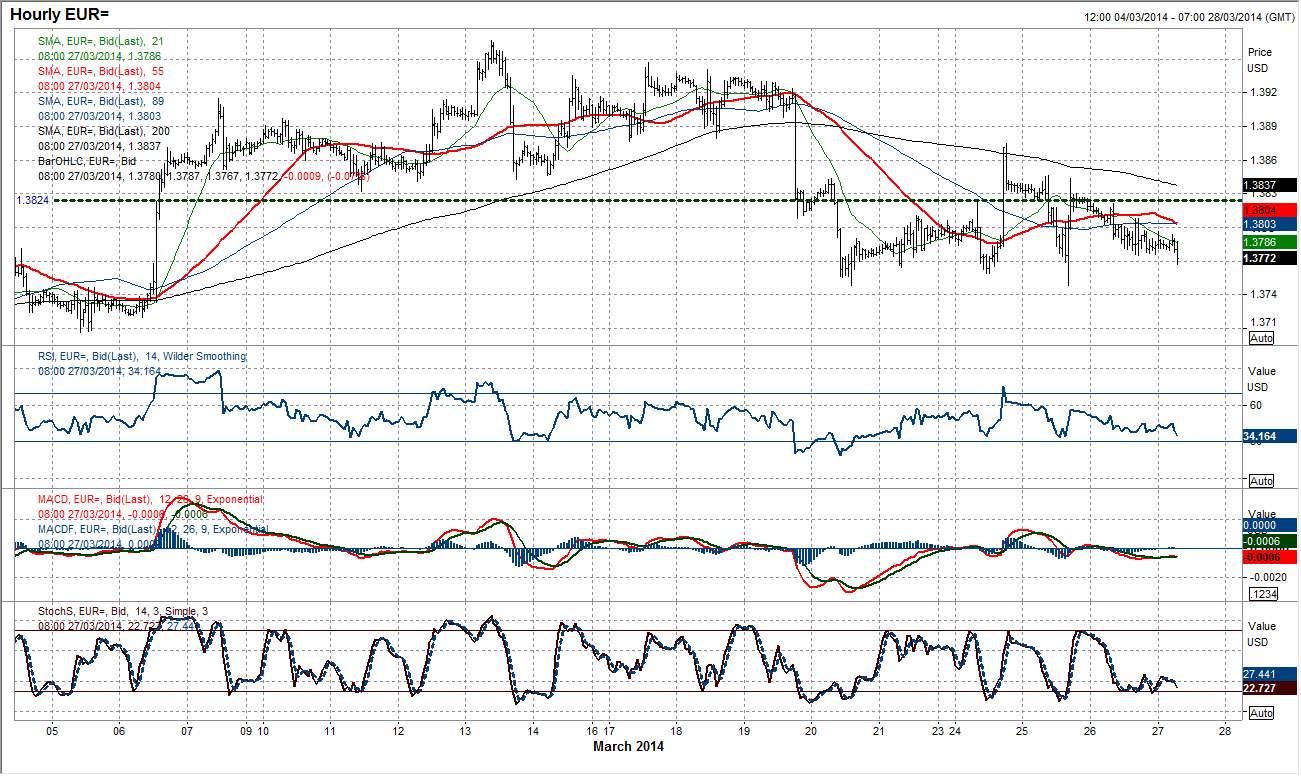
Having completed a breakdown below $1.3832 the Euro now seems to be in consolidation mode. The old 6 week uptrend is acting as the basis of resistance, while the 21 day moving average is also a barrier to gains. The daily momentum indicators remain in corrective mode. On the intraday chart, the top pattern completed below $1.3832 remains intact to imply a slide towards $1.3700. The hourly technical indicators are weak without being aggressively bearish, reflecting the recent slow drift lower. There is a downside bias for a test of support at $1.3748, with a series of lower highs in place. Rallies are being used as a chance to sell with $1.3821 and $1.3844 viable resistances for another such opportunity.
GBP/USD
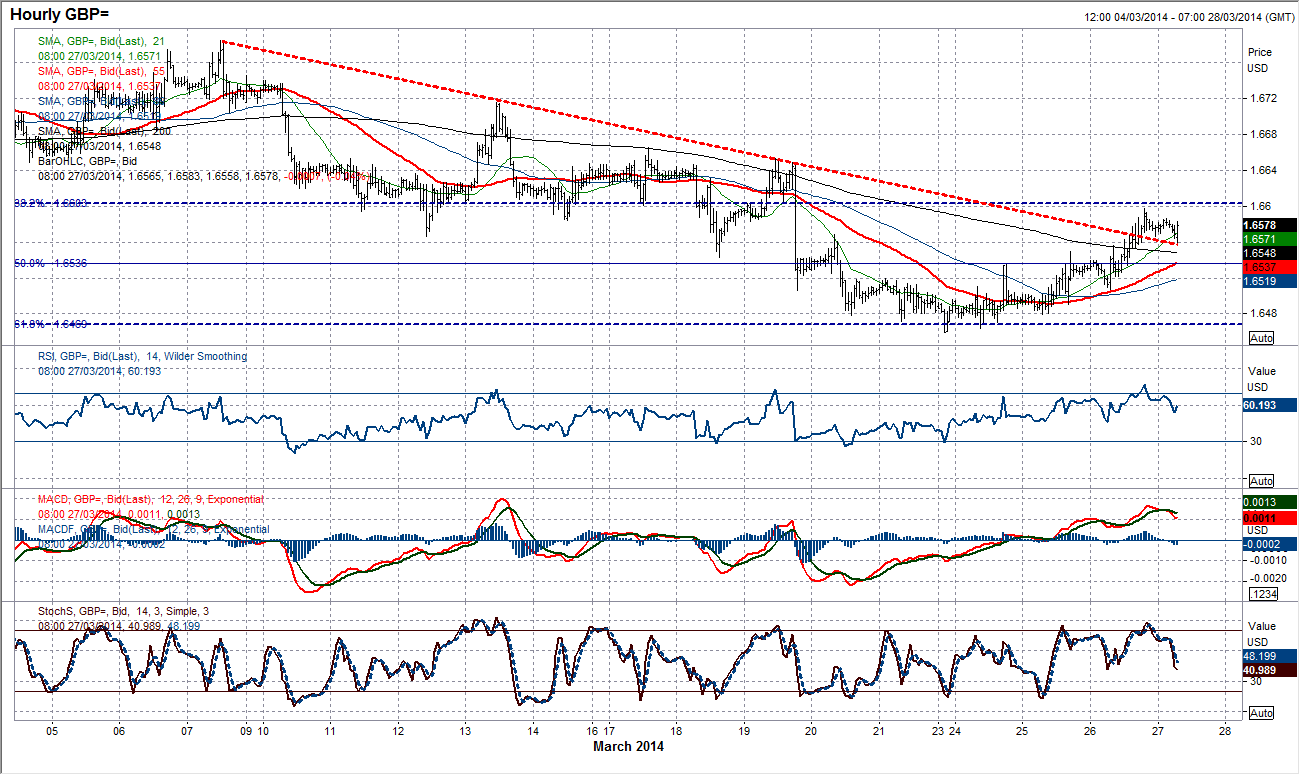
Cable has rallied over the past few days but the neckline resistance of the top pattern at $1.6580 now comes into play. Additionally the falling 21 day moving average (currently $1.6619) has capped the gains since mid-March. Momentum indicators on the daily chart are slightly mixed, with RSI unwinding back towards 50, while the Stochastics are recovering but the MACD is in negative. ON the intraday chart, the downtrend in place since 7th March has now been broken which muddies the waters slightly. For now, my impression is that I see the moves over the past couple of days is just bear market corrective, but the bulls are fighting hard. My outlook would change should Cable rally and hold above the 38.2% Fibonacci retracement at $1.6603. There is support now at $1.6550.
USD/JPY
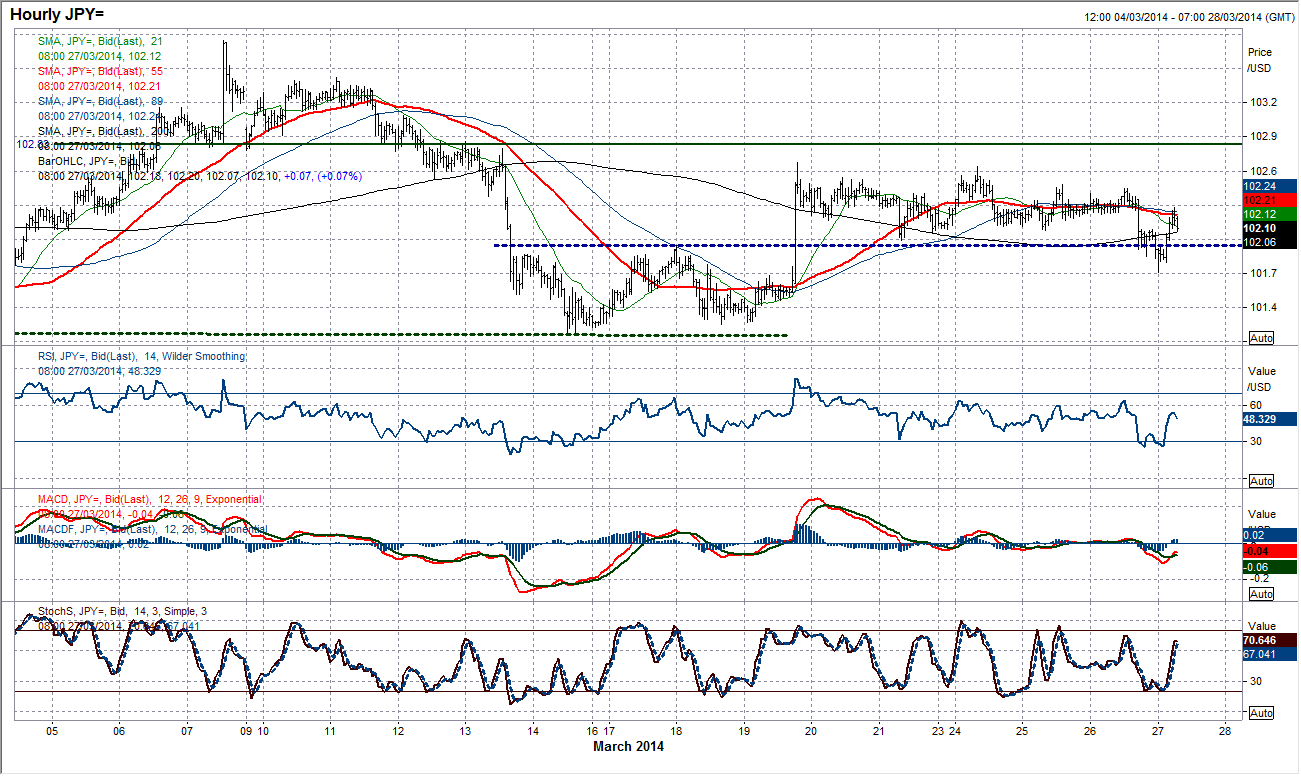
It may have been brief, but finally we saw yesterday a move of some substance as Dollar/Yen sold off overnight below the 101.95 support. The move has been entirely retraced, however, the break gives us an indication of the downside risk. We can now use the 102.48 resistance as a gauge now. The hourly RSI has now taken on a more negative configuration and a failure for the rate to move back above 102.48 would now be seen increasingly as the bears beginning to gain control. As before, the key resistance to the upside remains 102.68. The announcement of Japanese inflation late this evening could have a significant bearing on this chart overnight and is likely to increase volatility.
Gold
I spoke yesterday about the continued retreat of gold back towards $1300 which is exactly what we saw. There is now support at $1294, with the 50% Fibonacci retracement retracement of the 1184.50/1391.76 rally at $1288.13. Intraday momentum indicators remain in corrective mode, while hourly moving averages are all falling in bearish sequence. The sequence of lower highs in place are holding back any recoveries, with $1317.25 the latest key reaction high. Although further weakness can be expected, on a medium to longer term basis it will be interesting to see if gold begins to form support, with the 50% Fib retracement approaching.
Note: All information on this page is subject to change. The use of this website constitutes acceptance of our user agreement. Please read our privacy policy and legal disclaimer. Opinions expressed at FXstreet.com are those of the individual authors and do not necessarily represent the opinion of FXstreet.com or its management. Risk Disclosure: Trading foreign exchange on margin carries a high level of risk, and may not be suitable for all investors. The high degree of leverage can work against you as well as for you. Before deciding to invest in foreign exchange you should carefully consider your investment objectives, level of experience, and risk appetite. The possibility exists that you could sustain a loss of some or all of your initial investment and therefore you should not invest money that you cannot afford to lose. You should be aware of all the risks associated with foreign exchange trading, and seek advice from an independent financial advisor if you have any doubts.
Recommended Content
Editors’ Picks
AUD/USD jumps above 0.6500 after hot Australian CPI data

AUD/USD extended gains and recaptured 0.6500 in Asian trading, following the release of hotter-than-expected Australian inflation data. The Australian CPI rose 1% in QoQ in Q1 against 0.8% forecast, providing extra legs to the Australian Dollar upside.
USD/JPY hangs near 34-year high at 154.88 as intervention risks loom

USD/JPY is sitting at a multi-decade high of 154.88 reached on Tuesday. Traders refrain from placing fresh bets on the pair as Japan's FX intervention risks loom. Broad US Dollar weakness also caps the upside in the major. US Durable Goods data are next on tap.
Gold price cautious despite weaker US Dollar and falling US yields

Gold retreats modestly after failing to sustain gains despite fall in US Treasury yields, weaker US Dollar. XAU/USD struggles to capitalize following release of weaker-than-expected S&P Global PMIs, fueling speculation about potential Fed rate cuts.
Crypto community reacts as BRICS considers launching stablecoin for international trade settlement

BRICS is intensifying efforts to reduce its reliance on the US dollar after plans for its stablecoin effort surfaced online on Tuesday. Most people expect the stablecoin to be backed by gold, considering BRICS nations have been accumulating large holdings of the commodity.
US versus the Eurozone: Inflation divergence causes monetary desynchronization

Historically there is a very close correlation between changes in US Treasury yields and German Bund yields. This is relevant at the current juncture, considering that the recent hawkish twist in the tone of the Fed might continue to push US long-term interest rates higher and put upward pressure on bond yields in the Eurozone.


