EUR/USD Current Price: 1.1450
View Live Chart for the EUR/USD
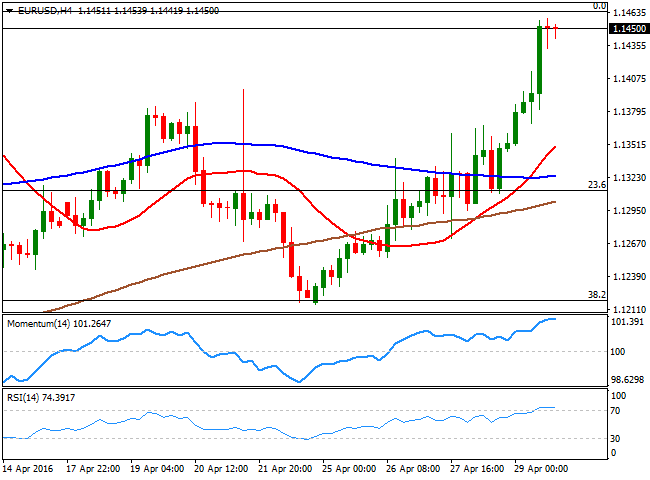
The common currency rallied all through the past week, closing it against the greenback at 1.1450, right below the major resistance area around 1.1460, a level that contained the pair ever since January 2015. Broad dollar's weakness after a dovish FED, alongside with improving global economic fundamentals, were behind the rally. Data continued to be soft in the US, and mixed in the EU, as on Friday, the euro area GDP surprised to the upside, accelerating from 0.3% in Q4 2015 to 0.6% in Q1 this year. Despite inflation in the EU fell back into deflationary territory in April, down by 0.2% annualized from 0.0% in March, things continue to look better than in the other shore of the Atlantic.
The rally is expected to continue, given that over the weekend, China's official manufacturing PMI showed that the latest bounce in the factory gauge stabilized in April, coming in at 50.1, compared with 50.2 in March. Market's sentiment will likely get a boost from the news, leading to more dollar's losses at the beginning of the week.
Gains in the EUR/USD pair are quite significant for a bullish case, as earlier in the week, the pair tested the 38.2% retracement of its latest bullish run at 1.1220, but failed to break below it. Still, further gains are not yet confirmed given the strength of the immediate resistance. Nevertheless, a clear break above it should be the beginning of a continued advance, up to the 1.1710 region. From a technical point of view, the 4 hours chart shows that the technical indicators have lost upward strength within overbought territory, probably as a result of decreasing volume at the end of the week than because of upward exhaustion. In the same chart, the 20 SMA heads sharply higher after crossing above the 100 and 200 SMAs, in line with the ongoing bullish trend.
Support levels: 1.1400 1.1370 1.1335
Resistance levels: 1.1460 1.1500 1.1535
EUR/JPY Current price: 121.87
View Live Chart for the EUR/JPY
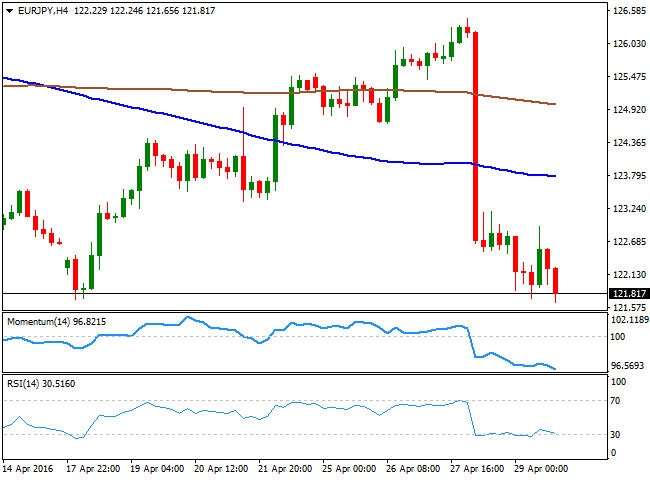
The EUR/JPY pair plummeted to its lowest in three years, ending the week at 121.81 as yen's post-BOJ strength, was fueled by nose-diving stocks last Friday. The Japanese currency resumed its bullish run after the local Central Bank decided to leave its economic policy unchanged on Thursday, and despite the EUR also gained last week, it held within its April's range. The daily chart for the pair shows that the decline began after failing to overcome a sharply bearish 100 DMA around 126.00, indicating the long term bearish momentum is towards the downside. Technical indicators in the mentioned time frame have crossed their mid-lines and accelerated their declines within negative territory, maintaining sharp bearish slopes, supporting some further declines ahead. In the 4 hours chart, the technical bias is also towards the downside, as the technical indicators head south within oversold territory, after a limited upward corrective move. The next bearish target is now the 120.00 figure, with a break below it probably fueling the decline on panic selling.
Support levels: 121.65 121.20 120.80
Resistance levels: 122.20 122.60 123.10
GBP/USD Current price: 1.4611
View Live Chart for the GBP/USD
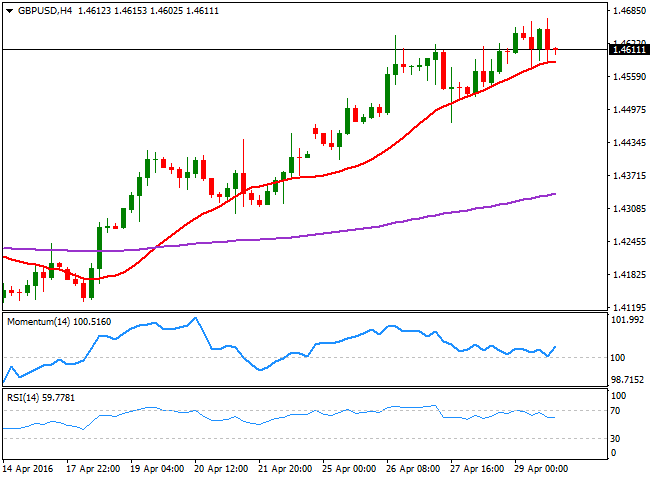
The Pound benefited last week from easing Brexit fears and dollar's weakness, but the GBP/USD bullish run lost steam on Friday, as the pair ended the day flat around 1.4611. The pair advanced up to 1.4670, surpassing February's high by a couple of pips before retreating towards the mentioned close, maintaining an overall positive tone. The macroeconomic calendar will be quite light in the UK this week, with the most relevant reading being the manufacturing PMI, expected at 51.3 against previous 51.0. Technical readings in the daily chart point for a continued advance during the upcoming days, as the price is well above a bullish 20 SMA, whilst the indicators present bullish slopes near overbought levels. In the shorter term, the 4 hours chart shows that the 20 SMA leads the way higher, attracting buying interest on retracements towards it. Now around 1.4590, the moving average has lost upward strength, indicating some downward vulnerability in the pair. In this last time frame, the Momentum indicator has bounced modestly from its 100 level whilst the RSI indicator remains flat around 59, also indicating the pair has lost part of its bullish strength.
Support levels: 1.4590 1.4550 1.4510
Resistance levels: 1.4670 1.4710 1.4750
USD/JPY Current price: 106.38
View Live Chart for the USD/JPY
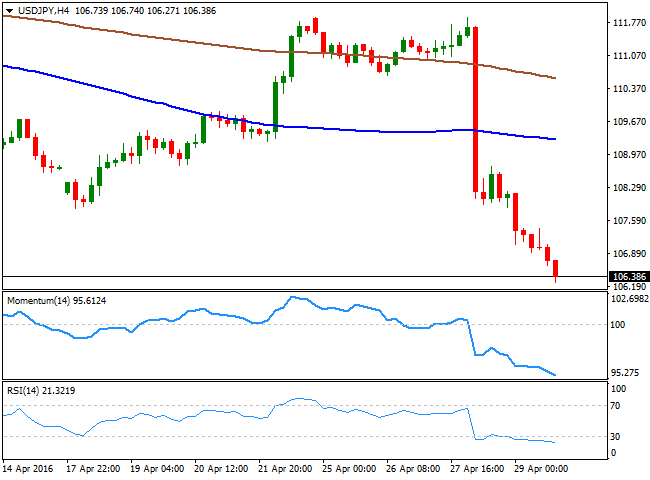
The USD/JPY fell to a fresh 18 months low of 106.27, and sits right above it ahead of the weekly opening, fueled late Friday by worse than expected US data. According to the Michigan index, consumer sentiment in the US fell to its lowest in seven months, down to 89 in April against 91 in March. Also, the Chicago PMI for the same month, fell to 50.4 from 53.6, indicating a slow start of the second quarter in the world's largest economy. Helping the JPY rally, were declining worldwide stocks, fueling demand for safe-haven assets. The unstoppable decline can now extend towards the 105.00 level, the line in the sand drew by the BOJ early April, as in the daily chart, the technical indicators present sharp bearish slopes within negative territory, whilst the 100 DMA extended its decline well above the current level, now around 113.70. In the shorter term, technical indicators are also biased lower, but within extreme oversold territory, also supporting further slides for this week, particularly on an extension below 106.20, the immediate support.
Support levels: 106.20 101.75 101.40
Resistance levels: 106.90 107.35 107.80
AUD/USD Current price: 0.7603
View Live Chart for the AUD/USD
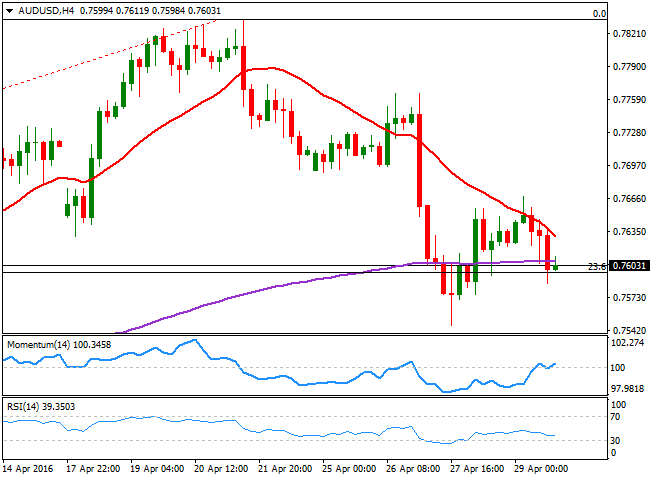
The Australian dollar closed the week down against the greenback, hit by dismal Q1 inflation in the country, which fuelled expectations that the RBA may cut rates during the upcoming months. In fact, the Reserve Bank of Australia will meet this week, although chances that it will act as soon as this week, are quite limited. Nevertheless, the Central Bank is expected to shift towards a more dovish stance in its statement, something that should weigh on the Aussie. Yet at the same time, improved data coming from China, signaling the economic slowdown has receded, alongside with dollar's weakness, should keep the downside in the pair limited in the longer run. Technically, the daily chart shows that the price stands around the 23.6% retracement of this year's rally, but capped by the 20 DMA, currently at 0.7660, a major resistance for these upcoming days, whilst the technical indicators present modest bearish strength within negative territory. In the 4 hours chart, the price is also below a sharply bearish 20 SMA, while the Momentum indicator aims higher in neutral territory and the RSI indicator is flat around 39, limiting chances of a downward move as long as the price holds above 0.7540, a strong static support.
Support levels: 0.7570 0.7540 0.7500
Resistance levels: 0.7660 0.7700 0.7745
Information on these pages contains forward-looking statements that involve risks and uncertainties. Markets and instruments profiled on this page are for informational purposes only and should not in any way come across as a recommendation to buy or sell in these assets. You should do your own thorough research before making any investment decisions. FXStreet does not in any way guarantee that this information is free from mistakes, errors, or material misstatements. It also does not guarantee that this information is of a timely nature. Investing in Open Markets involves a great deal of risk, including the loss of all or a portion of your investment, as well as emotional distress. All risks, losses and costs associated with investing, including total loss of principal, are your responsibility. The views and opinions expressed in this article are those of the authors and do not necessarily reflect the official policy or position of FXStreet nor its advertisers. The author will not be held responsible for information that is found at the end of links posted on this page.
If not otherwise explicitly mentioned in the body of the article, at the time of writing, the author has no position in any stock mentioned in this article and no business relationship with any company mentioned. The author has not received compensation for writing this article, other than from FXStreet.
FXStreet and the author do not provide personalized recommendations. The author makes no representations as to the accuracy, completeness, or suitability of this information. FXStreet and the author will not be liable for any errors, omissions or any losses, injuries or damages arising from this information and its display or use. Errors and omissions excepted.
The author and FXStreet are not registered investment advisors and nothing in this article is intended to be investment advice.
Recommended Content
Editors’ Picks
EUR/USD climbs to 10-day highs above 1.0700

EUR/USD gained traction and rose to its highest level in over a week above 1.0700 in the American session on Tuesday. The renewed US Dollar weakness following the disappointing PMI data helps the pair stretch higher.
GBP/USD extends recovery beyond 1.2400 on broad USD weakness

GBP/USD gathered bullish momentum and extended its daily rebound toward 1.2450 in the second half of the day. The US Dollar came under heavy selling pressure after weaker-than-forecast PMI data and fueled the pair's rally.
Gold rebounds to $2,320 as US yields turn south

Gold reversed its direction and rose to the $2,320 area, erasing a large portion of its daily losses in the process. The benchmark 10-year US Treasury bond yield stays in the red below 4.6% following the weak US PMI data and supports XAU/USD.
Here’s why Ondo price hit new ATH amid bearish market outlook Premium

Ondo price shows no signs of slowing down after setting up an all-time high (ATH) at $1.05 on March 31. This development is likely to be followed by a correction and ATH but not necessarily in that order.
Germany’s economic come back

Germany is the sick man of Europe no more. Thanks to its service sector, it now appears that it will exit recession, and the economic future could be bright. The PMI data for April surprised on the upside for Germany, led by the service sector.