EUR/USD Current Price: 1.1221
View Live Chart for the EUR/USD
The dollar closed the week with a firm tone against most of its major rivals, mostly weighed by the non-event that was the ECB meeting. The European Central Bank failed to provide fresh stimulus, whilst the press conference was dedicated to maintain confidence in the ECB ongoing easing policy. The comments came as a response to German's criticism, as policymakers in the country have clearly expressed concerns over the fact that “monetary policy has been the only policy in the last four years to support growth” and is clearly not working, given that inflation, according to Mario Draghi, will likely fall back into negative territory during the upcoming months, meaning that achieving the 2% target will take more time. Additionally, the common currency suffered on Friday with the release of the Eurozone PMIs for April, showing a modest growth, with the manufacturing sector still lagging and most of the positive news coming from services output.
Things in the US are far from better, as the US Markit manufacturing PMI fell to 50.8 in April, down from 51.5 in March. Still, the greenback found support on BOJ's comments suggesting that the Central Bank will add more stimulus in this week´s meeting, and hopes that the Federal Reserve, which also meets this week, will keep rates steady, but will also anticipate a rate hike for June.
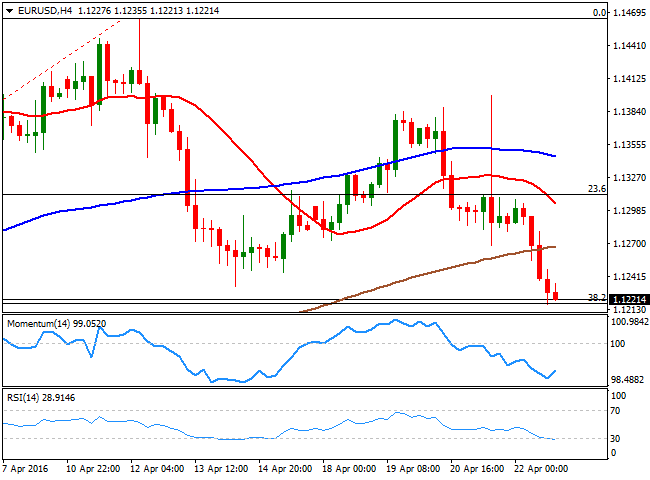
The EUR/USD pair closed the week a couple of pips above the 38.2% retracement of its latest bullish run between 1.0821 and 1.1464, and is technically poised to extend its decline as in the daily chart, the indicators maintain strong bearish slopes below their mid-lines, whilst the price has remained below a now bearish 20 SMA, around 1.1330/40, also a strong static resistance region. In the same chart, the 100 DMA heads north around 1.1100, a possible bearish target should the price extend its decline. In the 4 hours chart, the technical indicators have lost their bearish strength within oversold territory, but the price stands below all of its moving averages, indicating recoveries will likely be corrective, and opportunities to sell.
Support levels: 1.1220 1.1160 1.1120
Resistance levels: 1.1280 1.1315 1.1340
EUR/JPY Current price: 125.24
View Live Chart for the EUR/JPY
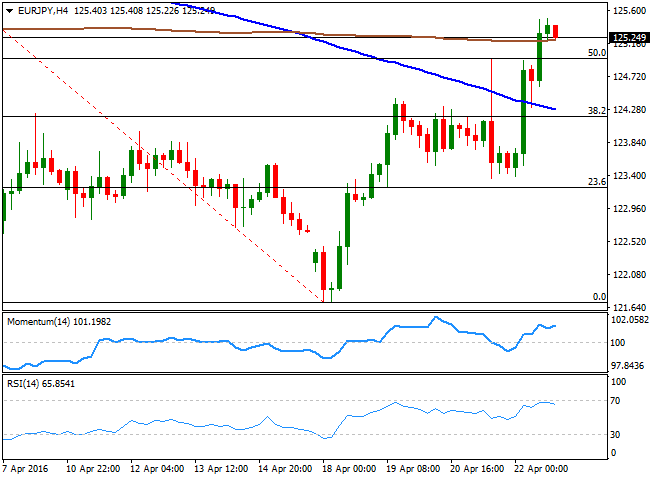
The Japanese yen edged sharply lower on Friday, on renewed expectations for further BOJ stimulus, also weighed by poor local data, as the Japanese April manufacturing PMI slumped to a new record low of 48.0 from 49.1. In spite of EUR self weakness, the EUR/JPY pair soared to 125.49, as speculative interest focused on unwinding JPY longs during the US session. The sharp recovery, however, stalled short from a major resistance, the 618% retracement of the 128.21/121.70 decline at 125.70, now the immediate resistance. Also in the daily chart, the 100 DMA presents a sharp bearish slope around 126.80, the level to beat to confirm a steeper recovery in term, now supported by the technical indicators, which head sharply higher around their mid-lines after bouncing from oversold readings. In the 4 hours chart, the Momentum indicator is aiming to regain its bullish strength within positive territory, while the RSI indicator consolidates around 65, and the price holds around a horizontal 200 SMA. A break through the mentioned Fibonacci resistance is required to confirm a new leg higher this Monday, up to the mentioned 100 DMA.
Support levels: 124.95 124.50 124.00
Resistance levels: 125.70 126.35 126.80
GBP/USD Current price: 1.4411
View Live Chart for the GBP/USD
The British Pound outperformed its major rivals, closing Friday at a fresh 3-week high above the 1.4400 level, supported by increased demand of high-yielders as risk sentiment continued to improve last week. The Sterling is still affected by Brexit fears, and during these past days a flip in polls showing an increasing intention to vote for staying, has also underpinned the recovery. During this week, focus will be on Chancellor of Exchequer Osborne who is being questioned by the Treasury Committee on the costs and benefits of the UK's EU membership, who will likely paint a gloomy future, should the kingdom leave the union. The GBP/USD pair closed the week at 1.4411, with the weekly high having been established at 1.4451, a few pips below March 30th high of 1.4458, and the daily chart shows that the price is well above a horizontal 20 SMA, whilst the technical indicators head sharply higher, supporting some additional gains for this Monday, particularly on an upward acceleration above 1.4460. In the shorter term, the 4 hours chart the pair has found some buying interest around a horizontal 20 SMA, currently at 1.4363, while the Momentum indicator remains neutral and the RSI aims slightly higher around 64, all of which supports the upside, but indicates an absence of bullish strength at current levels.
Support levels: 1.4365 1.4320 1.4270
Resistance levels: 1.4460 1.4510 1.4555
USD/JPY Current price: 111.61
View Live Chart for the USD/JPY
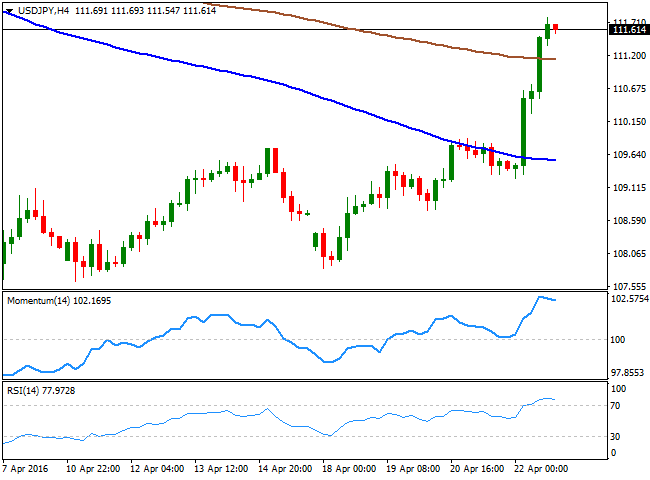
The USD/JPY pair jumped over 200 pips following BOJ's announcement that policy makers have been discussing negative-rate loans for financial institutions together with another rate cut, closing the week at 111.61, a few pips below the high set at 111.80. Separately, the Japanese economy continues to struggle to sustain growth, as the Japan’s manufacturing PMI printed 48.0 in April, missing an estimate of 49.5 and was below the previous read of 49.1. At this point, some kind of action has already been priced in, which means Kuroda will need to launch a huge bazooka next Thursday, to actually keep the JPY falling. Nevertheless, the ability of the Central Bank to influence price action is expected to be limited and short-lived. From a technical point of view, the fact that the pair recovered above 110.65, in where the price bottomed between February and March, is a first sign of an u-turn towards the upside, also supported by the technical indicators that head north almost vertically after crossing their mid-lines into positive territory. Nevertheless, the price is well below a bearish 100 DMA, currently around 114.35, and it will take a recovery beyond this last to see a more sustainable recovery in term. In the 4 hours chart, the price accelerated sharply higher and stands now above its 100 and 200 SMAs, whilst the technical indicators are giving some signs of upward exhaustion within extreme overbought territory, not enough, however, to suggest a downward corrective movement ahead.
Support levels: 111.20 110.65 110.30
Resistance levels: 111.90 112.35 112.85
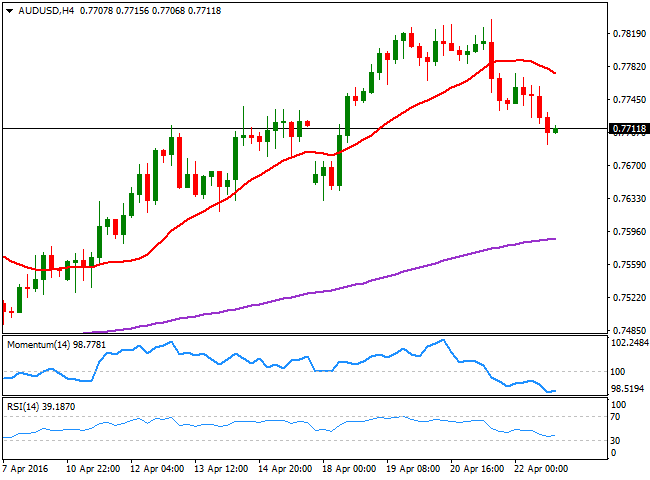
AUD/USD Current price: 0.7711
View Live Chart for the AUD/USD
The AUD/USD pair posted a fresh 10-month high last week of 0.7834 on Thursday, but turned sharply lower into the weekend and closed at 0.7711, as the American dollar gathered upward momentum and commodities trim part of its weekly gains. The Aussie however, maintains the long term positive tone, as higher interest rates and a bounce in commodities from record lows, are attracting overseas investors to Australian investments. The pair has rallied over 1,000 pips ever since the year started, and retracements in between have hardly surpassed the 200 pips, which means that the pair can fall down to the 0.7600 region without actually harming the dominant trend. From a technical point of view, the daily chart supports a downward corrective move, as the technical indicators have turned sharply lower from near overbought readings, and head south towards their mid-lines, still far. In the same chart, the 20 SMA has lost its upward strength, but offers an immediate support around 0.7660, the level to break this Monday to support a bearish day.
Support levels: 0.7660 0.7620 0.7570
Resistance levels: 0.7760 0.7790 0.7835
Information on these pages contains forward-looking statements that involve risks and uncertainties. Markets and instruments profiled on this page are for informational purposes only and should not in any way come across as a recommendation to buy or sell in these assets. You should do your own thorough research before making any investment decisions. FXStreet does not in any way guarantee that this information is free from mistakes, errors, or material misstatements. It also does not guarantee that this information is of a timely nature. Investing in Open Markets involves a great deal of risk, including the loss of all or a portion of your investment, as well as emotional distress. All risks, losses and costs associated with investing, including total loss of principal, are your responsibility. The views and opinions expressed in this article are those of the authors and do not necessarily reflect the official policy or position of FXStreet nor its advertisers. The author will not be held responsible for information that is found at the end of links posted on this page.
If not otherwise explicitly mentioned in the body of the article, at the time of writing, the author has no position in any stock mentioned in this article and no business relationship with any company mentioned. The author has not received compensation for writing this article, other than from FXStreet.
FXStreet and the author do not provide personalized recommendations. The author makes no representations as to the accuracy, completeness, or suitability of this information. FXStreet and the author will not be liable for any errors, omissions or any losses, injuries or damages arising from this information and its display or use. Errors and omissions excepted.
The author and FXStreet are not registered investment advisors and nothing in this article is intended to be investment advice.
Recommended Content
Editors’ Picks
AUD/USD recovers to near 0.6450, shrugs off mixed Australian jobs data

AUD/USD is rebounding to near 0.6450 amid renewed US Dollar weakness in the Asian session on Thursday. The pair reverses mixed Australian employment data-led minor losses, as risk sentiment recovers.
USD/JPY bounces back toward 154.50 amid risk-recovery

USD/JPY bounces back toward 154.50 in Asian trading on Thursday, having tested 154.00 on the latest US Dollar pullback and Japan's FX intervention risks. A recovery in risk appetite is aiding the rebound in the pair.
Gold rebounds on market caution, aims to reach $2,400

Gold price recovers its recent losses, trading around $2,370 per troy ounce during the Asian session on Thursday. The safe-haven yellow metal gains ground as traders exercise caution amidst heightened geopolitical tensions in the Middle East.
Manta Network price braces for volatility as $44 million worth of MANTA is due to flood markets

Manta Network price was not spared from the broader market crash instigated by a weakness in the Bitcoin market. While analysts call a bottoming out in the BTC price, the Web3 modular ecosystem token could suffer further impact.
Investors hunkering down

Amidst a relentless cautionary deluge of commentary from global financial leaders gathered at the International Monetary Fund and World Bank Spring meetings in Washington, investors appear to be taking a hiatus after witnessing significant market movements in recent weeks.
