EUR/USD Current Price: 1.1275
View Live Chart for the EUR/USD
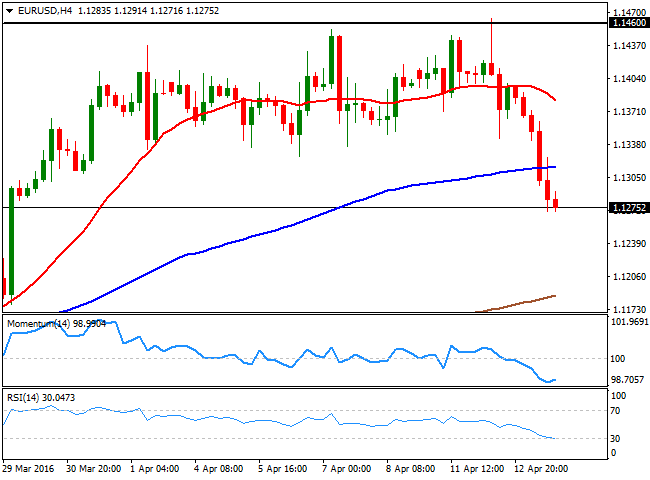
The EUR/USD pair plummeted to a fresh 2-week low of 1.1271, and stays nearby at the end of the day, with the dollar buoyed amid a sudden recovery in risk appetite. Chinese data released overnight lifted hopes that the economy is finally stabilizing, as exports, in USD terms, rose by 11.5% in March whilst exports fell less-than-expected, down by 7.6%, resulting in a trade surplus of $29.86B, down from $32.59B in February. Asian equities soared, with European and American indexes following the lead. Safe-haven assets suffered the most, whilst commodities also dropped on the back of oil's slide, all of which supported the greenback's rally.
In the data front, Industrial production in the EU declined by 0.8% in February, while January’s growth was revised down to 1.9%, weighing on the common currency. As for the US, data also disappointed, with retail sales unexpectedly falling in March by 0.3% and the Producer Price Index for final demand down by 0.1%.
The pair now trades below the base of its previous range, where selling interest capped the recovery that followed US poor macro releases, indicating that the decline may extend further during the upcoming sessions, although the possible extension of this current bearish correction is not yet clear. So far, the 4 hours chart supports some additional declines, as the technical indicators have barely lost downward strength near oversold territory, whilst the price develops now well below a mild bearish 20 SMA. The immediate support comes at 1.1245, and a break below it could see the pair extending its decline down to 1.1120/60, a major support region, in where buying interest should resume to deny a longer lasting decline.
Support levels: 1.1245 1.1200 1.1160
Resistance levels: 1.1335 1.1380 1.1420
EUR/JPY Current price: 123.24
View Live Chart for the EUR/JPY
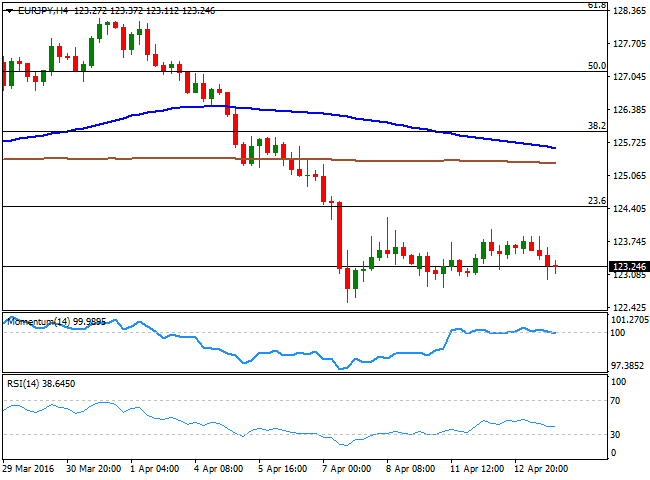
The EUR/JPY pair turned back south this Wednesday, as the common currency under-performed against all of its major rivals, although with the JPY also weak, the pair remained within its recent range. A change in market's mood after positive data coming from China spooked fears of a global economic slowdown, led the way, in spite of macroeconomic data. Holding above the 123.00 level, the 1 hour chart for the EUR/JPY pair shows that the price is back below its 100 SMA, whilst the technical indicators head south below their mid-lines, all of which indicates that the risk remains towards the downside. In the 4 hours chart, the Momentum indicator has turned south within neutral territory, whilst the RSI also heads lower around 37, in line with the shorter term outlook.
Support levels: 122.80 122.40 122.00
Resistance levels: 123.60 124.10 124.45
GBP/USD Current price: 1.4212
View Live Chart for the GBP/USD
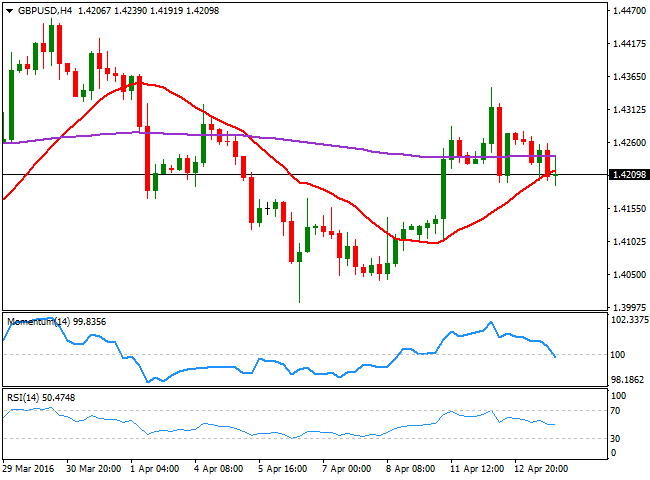
The GBP/USD pair erased all of its Tuesday gains and fell down to 1.4191 on broad dollar's strength and the absence of macroeconomic data in the UK. Nevertheless, the Pound was among the best performers against the greenback, as the pair has roughly gave back some 60 pips on the day. The BOE will have its monthly economic policy meeting this Thursday, but it's hardly expected to change its ongoing policy. If something, focus will turn in comments about the possible risk of a Brexit. In the meantime the 1 hour chart for the pair shows that the price developed below a now bearish 20 SMA, whilst the technical indicators lack directional strength, but hold within bearish territory, suggesting the pair may slip further during the upcoming sessions. In the 4 hours chart, the Momentum indicator has crossed below its 100 line with a strong bearish slope whilst the RSI indicator hovers in neutral territory and the price stands a few pips below a bullish 20 SMA, all of which increases chances of a downward continuation, particularly on a downward acceleration below the mentioned daily low.
Support levels: 1.4190 1.4150 1.4110
Resistance levels: 1.4240 1.4285 1.4330
USD/JPY Current price: 109.33
View Live Chart for the USD/JPY
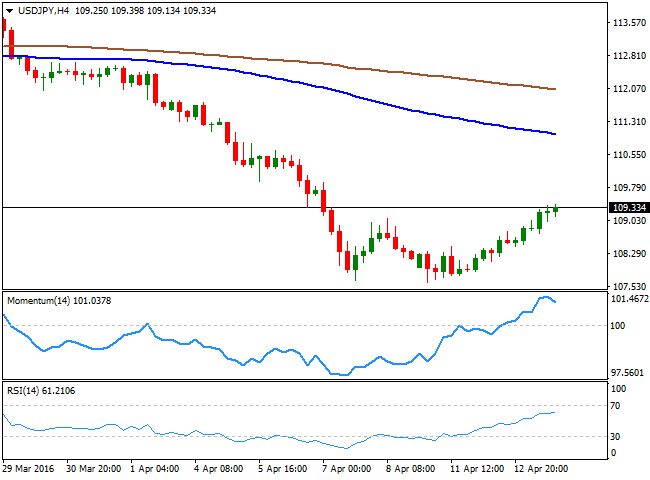
The Japanese yen fell for second day in-a-row against the greenback, as positive Chinese data and soaring worldwide stocks, forced investors to profit from the recent rally in the JPY. The USD/JPY pair rallied up to 109.39 daily basis, as disappointing US data played against the greenback. The pair has spent most of the American session consolidating between the mentioned high an 109.00, maintaining a short term positive tone, although with a decreasing upward momentum due to this latest ranging. The 1 hour chart shows that the price extended further after recovering above its 100 SMA late Tuesday, while the technical indicators hold well above their mid-lines, but with no directional bias. In the same time frame, the 200 SMA offers an immediate resistance around 109.50, and a break above it will imply a continued advance towards the 110.00 figure and beyond. In the 4 hours chart, the Momentum indicator turned south in overbought territory, but the RSI holds near 60, limiting the risk of a downward move for this Thursday. Nevertheless, the long term picture is still bearish, as it will take a recovery beyond 110.60 to support a steadier recovery in the pair.
Support levels: 108.90 108.40 107.95
Resistance levels: 109.50 110.00 110.45
AUD/USD Current price: 0.7672
View Live Chart for the AUD/USD
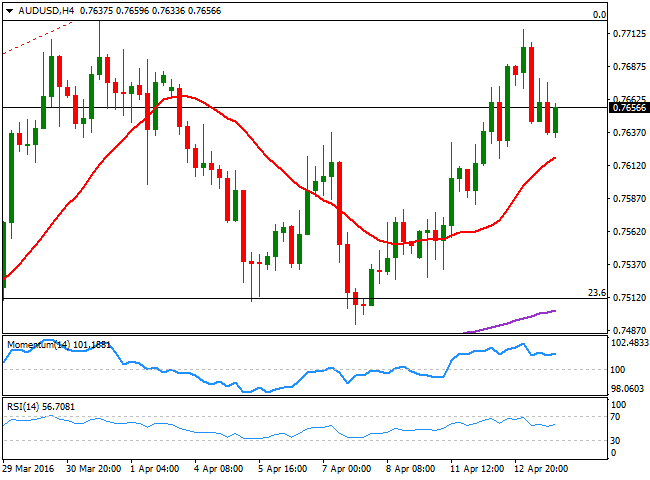
The AUD/USD pair topped at 0.7715 during the past Asian session, when the release of the Australian Westpac Melbourne Institute Index of Consumer Sentiment took it down, after falling by 4.0% in April from 99.1 in March to 95.1. The downward correction in crude oil prices also weighed on the Aussie as it dragged down all of the commodity-related currencies. The pair fell down to 0.7633 during the American session, but managed to bounce some ahead of the close, indicating a limited downward potential in the short term. Technically, the 1 hour chart shows that the price remains below a bearish 20 SMA, whilst the technical indicators head nowhere within negative territory. In the 4 hours chart, however, the technical picture favors the upside, given that the price is holding above a bullish 20 SMA, currently around 0.7620, and the immediate support, while the RSI indicator resumed its advance around 56 and the Momentum indicator also heads north well above its mid-lines. At this point, the pair needs to break above 0.7720, this year high set last March, to actually recoup its bullish momentum and approach the 0.8000 region.
Support levels: 0.7620 0.7590 0.7560
Resistance levels: 0.7680 0.7720 0.7760
Information on these pages contains forward-looking statements that involve risks and uncertainties. Markets and instruments profiled on this page are for informational purposes only and should not in any way come across as a recommendation to buy or sell in these assets. You should do your own thorough research before making any investment decisions. FXStreet does not in any way guarantee that this information is free from mistakes, errors, or material misstatements. It also does not guarantee that this information is of a timely nature. Investing in Open Markets involves a great deal of risk, including the loss of all or a portion of your investment, as well as emotional distress. All risks, losses and costs associated with investing, including total loss of principal, are your responsibility. The views and opinions expressed in this article are those of the authors and do not necessarily reflect the official policy or position of FXStreet nor its advertisers. The author will not be held responsible for information that is found at the end of links posted on this page.
If not otherwise explicitly mentioned in the body of the article, at the time of writing, the author has no position in any stock mentioned in this article and no business relationship with any company mentioned. The author has not received compensation for writing this article, other than from FXStreet.
FXStreet and the author do not provide personalized recommendations. The author makes no representations as to the accuracy, completeness, or suitability of this information. FXStreet and the author will not be liable for any errors, omissions or any losses, injuries or damages arising from this information and its display or use. Errors and omissions excepted.
The author and FXStreet are not registered investment advisors and nothing in this article is intended to be investment advice.
Recommended Content
Editors’ Picks
EUR/USD regains traction, recovers above 1.0700

EUR/USD regained its traction and turned positive on the day above 1.0700 in the American session. The US Dollar struggles to preserve its strength after the data from the US showed that the economy grew at a softer pace than expected in Q1.
GBP/USD returns to 1.2500 area in volatile session

GBP/USD reversed its direction and recovered to 1.2500 after falling to the 1.2450 area earlier in the day. Although markets remain risk-averse, the US Dollar struggles to find demand following the disappointing GDP data.
Gold holds around $2,330 after dismal US data

Gold fell below $2,320 in the early American session as US yields shot higher after the data showed a significant increase in the US GDP price deflator in Q1. With safe-haven flows dominating the markets, however, XAU/USD reversed its direction and rose above $2,340.
XRP extends its decline, crypto experts comment on Ripple stablecoin and benefits for XRP Ledger

Ripple extends decline to $0.52 on Thursday, wipes out weekly gains. Crypto expert asks Ripple CTO how the stablecoin will benefit the XRP Ledger and native token XRP.
After the US close, it’s the Tokyo CPI

After the US close, it’s the Tokyo CPI, a reliable indicator of the national number and then the BoJ policy announcement. Tokyo CPI ex food and energy in Japan was a rise to 2.90% in March from 2.50%.