EUR/USD Current Price: 1.1393
View Live Chart for the EUR/USD
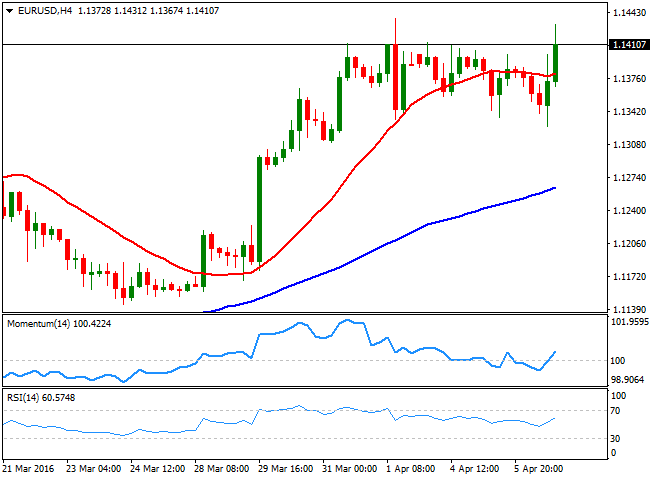
Market's sentiment improved this Wednesday, helped by an uptick in China’s economic activity, which cooled off the sell-off in Asian share markets. The Chinese Caixin non-manufacturing PMI printed 52.2 in March, above the 51.2 from February, bringing the composite PMI to 51.3 from 49.4 in February, indicating that the continued PBoC easing is finally offering some results. The American dollar managed to advance some against the common currency, but once again, investors chose to sell the greenback at better levels, as the EUR/USD fell to 1.1326 before surging to a fresh weekly high of 1.1431, ahead of the release of FOMC Minutes.
The US Central Bank statement reiterated that upcoming moves are data dependant, while also showed that an April rate hike was largely discussed, indicating that the FOMC is prepared to move even without a scheduled press conference. The minutes also showed that policy makers are more concerned over the persistent global risks than over the health of the American economy, as they acknowledged employment remains strong, whilst inflation is starting to rise.
The greenback recovered some ground after the less-than-expected Minutes' dovish tone, which left doors open for a June hike, and sent the EUR/USD pair briefly below the 1.1400 region, but still within its latest range. Despite the pair has traded in quite a limited range ever since the week started, the downward potential seems well limited, as declines towards the 1.1300 region are being quickly reverted. Technically, the 4 hours chart shows that the pair is now above a horizontal 20 SMA, whilst the technical indicators head north above their mid-lines, favoring a continued advance. Given the latest moves however, the pair needs now to extend beyond the 1.1460 region, a strong long term static resistance level, to confirm a new leg higher to 1.1500 and beyond.
Support levels: 1.1370 1.1330 1.1280
Resistance levels: 1.1460 1.1500 1.1540
EUR/JPY Current price: 124.91
View Live Chart for the EUR/JPY
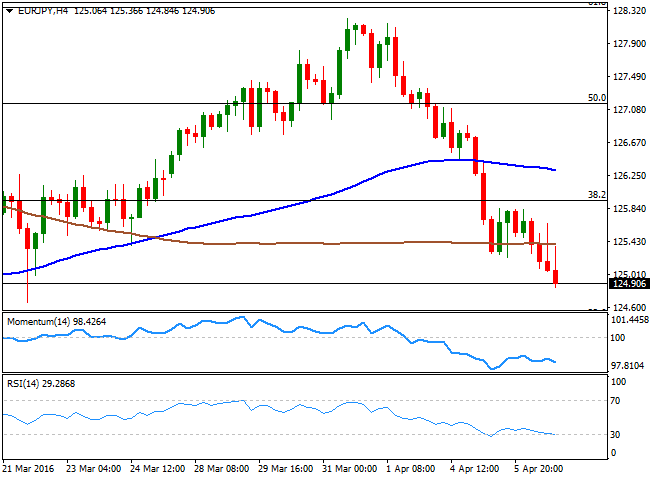
The EUR/JPY pair remained dominated by JPY's strength, plummeting to a fresh 4-week low of 124.84 after the release of the US Federal Reserve Minutes, and holding nearby by the end of the day. The Nikkei 225 halted the bleeding on Wednesday, closing the day 17 points lower at 15,715.36, with local investors' sentiment being weighed by another round of poor local data. The Leading economic index came in at 99.8 in February from 101.8 previous, while the Coincident index also fell, to 110.3 from 113.5. The short term picture is clearly bearish, given that in the 1 hour chart, the 100 SMA has crossed below the 200 SMA, both well above the current level, while the technical indicators head modestly lower within negative territory. In the 4 hours chart, and after a long lasting battle, the price is now below its 200 SMA, whilst the technical indicators are resuming their declines within negative territory, in line with further declines towards the 124.40 region, the 23.6% retracement of the February/March bearish run.
Support levels: 124.80 124.40 124.00
Resistance levels: 125.50 125.95 126.60
GBP/USD Current price: 1.4118
View Live Chart for the GBP/USD
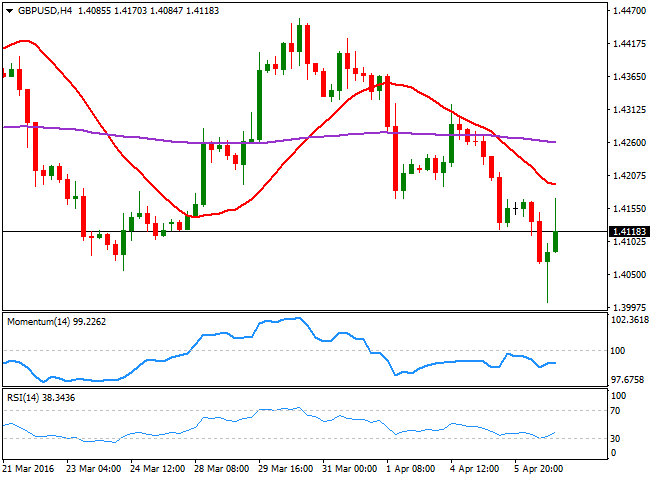
The British Pound remained under selling pressure, and the GBP/USD pair was treading water around the 1.4000 figure ahead of the US opening, before finally bouncing back over 150 pips, to post a daily high of 1.4170. There was no catalyst behind the pair's decline, except renewed fears over a Brexit, which ultimately are forcing speculators to reduce their exposure to UK assets. The pair pulled back after the FOMC Minutes resulted less dovish than expected, and closed the day in the red. According to the 1 hour chart, the risk remains towards the downside as the intraday bounce was just enough to erase the extreme oversold readings reached by technical indicators, before they turned back south after testing their mid-lines. In the same chart, the price is hovering around a bearish 20 SMA, around 1.4110, all of which indicates that selling interest remains strong. In the 4 hours chart, the recovery stalled below a bearish 20 SMA, currently around 1.4200, while the technical indicators present mild bullish slopes within negative territory, lacking enough momentum to confirm an upward continuation at the time being.
Support levels: 1.4095 1.4050 1.4000
Resistance levels: 1.4160 1.4200 1.4250
USD/JPY Current price: 109.61
View Live Chart for the USD/JPY
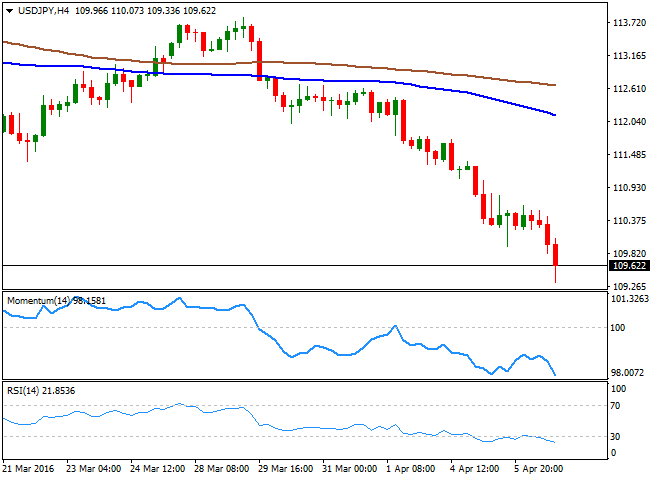
Despite market´s talks of additional BOJ easing, the Japanese yen kept rallying, accelerating its advance in the US session on broad dollar's weakness. The USD/JPY pair plummeted to 109.54 ahead of the release of the US Federal Reserve Minutes, extending it afterwards down to 109.33, its lowest since October 2014. The weekly steeper decline has left short term technical indicators in extreme oversold levels, as in the 1 hour chart, the RSI stands at 26 whilst the Momentum indicator also stands at record lows. In the same chart, the 100 SMA has accelerated its decline above the current level, widening the distance with the 200 SMA, far above the shortest, which indicates the strength of the ongoing decline. In the 4 hours chart, the technical indicators head sharply lower, also within extreme oversold territory, supporting some further declines towards the 109.00 level and below during the upcoming sessions.
Support levels: 109.30 108.80 108.50
Resistance levels: 109.90 110.25 110.70
AUD/USD Current price: 0.7588
View Live Chart for the AUD/USD
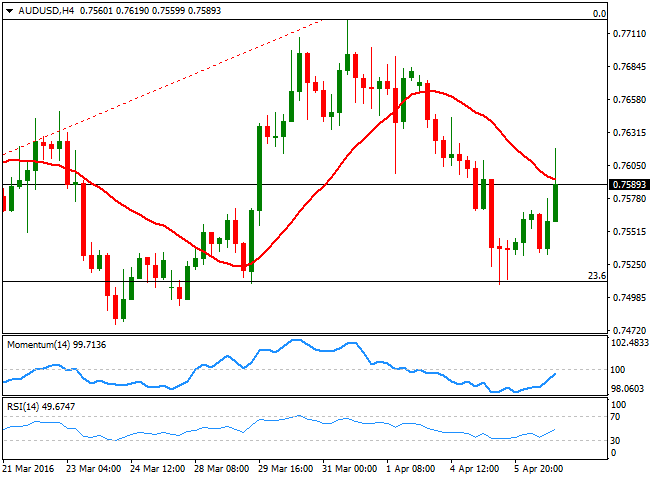
The AUD/USD pair recovered most of the ground lost on Tuesday, recovering briefly beyond the 0.7600 figure during the American afternoon, before settling a handful of pips below the critical figure. The antipodean currency found support in a recovery in oil's prices, up after the US reported a sharp decline in stockpiles and Kuwait revamped hopes of an output freeze agreement. Short term, the pair is biased higher given that in the 1 hour chart, the price is currently developing well above a bullish 20 SMA, around 0.7560, whilst the technical indicators are resuming their advances within positive territory, and following a limited downward correction from oversold levels. In the 4 hours chart, the price is currently battling a bearish 20 SMA, while the technical indicators maintain strong upward slopes around their mid-lines, not yet confirming a breakout higher. At this point, the price needs to extend beyond 0.7620, the immediate resistance and the post-FED's minutes high, to confirm additional gains, back towards the 0.7700 region.
Support levels: 0.7555 0.7510 0.7470
Resistance levels: 0.7620 0.7660 0.7700
Information on these pages contains forward-looking statements that involve risks and uncertainties. Markets and instruments profiled on this page are for informational purposes only and should not in any way come across as a recommendation to buy or sell in these assets. You should do your own thorough research before making any investment decisions. FXStreet does not in any way guarantee that this information is free from mistakes, errors, or material misstatements. It also does not guarantee that this information is of a timely nature. Investing in Open Markets involves a great deal of risk, including the loss of all or a portion of your investment, as well as emotional distress. All risks, losses and costs associated with investing, including total loss of principal, are your responsibility. The views and opinions expressed in this article are those of the authors and do not necessarily reflect the official policy or position of FXStreet nor its advertisers. The author will not be held responsible for information that is found at the end of links posted on this page.
If not otherwise explicitly mentioned in the body of the article, at the time of writing, the author has no position in any stock mentioned in this article and no business relationship with any company mentioned. The author has not received compensation for writing this article, other than from FXStreet.
FXStreet and the author do not provide personalized recommendations. The author makes no representations as to the accuracy, completeness, or suitability of this information. FXStreet and the author will not be liable for any errors, omissions or any losses, injuries or damages arising from this information and its display or use. Errors and omissions excepted.
The author and FXStreet are not registered investment advisors and nothing in this article is intended to be investment advice.
Recommended Content
Editors’ Picks
EUR/USD clings to daily gains above 1.0650

EUR/USD gained traction and turned positive on the day above 1.0650. The improvement seen in risk mood following the earlier flight to safety weighs on the US Dollar ahead of the weekend and helps the pair push higher.
GBP/USD recovers toward 1.2450 after UK Retail Sales data

GBP/USD reversed its direction and advanced to the 1.2450 area after touching a fresh multi-month low below 1.2400 in the Asian session. The positive shift seen in risk mood on easing fears over a deepening Iran-Israel conflict supports the pair.
Gold holds steady at around $2,380 following earlier spike

Gold stabilized near $2,380 after spiking above $2,400 with the immediate reaction to reports of Israel striking Iran. Meanwhile, the pullback seen in the US Treasury bond yields helps XAU/USD hold its ground.
Bitcoin Weekly Forecast: BTC post-halving rally could be partially priced in Premium

Bitcoin price shows no signs of directional bias while it holds above $60,000. The fourth BTC halving is partially priced in, according to Deutsche Bank’s research.
Week ahead – US GDP and BoJ decision on top of next week’s agenda

US GDP, core PCE and PMIs the next tests for the Dollar. Investors await BoJ for guidance about next rate hike. EU and UK PMIs, as well as Australian CPIs also on tap.