EUR/USD Current Price: 1.1116
View Live Chart for the EUR/USD
The shared currency extended its decline for fifth consecutive day, after the ECB's Governing Council indicated its willingness to act in March, in the Minutes of their latest meeting. The Central Bank´s head, Mario Draghi, has already anticipated their intention to review the ongoing QE in the region, and the Minutes fueled speculation that something will be done next month. The day began with some improved risk sentiment, as Asian shares gained strongly, alongside with crude oil prices. The positive mood, however, faded in the American afternoon, in spite data coming from the US resulted pretty encouraging, as weekly unemployment claims fell to 262K in the week ending Feb 12, while the Philadelphia manufacturing index declined by less than expected, resulting a -2.8. For this Friday, the country is expected to release its January inflation figures, expected slightly better than December ones.
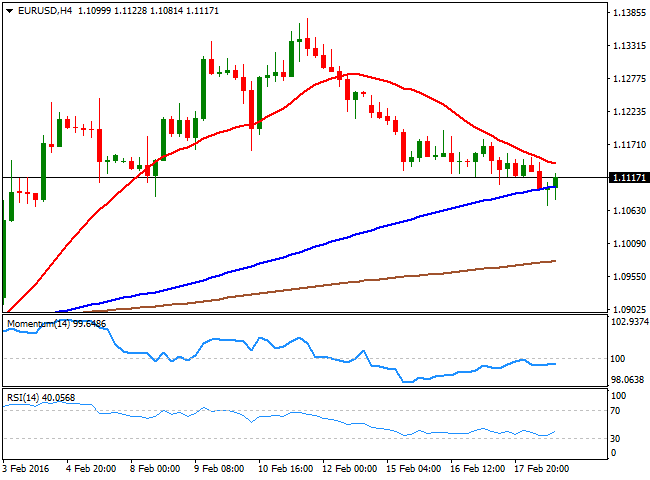
The EUR/USD pair fell down to 1.1070 following the release of positive US data, but bounced back above the 1.1100 level, maintaining the weak tone seen on previous updates. The 1 hour chart shows that the price is currently battling with a bearish 20 SMA, while the technical indicators are still below their mid-lines, far from supporting a stronger advance. In the same chart, the 100 SMA has crossed below the 200 SMA offering a strong dynamic support around 1.1160. In the 4 hours chart, the price is also below its 20 SMA, while the technical indicators have turned slightly higher, also below their mid-lines, indicating limited buying interest at current levels.
Support levels: 1.1080 1.1045 1.1000
Resistance levels: 1.1160 1.1200 1.1245
EUR/JPY Current price: 126.21
View Live Chart for the EUR/JPY
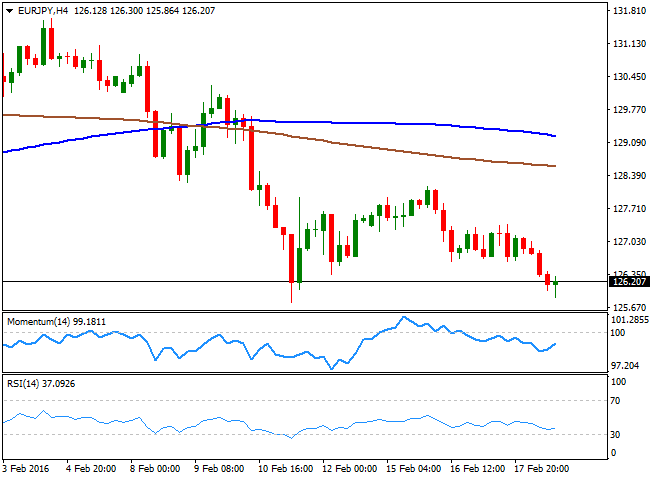
The EUR/JPY pair fell down to its recent lows during the American afternoon, reaching 125.84 before bouncing some. The Japanese yen strengthened during the second half of the day, as Wall Street wobbled between gains and losses, unable to replicate its previous advances. Technically, the 1 hour chart shows that the price has moved further below its 100 SMA, currently around 126.20, while the Momentum indicator consolidates in negative territory, and the RSI indicator aims higher from oversold territory, limiting chances of a downward move, but far from suggesting a sharper recovery. In the 4 hours chart, the technical indicators have turned slightly higher within negative territory, although the price remains well below its moving averages, in line with the shorter term outlook.
Support levels: 125.85 125.50 125.10
Resistance levels: 126.40 126.85 127.20
GBP/USD Current price: 1.4338
View Live Chart for the GBP/USD
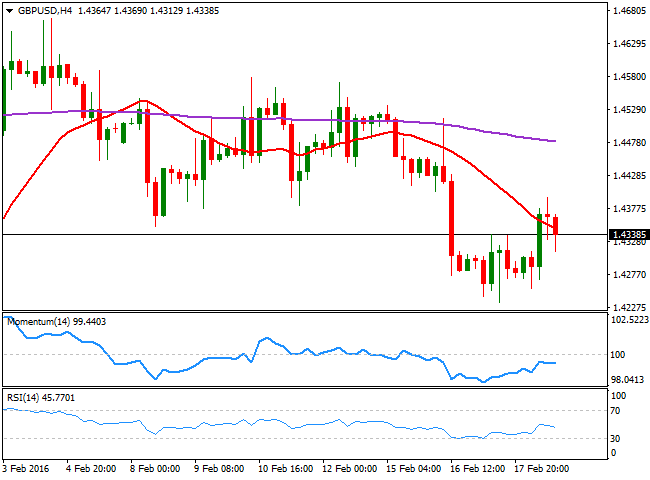
The GBP/USD pair advanced up to 1.4394 during the European session, as local share markets opened with a strong footing, tracking Asian stocks. But the pair trimmed most of its daily gains during the American session, and retreated towards its comfort zone around the 1.4300 level. There were no news in the UK to support the Pound, but this Friday, the kingdom will release its January Retail Sales data, expected to have grown compared to December figures. If that's the case, the British currency may result benefited. Nevertheless, the discussions surrounding a possible Brexit and the upcoming referendum on the matter, will probably keep the GBP subdued. The 1 hour chart shows that the pair is meeting short term buying interest around a bullish 20 SMA, whilst the technical indicators have retreated from overbought levels, but remain horizontal above their mid-lines. In the 4 hours chart, the price is back below a bearish 20 SMA , while the technical indicators have turned lower within negative territory and after correcting overbought readings, in line with another leg lower for this Friday.
Support levels: 1.4310 1.4265 1.4220
Resistance levels: 1.4370 1.4410 1.4450
USD/JPY Current price: 113.46
View Live Chart for the USD/JPY
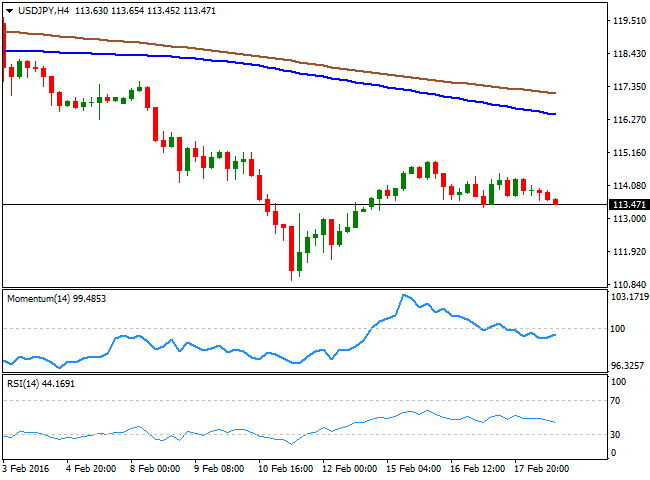
The USD/JPY approaches its weekly low ahead of the Asian session opening, having been unable to attract buyers, despite better mood among investors during the first half of the day, and positive US data. Declining US yields and the poor performance of Wall Street are helping the Japanese currency that slowly, but steadily approaches 113.37 against the greenback. The short term technical picture favors a continued decline for this Friday, as the price is below its 100 and 200 SMAs, both converging around 114.00, whilst the technical indicators head lower below their mid-lines. In the 4 hours chart, the moving averages are accelerating their declines well above the current level, while the RSI indicator anticipates a continued slide by heading lower around 44. A break below the mentioned weekly low should see the price declining down to the 112.50 region, a strong static support level, while a weekly close below this last level, exposes it to retest the low set this month around 111.00.
Support levels: 113.35 112.90 112.50
Resistance levels: 114.00 114.50 114.85
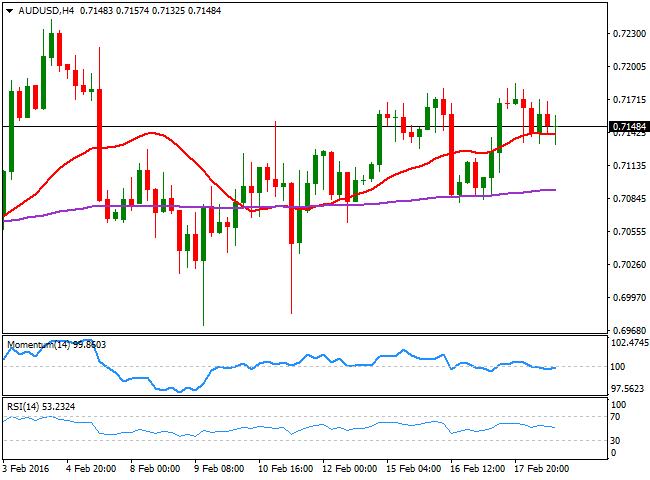
AUD/USD Current price: 0.7148
View Live Chart for the AUD/USD
The Aussie posted a moderated decline against the greenback this Thursday, hit at the beginning of the day by poor local employment data. According to the official data, the economy lost 7,900 jobs during January, while the unemployment rate jumped to 6.0% from the previous 5.8%, which spurred speculation that the RBA may be forced to cut rates in nearest future. A late decline in oil prices also weighed on the commodity-related currency, although is currently hovering some 40 pips below its daily high. Technically, the 1 hour chart presents a neutral-to-bearish stance, as the price has been contained by a bearish 20 SMA for most of this last session, while the technical indicators head nowhere around their mid-lines. In the 4 hours chart, the price is struggling around a horizontal 20 SMA, while the technical indicators have turned slightly lower around their mid-lines, lacking clear directional strength at the time being. At this point, however, it will take a break below 0.7070 to confirm a continued decline during this Friday, which may see the pair extending down to the 0.7000 region.
Support levels: 0.7110 0.7070 0.7025
Resistance levels: 0.7190 0.7240 0.7285
Information on these pages contains forward-looking statements that involve risks and uncertainties. Markets and instruments profiled on this page are for informational purposes only and should not in any way come across as a recommendation to buy or sell in these assets. You should do your own thorough research before making any investment decisions. FXStreet does not in any way guarantee that this information is free from mistakes, errors, or material misstatements. It also does not guarantee that this information is of a timely nature. Investing in Open Markets involves a great deal of risk, including the loss of all or a portion of your investment, as well as emotional distress. All risks, losses and costs associated with investing, including total loss of principal, are your responsibility. The views and opinions expressed in this article are those of the authors and do not necessarily reflect the official policy or position of FXStreet nor its advertisers. The author will not be held responsible for information that is found at the end of links posted on this page.
If not otherwise explicitly mentioned in the body of the article, at the time of writing, the author has no position in any stock mentioned in this article and no business relationship with any company mentioned. The author has not received compensation for writing this article, other than from FXStreet.
FXStreet and the author do not provide personalized recommendations. The author makes no representations as to the accuracy, completeness, or suitability of this information. FXStreet and the author will not be liable for any errors, omissions or any losses, injuries or damages arising from this information and its display or use. Errors and omissions excepted.
The author and FXStreet are not registered investment advisors and nothing in this article is intended to be investment advice.
Recommended Content
Editors’ Picks
AUD/USD holds hot Australian CPI-led gains above 0.6500

AUD/USD consolidates hot Australian CPI data-led strong gains above 0.6500 in early Europe on Wednesday. The Australian CPI rose 1% in QoQ in Q1 against the 0.8% forecast, providing extra legs to the Australian Dollar upside.
USD/JPY sticks to 34-year high near 154.90 as intervention risks loom

USD/JPY is sitting at a multi-decade high of 154.88 reached on Tuesday. Traders refrain from placing fresh bets on the pair as Japan's FX intervention risks loom. Broad US Dollar weakness also caps the upside in the major. US Durable Goods data are next on tap.
Gold price struggles to lure buyers amid positive risk tone, reduced Fed rate cut bets

Gold price lacks follow-through buying and is influenced by a combination of diverging forces. Easing geopolitical tensions continue to undermine demand for the safe-haven precious metal. Tuesday’s dismal US PMIs weigh on the USD and lend support ahead of the key US macro data.
Crypto community reacts as BRICS considers launching stablecoin for international trade settlement

BRICS is intensifying efforts to reduce its reliance on the US dollar after plans for its stablecoin effort surfaced online on Tuesday. Most people expect the stablecoin to be backed by gold, considering BRICS nations have been accumulating large holdings of the commodity.
US versus the Eurozone: Inflation divergence causes monetary desynchronization

Historically there is a very close correlation between changes in US Treasury yields and German Bund yields. This is relevant at the current juncture, considering that the recent hawkish twist in the tone of the Fed might continue to push US long-term interest rates higher and put upward pressure on bond yields in the Eurozone.
