EUR/USD Current Price: 1.1154
View Live Chart for the EUR/USD
For a change, it was China spurring risk appetite this Monday, as, after coming back from a long holiday, the Yuan appreciated around 1.2% against the greenback, the largest advance in over 10 years. Despite the Chinese Central Bank sets a daily reference rate, but the currency is allowed to float 2% higher or lower from the level, in a more market-driven movement. The Shanghai Composite closed the day 17 points lower, which, considering last week decline in worldwide stocks, can be called a victory. Other Asian share markets surged, leading to a strong advance in European ones, resulting in a decline in the EUR/USD pair down to 1.1127.
In Europe, the release of the EU trade balance showed that the region recorded a €24.3bn surplus in trade in goods with the rest of the world in December 2015, compared to a year before, with exports and imports rising by 3% each, in the same period. Mario Draghi offered a testimony before the European Parliament's Economic and Monetary Affairs Committee, but offered no surprises, reiterating that “the Governing Council will review and possibly reconsider the monetary policy stance in early March.”
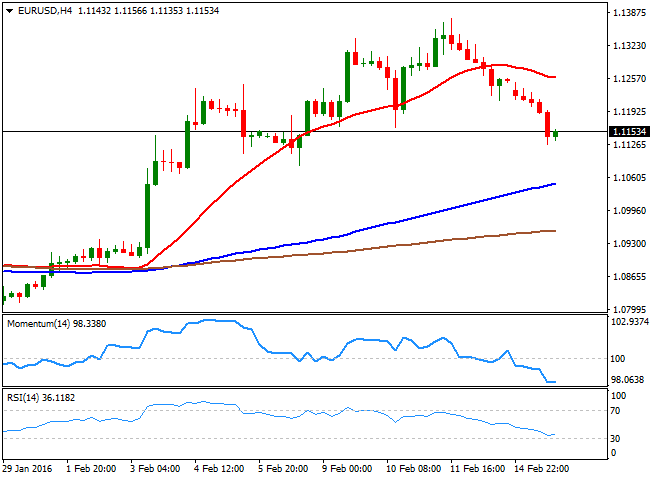
After posting the mentioned low, former intraday rallies remained capped by selling interest around 1.1160, the immediate short term resistance for this Tuesday, although the pair may continue recovering ground, given that in the short term, the downside seems exhausted. In the 1 hour chart, the technical indicators are bouncing from oversold readings, but the price is well below its moving averages, with the 20 SMA having crossed below the 100 and 200 SMAs, indicating upward moves may be barely corrective. In the 4 hours chart, the 20 SMA is well above the current level, while the technical indicators have lost their bearish potential near oversold readings, also supporting the case of a short term recovery. Nevertheless, the pair needs to settle firmly above the 1.1200 figure to continue recovering, while below 1.1120, a critical support, the risk will turn towards the downside.
Support levels: 1.1160 1.1120 1.1080
Resistance levels: 1.1200 1.1245 1.1290
EUR/JPY Current price: 127.84
View Live Chart for the EUR/JPY
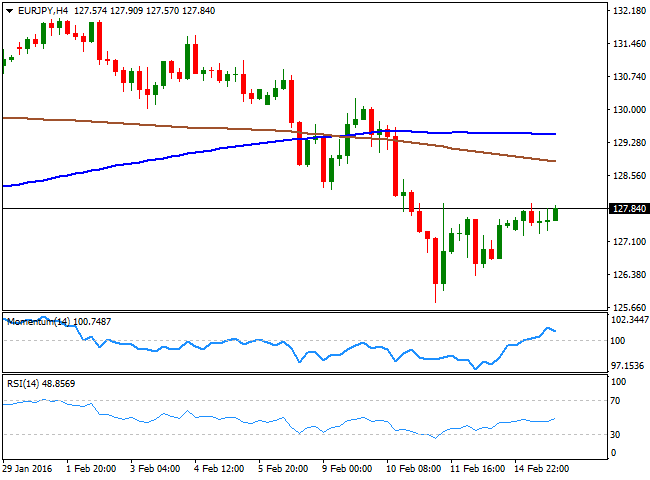
The Japanese yen weakened on poor local data, but the EUR/JPY pair posted a limited advance due to a more weaker EUR, which plummeted against all of its major rivals. The poor Japanese GDP figures, alongside with comments from China's central bank chief playing down the likelihood of a one-off devaluation of the Yuan, fueled risk appetite during the Asian session, with the sentiment extended during the European session. The EUR/JPY pair 1 hour chart shows that the 100 SMA contained the advance, with the price a few pips below it, currently at 127.90. In the same chart, the Momentum indicator stands flat around its 100 level, while the RSI indicator turned lower, but remains within positive territory around 57, all of which leaves a limited downward potential in the short term. In the 4 hours chart, the Momentum indicator has lost upward strength above its mid-line, while the RSI hovers around 48, and the price remains well below its moving averages, all of which limits the possibility of a strong advance.
Support levels: 127.25 126.80 126.30
Resistance levels: 127.90 128.40 128.90
GBP/USD Current price: 1.4439
View Live Chart for the GBP/USD
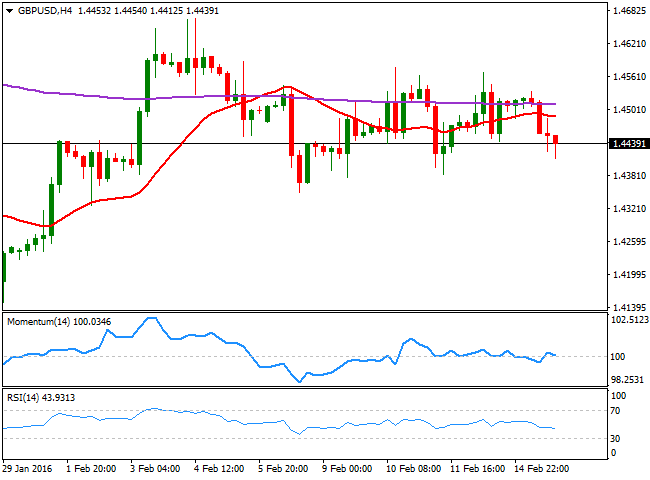
The British Pound remained under pressure, despite improved market mood, weighed by fears of a Brexit, and how it will affect the UK economy. The GBP/USD advanced up to 1.4534 at the beginning of the day, but was unable to sustain gains above the 1.4500 figure, and slowly slid during the rest of the day, nearing 1.4400 by the US afternoon. This Tuesday, the UK will release several key macroeconomic indicators, related to retail and producers' inflation, which may put the Pound under additional pressure, as January numbers are largely expected to come below December ones. In the meantime, the technical picture is bearish in the short term, as in the 1 hour chart, the technical indicators present tepid bearish slopes well below their mid-lines, while the 20 SMA turned lower around 1.4485. In the 4 hours chart, the price has faltered around its 200 EMA, and is also below a horizontal 20 SMA, while the technical indicators turned lower around their mid-lines, lacking enough bearish strength to confirm a new leg south. A break below 1.4395, on the other hand, may fuel the negative sentiment towards the Pound and result and a steady decline down to the 1.4250 region.
Support levels: 1.4390 1.14350 1.4310
Resistance levels: 1.4485 1.4530 1.4565
USD/JPY Current price: 114.56
View Live Chart for the USD/JPY
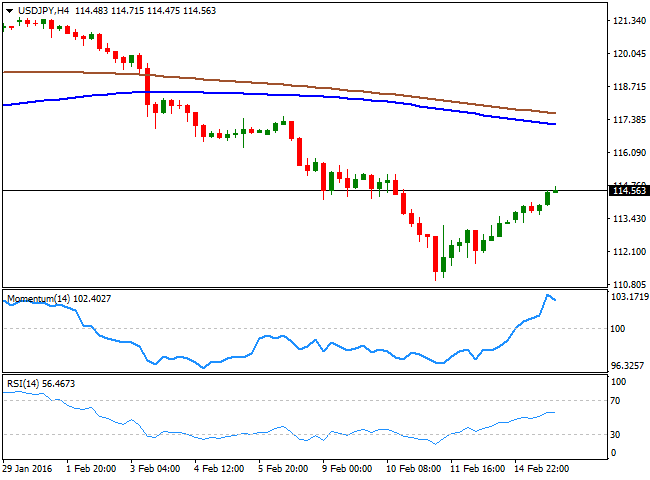
The USD/JPY pair surged up to 114.71 this Monday, with the Japanese yen under pressure on improved market mood and poor local data. The release of a disappointing GDP report for the last quarter of 2015 showed that the economy contracted by the end of the year by 1.4%, fueling hopes of further easing coming from the BOJ next March. Also, a sharp increase in the Yuan prevented Chinese shares from plummeting in the first day of trading after the long holiday, boosted Asian markets, sending the Nikkei sharply higher. Yen weakened against all of its major rivals, but the decline was proportionally poor, as the pair added barely 100 pips daily basis. Technically, the 1 hour chart shows that the price has overcome its 100 SMA, but remains below a bearish 200 SMA, currently around 115.20. In the same chart, the technical indicators have turned south within positive territory, rather reflecting the lack of volume than suggesting a bearish move. In the 4 hours chart, the Momentum indicator turned slightly lower in extreme overbought territory, while the RSI heads higher around 56, supporting some further gains on a break above the mentioned daily high.
Support levels: 114.10 113.70 113.35
Resistance levels: 114.75 115.20 115.60
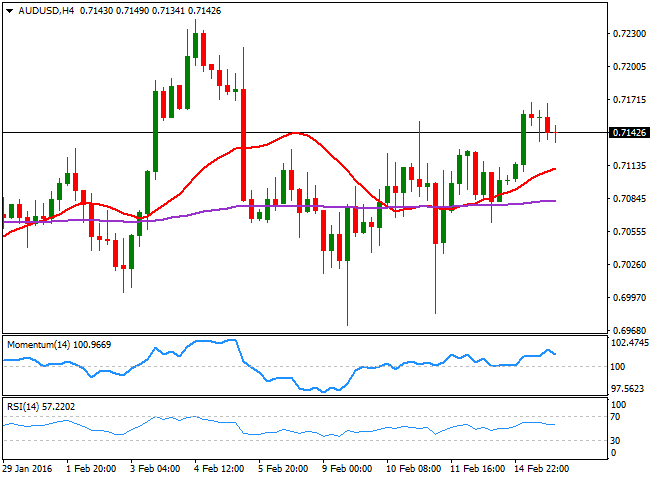
AUD/USD Current price: 0.7142
View Live Chart for the AUD/USD
The AUD/USD pair managed to advance at the beginning of the day, helped by a recovery in stocks and commodities. Gold was alone in its decline among base metal, dumped by speculators seeking for more profitable assets in a less risky market. Australia will release the Minutes of its latest meeting during the upcoming Asian session, although is hardly expected to bring surprises, given that most of the content was already released in Glenn Steven's speech right after the decision. The pair advanced up to 0.7168 intraday, but failed to advance beyond it in spite of several attempts, which suggests a limited upward potential for the upcoming sessions. Short term, the 1 hour chart shows that the price is struggling around a still bullish 20 SMA, while the technical indicators have turned lower around their mid-lines, lacking directional strength at the time being. In the 4 hours chart, however, the technical outlook is more constructive, given that the price is well above a bullish 20 SMA and its 200 EMA, while the technical indicators hold within positive territory.
Support levels: 0.7100 0.7060 0.7030
Resistance levels: 0.7170 0.7210 0.7245
Information on these pages contains forward-looking statements that involve risks and uncertainties. Markets and instruments profiled on this page are for informational purposes only and should not in any way come across as a recommendation to buy or sell in these assets. You should do your own thorough research before making any investment decisions. FXStreet does not in any way guarantee that this information is free from mistakes, errors, or material misstatements. It also does not guarantee that this information is of a timely nature. Investing in Open Markets involves a great deal of risk, including the loss of all or a portion of your investment, as well as emotional distress. All risks, losses and costs associated with investing, including total loss of principal, are your responsibility. The views and opinions expressed in this article are those of the authors and do not necessarily reflect the official policy or position of FXStreet nor its advertisers. The author will not be held responsible for information that is found at the end of links posted on this page.
If not otherwise explicitly mentioned in the body of the article, at the time of writing, the author has no position in any stock mentioned in this article and no business relationship with any company mentioned. The author has not received compensation for writing this article, other than from FXStreet.
FXStreet and the author do not provide personalized recommendations. The author makes no representations as to the accuracy, completeness, or suitability of this information. FXStreet and the author will not be liable for any errors, omissions or any losses, injuries or damages arising from this information and its display or use. Errors and omissions excepted.
The author and FXStreet are not registered investment advisors and nothing in this article is intended to be investment advice.
Recommended Content
Editors’ Picks
EUR/USD clings to daily gains above 1.0650

EUR/USD gained traction and turned positive on the day above 1.0650. The improvement seen in risk mood following the earlier flight to safety weighs on the US Dollar ahead of the weekend and helps the pair push higher.
GBP/USD recovers toward 1.2450 after UK Retail Sales data

GBP/USD reversed its direction and advanced to the 1.2450 area after touching a fresh multi-month low below 1.2400 in the Asian session. The positive shift seen in risk mood on easing fears over a deepening Iran-Israel conflict supports the pair.
Gold holds steady at around $2,380 following earlier spike

Gold stabilized near $2,380 after spiking above $2,400 with the immediate reaction to reports of Israel striking Iran. Meanwhile, the pullback seen in the US Treasury bond yields helps XAU/USD hold its ground.
Bitcoin Weekly Forecast: BTC post-halving rally could be partially priced in Premium

Bitcoin price shows no signs of directional bias while it holds above $60,000. The fourth BTC halving is partially priced in, according to Deutsche Bank’s research.
Week ahead – US GDP and BoJ decision on top of next week’s agenda

US GDP, core PCE and PMIs the next tests for the Dollar. Investors await BoJ for guidance about next rate hike. EU and UK PMIs, as well as Australian CPIs also on tap.
