EUR/USD Current Price: 1.1332
View Live Chart for the EUR/USD
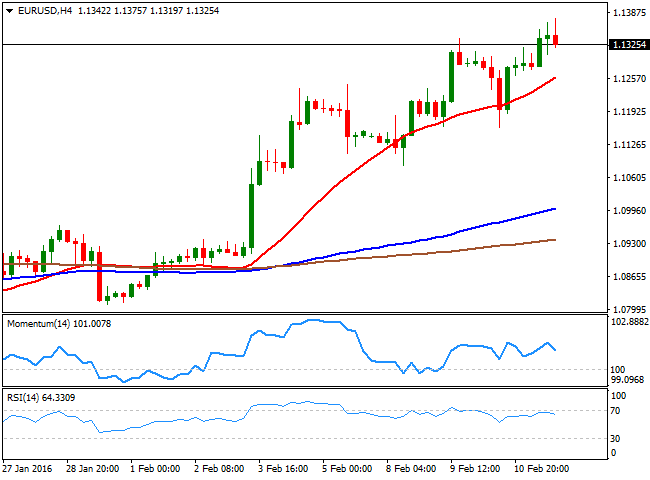
The common currency extended its rally to a fresh 4-month high against the greenback of 1.1375 this Thursday, as tumbling stocks and fresh multi-year lows in oil's prices fueled risk aversion trading. The movements were led by the Japanese yen that strengthened during the Asian session, in spite Japanese markets were close due to a local holiday, after FED's Yellen's delivered a cautious speech in the previous session. There were no fundamental releases in Europe, but in the US a positive surprise come from the weekly unemployment claims release, down to 269K for the week ending February 5, while Sweden's Riksbank surprised the market by delivering a 15bp rate cut today to take the repo rate to minus 50bp, fueling the negative mood among investors mid European session.
The pair retreated partially from the mentioned daily high, but remains firmly above 1.1300, consolidating its latest gains, and overall maintaining the bullish tone. That trend will be challenged during the upcoming European session, with the release of several macroeconomic figures, which include German inflation and the EU Gross Domestic Product. Should the data surprise to the upside, the pair can continue rallying up to 1.1460, particularly if the dollar retains the negative tone. Technically, the 4 hours chart shows that the 20 SMA heads higher around 1.1250, acting as a strong support in the case of further slides, while the technical indicators have lost upward steam and are currently heading lower within positive territory, suggesting the pair may correct lower, but far from signaling the end of the bullish trend.
Support levels: 1.1290 1.1245 1.1210
Resistance levels: 1.1385 1.1420 1.1460
EUR/JPY Current price: 127.01
View Live Chart for the EUR/JPY
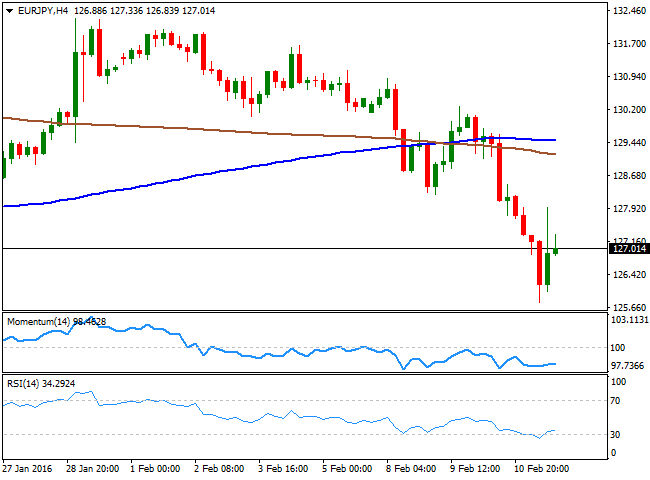
The Japanese yen was the overall winner this Thursday, adding over 5% intraday against most of its major rivals. The EUR/JPY fell down to 125.76 before bouncing over 200 pips on rumors of some BOJ's intervention, although no official source confirmed the act. After the dust settled, the pair retreated back towards the current 127.00 level where it consolidates, meeting short term selling interest on attempts to advance. The 1 hour chart shows that the price is currently far below its 100 and 200 SMAs, with the shortest around 128.80, while the technical indicators have bounced from extreme oversold readings, but lost upward strength below their mid-lines, indicating limited chances of further recoveries. In the 4 hours chart, the price is well below its moving averages, while the technical indicators have turned flat near oversold levels, also after correcting extreme readings, in line with the shorter term perspective.
Support levels: 127.70 127.25 126.80
Resistance levels: 128.40 128.90 129.35
GBP/USD Current price: 1.4463
View Live Chart for the GBP/USD
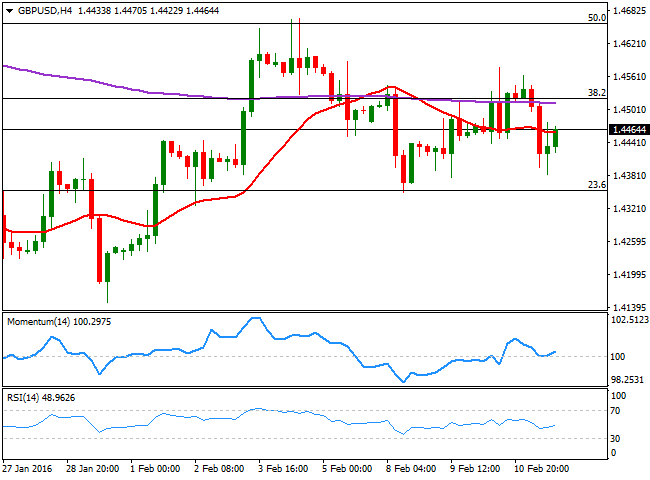
The British Pound was unable to attract investors, despite the generalized dollar's weakness, and the pair ended the day in the red. The GBP/USD pair advanced up to 1.4563 during the Asian session, but the movement was faded early Europe, as oil prices fell down to fresh multi-year lows, while the UK bond yields plummeted to record lows. There will be no macro released in Britain this Friday, which means that the pair will continue trading on sentiment. Technically, the 1 hour chart shows that the 20 SMA presents a strong bearish slope above the current level, in the 1.4490 region, while the technical indicators head higher within bearish territory. In the 4 hours chart, the technical indicators are aiming higher from their mid-lines, although with limited upward strength, while the price is struggling around a horizontal 20 SMA. A strong resistance continues being the 1.4520/30 region, as spikes beyond the level have result in sharp retracements several times over this last few days. Anyway and to confirm further rallies, the pair needs to advance beyond 1.4660, last week highs.
Support levels: 1.4410 1.4385 1.4350
Resistance levels: 1.4490 1.4535 1.4560
USD/JPY Current price: 112.00
View Live Chart for the USD/JPY
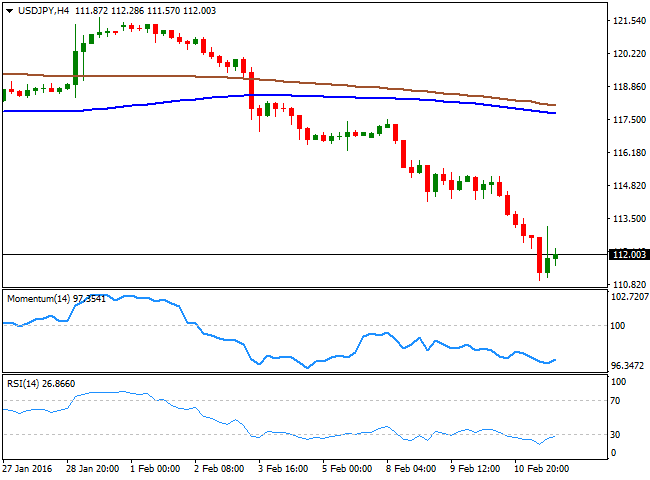
The USD/JPY fell over 250 pips this Thursday, down to 110.97 accumulating over 1,000 pips to the downside in less than two weeks, after peaking at 121.68 on BOJ's decision to cut rates into negative territory in their late January meeting. But during the European session, the pair jumped up to 113.17, on unconfirmed rumors that the Bank of Japan intervened in the FX markets to halt the appreciation of Yen. Besides that, speculation of some actual intervention during the upcoming session have increased as the day went by, and investors are actually expecting a bit more than the verbal intervention seen these last few days. From a technical point of view, the risk remains towards the downside, as in the 1 hour chart, the technical indicators are aiming to resume their declines within bearish territory, following a correction from extreme oversold levels. In the 4 hours chart, the technical indicators have posted tepid bounces, but remain within oversold readings, giving no signs of a change in the dominant trend.
Support levels: 111.60 111.20 110.70
Resistance levels: 112.35 112.75 113.20
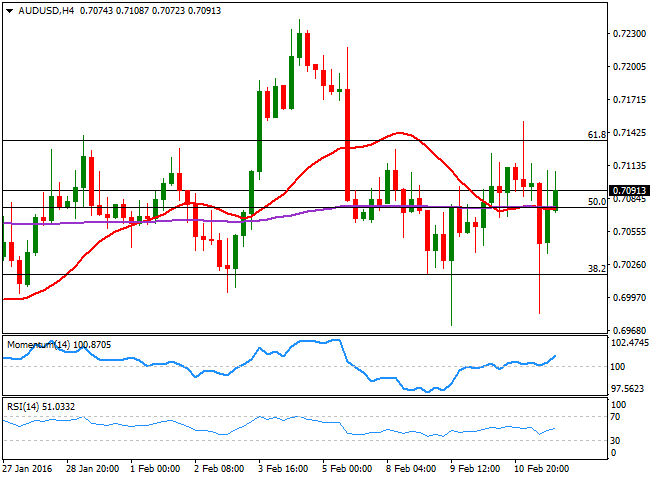
AUD/USD Current price: 0.7090
View Live Chart for the AUD/USD
The AUD/USD pair swung in a wide range this Thursday, up to 0.7152 and down to 0.6983, to finally end the day barely below its daily opening. The Aussie was favored earlier in the day by investors dumping the greenback, but falling oil prices dragged it down during European trading hours. Now near 0.7100, RB governor Stevens, is due to testify before the House Representatives' Standing Committee on Economics, in Sydney during the upcoming Asian session, and his comments will be closely watched for tips on upcoming economic policy decisions. The short term picture is neutral as the price is currently consolidating a few pips above a flat 20 SMA, while the technical indicators head nowhere around their mid-lines. In the 4 hours chart, a mild positive tone surges from the technical indicators that aim higher above their mid-lines, as the price advances above 0.7070, the 50% retracement of the latest weekly decline and a flat 20 SMA.
Support levels: 0.7070 0.7030 0.6980
Resistance levels: 0.7135 0.7170 0.7210
Information on these pages contains forward-looking statements that involve risks and uncertainties. Markets and instruments profiled on this page are for informational purposes only and should not in any way come across as a recommendation to buy or sell in these assets. You should do your own thorough research before making any investment decisions. FXStreet does not in any way guarantee that this information is free from mistakes, errors, or material misstatements. It also does not guarantee that this information is of a timely nature. Investing in Open Markets involves a great deal of risk, including the loss of all or a portion of your investment, as well as emotional distress. All risks, losses and costs associated with investing, including total loss of principal, are your responsibility. The views and opinions expressed in this article are those of the authors and do not necessarily reflect the official policy or position of FXStreet nor its advertisers. The author will not be held responsible for information that is found at the end of links posted on this page.
If not otherwise explicitly mentioned in the body of the article, at the time of writing, the author has no position in any stock mentioned in this article and no business relationship with any company mentioned. The author has not received compensation for writing this article, other than from FXStreet.
FXStreet and the author do not provide personalized recommendations. The author makes no representations as to the accuracy, completeness, or suitability of this information. FXStreet and the author will not be liable for any errors, omissions or any losses, injuries or damages arising from this information and its display or use. Errors and omissions excepted.
The author and FXStreet are not registered investment advisors and nothing in this article is intended to be investment advice.
Recommended Content
Editors’ Picks
EUR/USD retreats below 1.0700 after US GDP data

EUR/USD came under modest bearish pressure and retreated below 1.0700. Although the US data showed that the economy grew at a softer pace than expected in Q1, strong inflation-related details provided a boost to the USD.
GBP/USD declines below 1.2500 as USD rebounds

GBP/USD declined below 1.2500 and erased the majority of its daily gains with the immediate reaction to the US GDP report. The US economy expanded at a softer pace than expected in Q1 but the price deflator jumped to 3.4% from 1.8%.
Gold drops below $2,320 as US yields shoot higher

Gold lost its traction and turned negative on the day below $2,320 in the American session on Thursday. The benchmark 10-year US Treasury bond yield is up more than 1% on the day above 4.7% after US GDP report, weighing on XAU/USD.
XRP extends its decline, crypto experts comment on Ripple stablecoin and benefits for XRP Ledger

Ripple extends decline to $0.52 on Thursday, wipes out weekly gains. Crypto expert asks Ripple CTO how the stablecoin will benefit the XRP Ledger and native token XRP.
After the US close, it’s the Tokyo CPI

After the US close, it’s the Tokyo CPI, a reliable indicator of the national number and then the BoJ policy announcement. Tokyo CPI ex food and energy in Japan was a rise to 2.90% in March from 2.50%.
