EUR/USD Current Price: 1.0847
View Live Chart for the EUR/USD
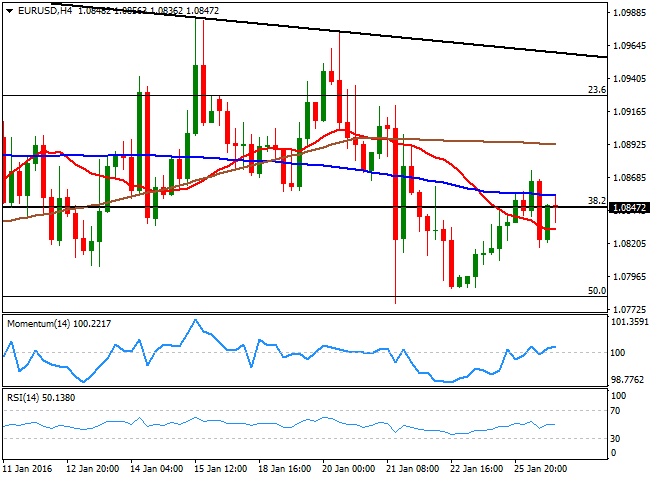
The common currency failed to attract investors this Tuesday, with the EUR/USD pair wobbling around the 1.0845 Fibonacci level for most of the day. Not even crude woes helped the pair in setting a direction, although it surely set the tone among stocks. The early decline in the commodity resulted in a sharp fall for Asian shares that extended early Europe. But mid London session, oil recovered above $31.00 a barrel, reverting the early risk-averse trading. The EUR/USD pair bounced form a daily low of 1.0810, helped by soft US data, as the service sector output expanded at the slowest pace since December 2014 according to the Markit Flash Services PMI for January, printing 53.7 against expectations of 54.0 and the previous 54.3. The manufacturing sector also suffered, as the Richmond Fed Manufacturing index shrunk to 2 in the same month, compared to expectations of 3.
The EUR/USD pair presents a neutral technical tone ahead of the FOMC's economic policy decision this Wednesday. The US Central Bank is largely expected to remain on-hold after raising rates for the first time in almost a decade last December. As for the technical picture, the 4 hours char shows that the price briefly fell below its 20 SMA, but is now holding above it, while the technical indicators head nowhere around their mid-lines, reflecting the ongoing market's uncertainty over the pair. Trading near the base of its latest range, the key is at the 1.0770/1.0800 region, where the pair met buying interest even since the year started, and even has the 50% retracement of the December rally. A break below the level should open doors for a steady decline towards the 1.0715 region, the 61.8% retracement of the same rally.
Support levels: 1.0780 1.0745 1.0710
Resistance levels: 1.0845 1.0890 1.0925
EUR/JPY Current price: 128.57
View Live Chart for the EUR/JPY
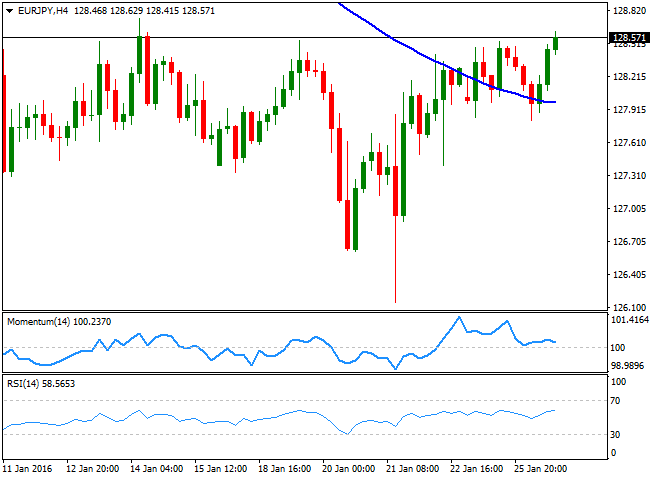
The EUR/JPY pair trades near a three-week high, as the Japanese yen sheds ground following a strong recovery in US stocks, although the pair remains confined within a tight range, given that the EUR and the JPY move in tandem against the greenback. The 1 hour chart shows that the pair fell down to its 100 SMA early Asia, at 128.08, where buying interest resurged. Currently hovering near 128.60, the technical indicators in the same chart head higher above their mid-lines, favoring some further short term gains. In the 4 hours chart, the price remains above its 100 SMA, which actually lost its bearish slope and is now horizontal around 128.00, while the technical indicators remain directionless above their mid-lines, limiting chances of a stronger advance. This January high stands at 129.07, and will take some steady advance beyond the level to see some further gains during the upcoming sessions.
Support levels: 128.00 127.60 127.25
Resistance levels: 129.10 129.60 130.00
GBP/USD Current price: 1.4349
View Live Chart for the GBP/USD
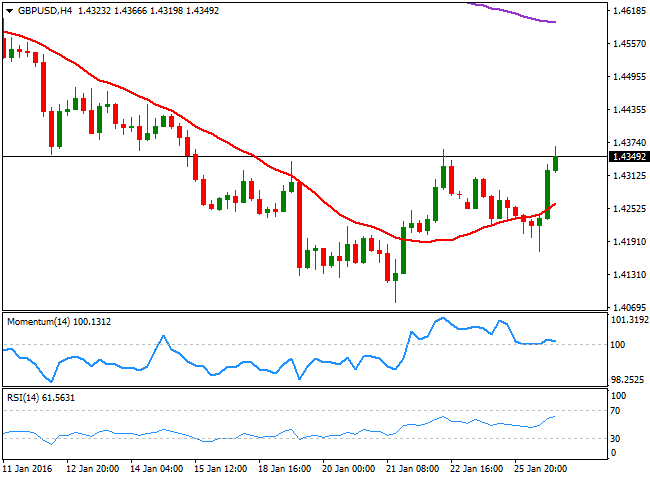
The GBP/USD pair rallied in the American afternoon, overcoming last week high by a handful of pips by posting 1.4366. Earlier in the day, BOE's Governor Mark Carney testified on the Financial Stability Report before the Treasury Select Committee, where he said that Brexit adds to UK current account risk, which is still a risk to financial stability. He also said that rates could go lower from current levels, but markets seem to have already priced in that there won't be rate hikes in the UK during this 2016, ignoring the comment. Holding near its daily high, the short term picture is bullish for the pair, as in the 1 hour chart, the price is well above a now bullish 20 SMA, while the technical indicators have lost upward steam near overbought territory, but are far from signaling a reversal at the time being. In the 4 hours chart, the 20 SMA heads higher around 1.4265, providing a strong support for this Wednesday, while the technical indicators show no directional strength, but stand in positive territory.
Support levels: 1.4310 1.4265 1.4220
Resistance levels: 1.4365 1.4400 1.4440
USD/JPY Current price: 118.54
View Live Chart for the USD/JPY
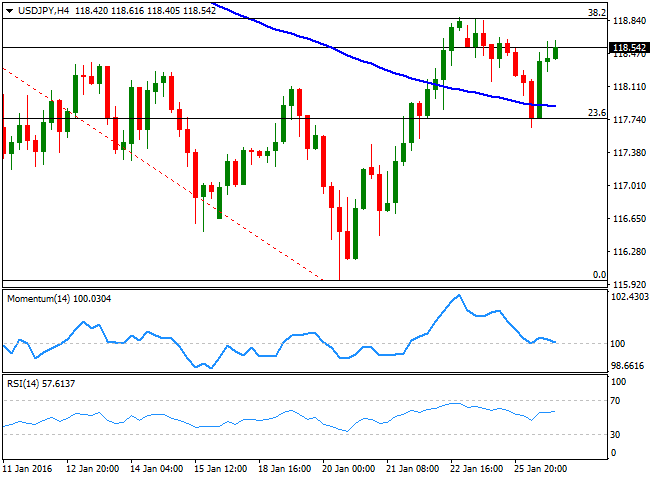
After an early slide down to 117.65, the USD/JPY pair recovered ground, and extended up to 118.61 in the American afternoon, helped by the recovery of worldwide stocks, and on mounting speculation that the BOJ may announce some extension to the current stimulus program, in their economic policy meeting later this week. The 1 hour chart shows that the price bounced from around its 100 and 200 SMAs, and from the 23.6% retracement of the latest daily slide, around 117.70. In the same chart, the Momentum indicator heads higher above the 100 level, while the RSI is turning lower around 59, reflecting some easing in the upward strength. In the 4 hours chart, the Momentum indicator heads south in positive territory, and aims to cross its mid-line towards the downside, while the RSI indicator remains flat around 58. The pair has a major resistance at 118.90, the 38.2% retracement of the same decline and Friday's high. It would take some steady gains beyond the level to see the rally extending, up to 119.70 during the upcoming sessions.
Support levels: 118.15 117.70 117.30
Resistance levels: 118.90 119.35 119.70
AUD/USD Current price: 0.7013
View Live Chart for the AUD/USD
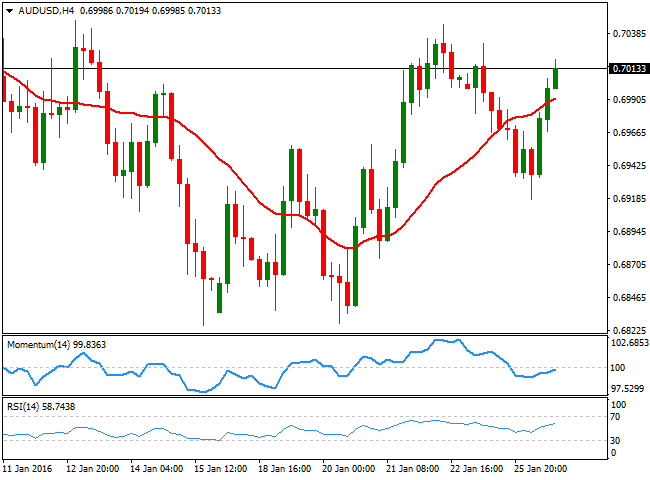
The Australian dollar recovered above the 0.7000 level against the greenback, with the Aussie trading alongside with oil's prices all through the day. Australian markets were closed this Tuesday due to a local holiday, and no data were released in the country, but the country will reveal its latest quarterly inflation figures during the upcoming hours, which may interrupt the ongoing upward momentum in the AUD if the readings miss expectations. Technically, the 1 hour chart shows that the price remains near its highs and above a bullish 20 SMA, but also that the technical indicators have turned south from near overbought territory. In the 4 hours chart, the price is currently advancing above a bullish 20 SMA, while the technical indicators head higher around their mid-lines, still unable to confirm a stronger rally. The immediate resistance stands at 0.7040, a tough static resistance level, with some follow through beyond it required to see the rally extending towards the 0.7100 figure.
Support levels: 0.6960 0.6920 0.6870
Resistance levels: 0.7040 0.7075 0.711
Information on these pages contains forward-looking statements that involve risks and uncertainties. Markets and instruments profiled on this page are for informational purposes only and should not in any way come across as a recommendation to buy or sell in these assets. You should do your own thorough research before making any investment decisions. FXStreet does not in any way guarantee that this information is free from mistakes, errors, or material misstatements. It also does not guarantee that this information is of a timely nature. Investing in Open Markets involves a great deal of risk, including the loss of all or a portion of your investment, as well as emotional distress. All risks, losses and costs associated with investing, including total loss of principal, are your responsibility. The views and opinions expressed in this article are those of the authors and do not necessarily reflect the official policy or position of FXStreet nor its advertisers. The author will not be held responsible for information that is found at the end of links posted on this page.
If not otherwise explicitly mentioned in the body of the article, at the time of writing, the author has no position in any stock mentioned in this article and no business relationship with any company mentioned. The author has not received compensation for writing this article, other than from FXStreet.
FXStreet and the author do not provide personalized recommendations. The author makes no representations as to the accuracy, completeness, or suitability of this information. FXStreet and the author will not be liable for any errors, omissions or any losses, injuries or damages arising from this information and its display or use. Errors and omissions excepted.
The author and FXStreet are not registered investment advisors and nothing in this article is intended to be investment advice.
Recommended Content
Editors’ Picks
AUD/USD hovers around 0.6500 amid light trading, ahead of US GDP

AUD/USD is trading close to 0.6500 in Asian trading on Thursday, lacking a clear directional impetus amid an Anzac Day holiday in Australia. Meanwhile, traders stay cautious due ti risk-aversion and ahead of the key US Q1 GDP release.
USD/JPY finds its highest bids since 1990, near 155.50

USD/JPY keeps breaking into its highest chart territory since June of 1990 early Thursday, testing 155.50 for the first time in 34 years as the Japanese Yen remains vulnerable, despite looming Japanese intervention risks. Focus shifts to Thursday's US GDP report and the BoJ decision on Friday.
Gold price treads water near $2,320, awaits US GDP data

Gold price recovers losses but keeps its range near $2,320 early Thursday. Renewed weakness in the US Dollar and the US Treasury yields allow Gold buyers to breathe a sigh of relief. Gold price stays vulnerable amid Middle East de-escalation, awaiting US Q1 GDP data.
Injective price weakness persists despite over 5.9 million INJ tokens burned

Injective price is trading with a bearish bias, stuck in the lower section of the market range. The bearish outlook abounds despite the network's deflationary efforts to pump the price. Coupled with broader market gloom, INJ token’s doomed days may not be over yet.
Meta Platforms Earnings: META sinks 10% on lower Q2 revenue guidance Premium

This must be "opposites" week. While Doppelganger Tesla rode horrible misses on Tuesday to a double-digit rally, Meta Platforms produced impressive beats above Wall Street consensus after the close on Wednesday, only to watch the share price collapse by nearly 10%.
