EUR/USD Current price: 1.0911
View Live Chart for the EUR/USD
The American dollar ended mostly higher in the last full trading day of this 2015, as many markets will be closed this Thursday, while others, like the US, will have an early close ahead of the New Year holiday on Friday. At the end of a tumultuous year, the greenback stands victorious across the board, as the US Central Bank was the first to shift its economic policy towards tightening, in world were easing is still a possibility. It's true, the dollar has been unable to advance after the announcement of the first rate hike this December, yet is also certain that market players have been pricing it in, at least since last April.
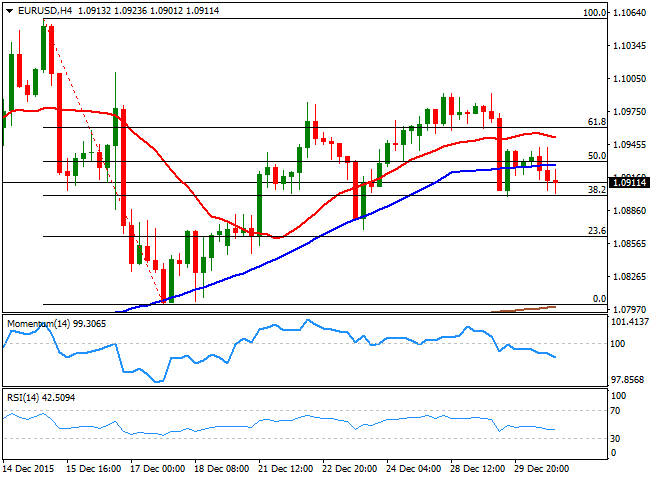
The EUR/USD pair stands around the 1.0900 figure, 12 cents below the year opening, and it has been unable to establish a clear directional strength ever since bottoming at 1.0461 and bouncing in correction mode. Anyway, there are little reasons for the EUR to strengthen in the term, but at this point, the downside is still seen limited. Shorter term, Tuesday saw the release of US pending home sales that showed an unexpected decline, down for the third time in four months in November, as the index decreased 0.9% to 106.9 from an upwardly revised 107.9 in October.
Technically, the 4 hours chart shows that the price has remained below a now bearish 20 SMA, while the technical indicators head lower below their mid-lines, in line with additional declines. Nevertheless, short term buying interest has appeared around the 1.0900 figure, the 38.2% retracement of the latest daily decline. Some additional declines below the 1.0880/1.09000 figure is required to talk about a possible bearish move during the following sessions, and once the market returns to normal.
Support levels: 1.0890 1.0840 1.0800
Resistance levels: 1.0930 1.0960 1.1000
EUR/JPY Current price: 131.58
View Live Chart for the EUR/JPY
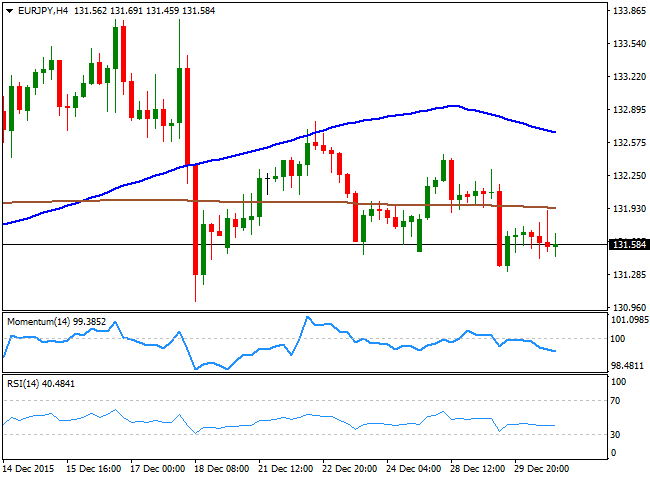
The EUR/JPY pair trades pretty much unchanged from its daily opening, maintaining the generally negative tone and meeting selling interest on approaches to the 132.00 level. The technical picture is bearish, as in the daily chart, the pair has remained confined within the lower half of Tuesday's range, and the technical indicators continue headings south within bearish territory, while the 100 DMA continues heading south above the current level. Shorter, term and in the 4 hours chart the technical picture is also bearish, as the price is developing below its 100 and 200 SMAs, and the technical indicators head lower below their mid-lines.
Support levels: 131.30 130.90 130.50
Resistance levels: 131.85 132.20 132.60
GBP/USD Current price: 1.4825
View Live Chart for the GBP/USD
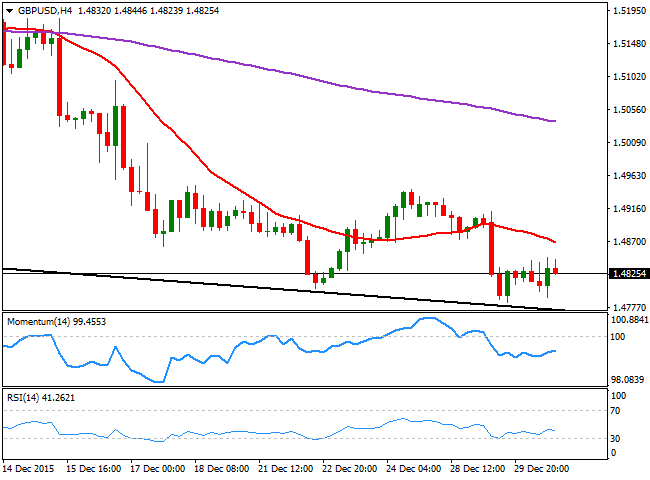
The GBP/USD pair started the day with a positive tone, advancing towards the 1.4850 region, where selling interest has capped short term rallies. The British Pound has entered a selling spiral during these last few months, as slowing growth in the kingdom has reduced chances of a rate hike during the first half of 2016, as initially speculated. Furthermore, the Pound has been suffering lately due to a potential referendum on Britain's future within the EU, to be held as soon as next June. As for this Wednesday, the UK house prices rose by 0.8% in December, according to the Nationwide index, with the annual pace of house price growth up to 4.5%. The GBP/USD pair continues trading near the base of the bearish channel that leads the way since mid September and the 4 hours technical readings favor further declines, as the price is well below a bearish 20 SMA while the technical indicators hover near oversold territory, showing no directional strength amid the ongoing lack of volume.
Support levels: 1.4785 1.4740 1.4700
Resistance levels: 1.4850 1.4890 1.4920
USD/JPY Current price: 120.60
View Live Chart for the USD/JPY
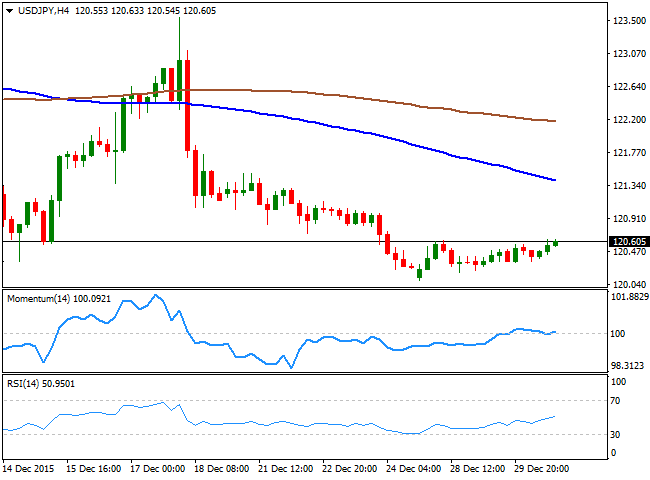
The USD/JPY pair traded within a 30 pips range for a third day in-a-row, ending the day with some gains as the dollar advanced in thin markets. The pair has been lifeless ever since the winter holiday season began, and will likely remain so until the release of US December employment data early January. The longer term stance is still bearish, as in the daily chart the technical indicators hold within negative territory, while the 100 SMA caps the upside around 121.10. Shorter term, and according to the 4 hours chart, the pair can advance some, given that the technical indicators aim higher above their mid-lines, yet gains are seen limited by a strongly bearish 100 SMA heading south around 121.45. Nevertheless, the pair will likely require a strong catalyst to break above this last, and be able, then, to establish a more constructive upward scenario.
Support levels: 120.35 120.00 119.60
Resistance levels: 120.70 121.10 121.45
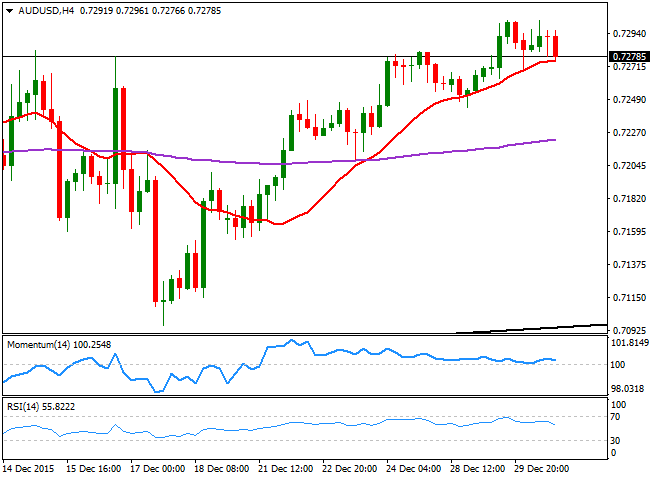
AUD/USD Current price: 0.7278
View Live Chart for the AUD/USD
The Aussie edged lower against its American rival, weighed by a decline in commodities, and as gold break lower, hitting a fresh 2-week low. The AUD/USD pair remained confined to a tight range above the 0.7240 level, overall positive. With limited action expected during the upcoming Asian session, the 4 hours chart for the pair shows that the price is now standing above a horizontal 20 SMA, while the technical indicators have turned slightly lower above their mid-lines. The chart also shows that the price has failed to advance beyond 0.7300 on several attempts during the last two days, although the level to watch is 0.7330, as it will be only above this last that the pair will be gaining some further upward potential for the following sessions.
Support levels: 0.7280 0.7240 0.7200
Resistance levels: 0.7330 0.7365 0.7400
Information on these pages contains forward-looking statements that involve risks and uncertainties. Markets and instruments profiled on this page are for informational purposes only and should not in any way come across as a recommendation to buy or sell in these assets. You should do your own thorough research before making any investment decisions. FXStreet does not in any way guarantee that this information is free from mistakes, errors, or material misstatements. It also does not guarantee that this information is of a timely nature. Investing in Open Markets involves a great deal of risk, including the loss of all or a portion of your investment, as well as emotional distress. All risks, losses and costs associated with investing, including total loss of principal, are your responsibility. The views and opinions expressed in this article are those of the authors and do not necessarily reflect the official policy or position of FXStreet nor its advertisers. The author will not be held responsible for information that is found at the end of links posted on this page.
If not otherwise explicitly mentioned in the body of the article, at the time of writing, the author has no position in any stock mentioned in this article and no business relationship with any company mentioned. The author has not received compensation for writing this article, other than from FXStreet.
FXStreet and the author do not provide personalized recommendations. The author makes no representations as to the accuracy, completeness, or suitability of this information. FXStreet and the author will not be liable for any errors, omissions or any losses, injuries or damages arising from this information and its display or use. Errors and omissions excepted.
The author and FXStreet are not registered investment advisors and nothing in this article is intended to be investment advice.
Recommended Content
Editors’ Picks
EUR/USD fluctuates in daily range above 1.0600

EUR/USD struggles to gather directional momentum and continues to fluctuate above 1.0600 on Tuesday. The modest improvement seen in risk mood limits the US Dollar's gains as investors await Fed Chairman Jerome Powell's speech.
GBP/USD stabilizes near 1.2450 ahead of Powell speech

GBP/USD holds steady at around 1.2450 after recovering from the multi-month low it touched near 1.2400 in the European morning. The USD struggles to gather strength after disappointing housing data. Market focus shifts to Fed Chairman Powell's appearance.
Gold retreats to $2,370 as US yields push higher

Gold stages a correction on Tuesday and fluctuates in negative territory near $2,370 following Monday's upsurge. The benchmark 10-year US Treasury bond yield continues to push higher above 4.6% and makes it difficult for XAU/USD to gain traction.
XRP struggles below $0.50 resistance as SEC vs. Ripple lawsuit likely to enter final pretrial conference

XRP is struggling with resistance at $0.50 as Ripple and the US Securities and Exchange Commission (SEC) are gearing up for the final pretrial conference on Tuesday at a New York court.
US outperformance continues

The economic divergence between the US and the rest of the world has become increasingly pronounced. The latest US inflation prints highlight that underlying inflation pressures seemingly remain stickier than in most other parts of the world.
