EUR/USD Current price: 1.0913
View Live Chart for the EUR/USD
The EUR/USD pair traded quietly for most of this Wednesday, confined to a tight 50 pips range below the 1.0960 level ahead of the US Central Bank decision. The calendar was pretty busy ever since the day started, as earlier today, the Markit flash estimates for the PMIs for December in the EU, showed that the region continued growing at a solid pace. In Germany, the manufacturing PMI rose to 53 as expected, whilst the service sector printed 55.4, slightly below the previous 55.6, but still strong. The EU figures were quite similar, with manufacturing outpacing services' growth.
In the US, a positive surprise came from the housing sector, as new home starts climbed by 10.5% in November, to a 1.17 million annualized rate. The Markit flash US manufacturing PMI for December, however, fell from a 54 previous to 51.3, while Industrial Production for November also missed expectations, indicating the US economy has grew at a slower pace. Dollar initially gained following the FED's announcement by 25bp by an unanimous decision, while authorities warned that current conditions warrant only gradual rate increases in the future. The economic forecasts for the upcoming years were less than upbeat, with the outlook for 2016 remaining relatively unchanged.
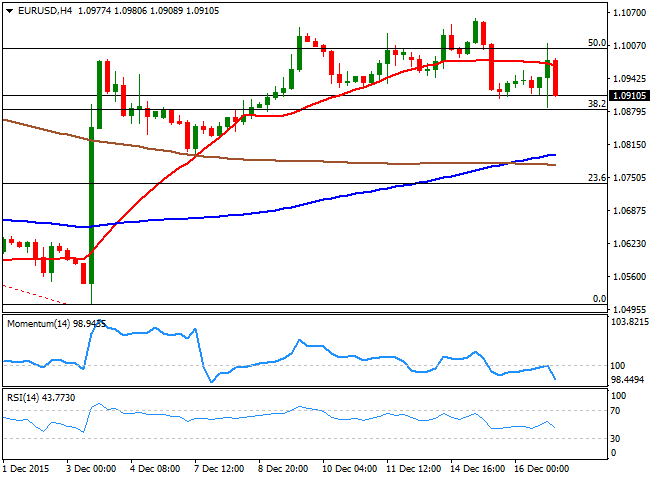
The EUR/USD pair fell down to 1.0887, but dollar's momentum was reversed with Yellen comments and press conference, as the head of the FED said "we’re hiking now to avoid more hikes later." The extremely dovish comment sent the EUR/USD up to a daily high of 1.1010 and leaves the greenback down across the board. From a technical point of view, the pair has remained contained within Fibonacci levels, and in the 4 hours chart, the pair seems far from picking up momentum, giving that the price is unable to extend beyond a flat 20 SMA while the technical indicators turned lower after failing to overcome their mid-lines. The long term picture is dollar bullish, as the FED's decision has just widened the Central Bank's imbalance, although with the winter holidays around the corner, choppy trading will be the name of the game during the upcoming weeks.
Support levels: 1.0880 1.0840 1.0800
Resistance levels: 1.0960 1.1010 1.1045
EUR/JPY Current price: 133.64
View Live Chart for the EUR/JPY
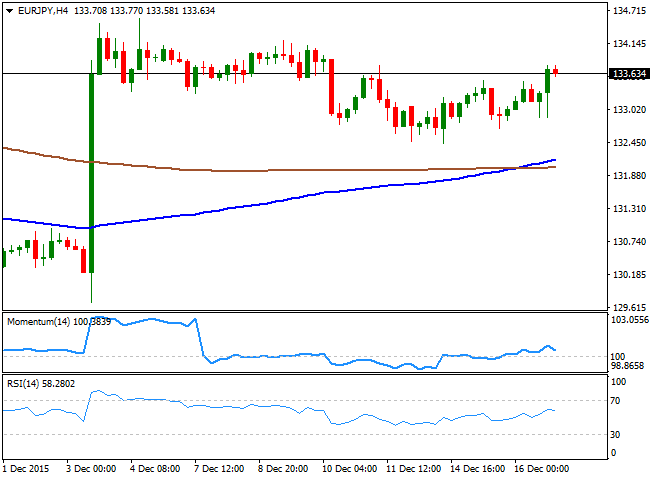
The EUR/JPY pair managed to advance some on the back of EUR gains during the American afternoon, but the soft recovery is yet not enough to talk about a bullish continuation in the pair, given that in the daily chart, the price remains below a bearish 100 SMA, now the immediate resistance at 133.90 and the level to break in the short term to confirm a more constructive outlook. Short term, the 1 hour chart shows that the price is currently developing above the 100 and 200 SMA, with the shortest below the largest, which means the upward momentum is not confirmed, while the technical indicators are retreating from their highs, but remain above their mid-lines. In the 4 hours charts, the price advanced some above its 100 and 200 SMAs, with the shortest breaking above the largest, but both lacking directional strength at the time being, while the technical indicators turned lower above their mid-lines maintaining a neutral tone ahead of the Asian opening.
Support levels: 133.10 132.55 132.10
Resistance levels: 133.90 134.40 134.85
GBP/USD Current price: 1.5020
View Live Chart for the GPB/USD
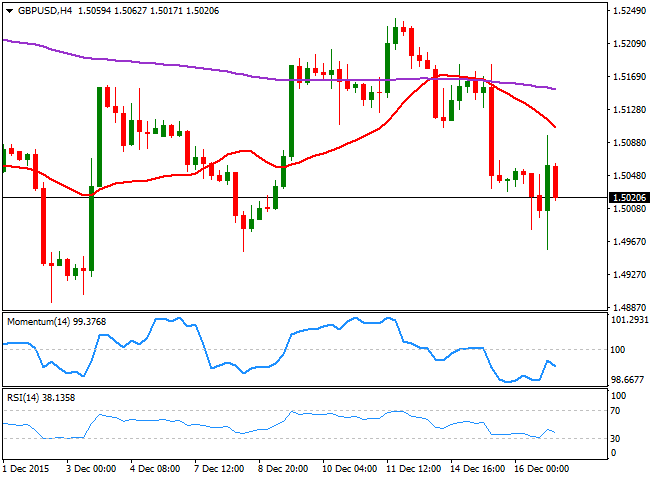
The GBP/USD fell down to 1.4981 early in the European morning, following the release of a mixed UK labour report. The number of unemployment people in the UK grew more than expected in November, up to 3.9K from a previous 3.3K, although the economy added 207K new jobs in the three months to October. Wages resulted weaker-than-expected in October as the average earnings including bonus and excluding bonus missed estimates to print at 2.4% and 2.0% respectively. The pair later fell down to 1.4957 and bounced up to a daily high of 1.5097, on the back of FED's announcement, but the dollar seems to be winning the battle ahead of the Asian opening, and the pair maintains its short term bearish tone. In the 1 hour chart, the price stands now below its 20 SMA while the technical indicators were rejected from their mid-lines and head lower into negative territory, while in the 4 hours chart, the price stalled well below a bearish 20 SMA as the technical indicators resume their declines well into negative territory, all of which supports further declines for this Thursday.
Support levels: 1.4980 1.4940 1.4890
Resistance levels: 1.5050 1.5090 1.5135
USD/JPY Current price: 122.10
View Live Chart for the USD/JPY
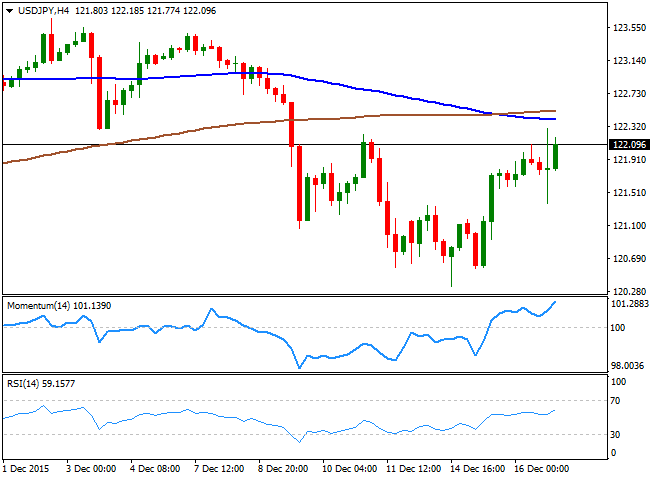
The US dollar picked up significant strength versus its Japanese rival following the 25bps Fed rate hike decision, although the USD/JPY pair was unable to recover beyond the critical resistance, and former support at 122.20. The pair posted a daily high of 122.90 before Yellen's dovish words sent the pair back lower. Nevertheless, dollar bulls resumed their buying after the dust settled, and the pair trades near the mentioned high, maintaining a positive short term tone. In the 1 hour chart, the price is now advancing above its 200 SMA for the first time in over a week, while the technical indicators present a strong upward momentum, heading north almost vertically. In the 4 hours chart, the Momentum indicator heads higher well above the 100 level whilst the RSI indicator also aims north around 60, in line with further advances towards the 123.00 figure, particularly on a break above the mentioned resistance.
Support levels: 121.70 121.30 121.00
Resistance levels: 122.20 122.60 123.00
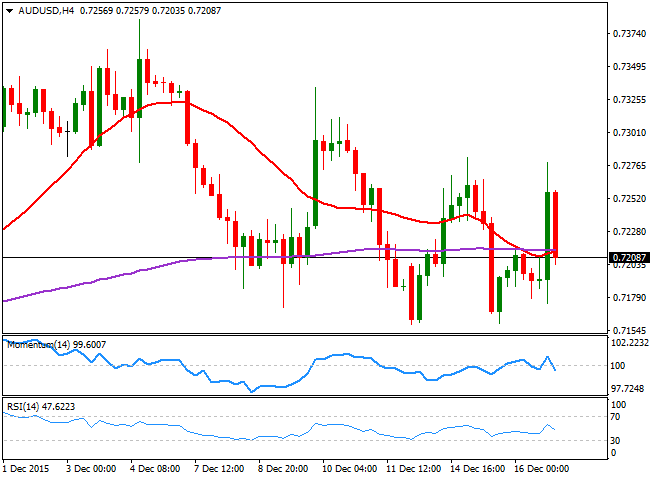
AUD/USD Current price: 0.7209
View Live Chart for the AUD/USD
The AUD/USD pair was not immune to post-FED volatility, trading as high as 0.7278 on the back of Yellen's soft tone, and before returning to the 0.7200 region. The Aussie is still among the strongest currencies against the greenback, and the downside potential is limited, given that a dip towards 0.7170 resulted in a strong bounce. Despite the wide range, the 1 hour chart shows a relatively positive tone as the price is holding above a bullish 20 SMA, while the technical indicators retreated from near overbought levels and head lower, but above their mid-lines. In the 4 hours chart, the price is stuck around its 20 SMA and the 200 EMA, both converging at 0.7210, while the technical indicators turned lower around their mid-lines, rather reflecting the latest lack of directional strength than suggesting a downward move ahead. The main resistance in the short term is 0.7240, and a recovery above should lead to a run up to 0.7285, en route to the key 0.7335 level.
Support levels: 0.7160 0.7125 0.7090
Resistance levels: 0.7240 0.7285 0.7335
-------
What will 2016 bring to the Forex traders? Attend our event, Forex Forecast 2016 - The Panel with Ashraf Laidi, Valeria Bednarik, Boris Schlossberg, Adam Button, Ivan Delgado and Dale Pinkert. Register for the live event on Dec. 18th and get the recording too.
-------
Information on these pages contains forward-looking statements that involve risks and uncertainties. Markets and instruments profiled on this page are for informational purposes only and should not in any way come across as a recommendation to buy or sell in these assets. You should do your own thorough research before making any investment decisions. FXStreet does not in any way guarantee that this information is free from mistakes, errors, or material misstatements. It also does not guarantee that this information is of a timely nature. Investing in Open Markets involves a great deal of risk, including the loss of all or a portion of your investment, as well as emotional distress. All risks, losses and costs associated with investing, including total loss of principal, are your responsibility. The views and opinions expressed in this article are those of the authors and do not necessarily reflect the official policy or position of FXStreet nor its advertisers. The author will not be held responsible for information that is found at the end of links posted on this page.
If not otherwise explicitly mentioned in the body of the article, at the time of writing, the author has no position in any stock mentioned in this article and no business relationship with any company mentioned. The author has not received compensation for writing this article, other than from FXStreet.
FXStreet and the author do not provide personalized recommendations. The author makes no representations as to the accuracy, completeness, or suitability of this information. FXStreet and the author will not be liable for any errors, omissions or any losses, injuries or damages arising from this information and its display or use. Errors and omissions excepted.
The author and FXStreet are not registered investment advisors and nothing in this article is intended to be investment advice.
Recommended Content
Editors’ Picks
EUR/USD climbs to 10-day highs above 1.0700

EUR/USD gained traction and rose to its highest level in over a week above 1.0700 in the American session on Tuesday. The renewed US Dollar weakness following the disappointing PMI data helps the pair stretch higher.
GBP/USD extends recovery beyond 1.2400 on broad USD weakness

GBP/USD gathered bullish momentum and extended its daily rebound toward 1.2450 in the second half of the day. The US Dollar came under heavy selling pressure after weaker-than-forecast PMI data and fueled the pair's rally.
Gold rebounds to $2,320 as US yields turn south

Gold reversed its direction and rose to the $2,320 area, erasing a large portion of its daily losses in the process. The benchmark 10-year US Treasury bond yield stays in the red below 4.6% following the weak US PMI data and supports XAU/USD.
Here’s why Ondo price hit new ATH amid bearish market outlook Premium

Ondo price shows no signs of slowing down after setting up an all-time high (ATH) at $1.05 on March 31. This development is likely to be followed by a correction and ATH but not necessarily in that order.
Germany’s economic come back

Germany is the sick man of Europe no more. Thanks to its service sector, it now appears that it will exit recession, and the economic future could be bright. The PMI data for April surprised on the upside for Germany, led by the service sector.
